CONTROL AND DETECTION OF NUCLEIC ACID HYBRIDIZATION AT THE INTERFACE OF POLYMERIC SUBSTANCES BY
SURFACE PLASMON RESONANCE
Yasunobu Sato
Keio University
Yokohama, Japan
Copyright © 2004 Yasunobu Sato
All rights reserved.
Acknowledgements
I would like to gratefully acknowledge Prof. Dr. Haruma Kawaguchi for his helpful guidance and suggestions since the present work was started. His reliable guidance greatly aided in the efficient completion of this thesis.
I would also like to express great gratitude to the counseling committee members for my Ph.D. dissertation under Prof. Dr. Shuichi Matsumura, Prof. Dr. Koji Suzuki, Prof. Dr.
Kazunobu Toshima and Assoc. Prof. Dr. Keiji Fujimoto for their careful reviewing and helpful suggestions on the manuscript. All of their frank criticisms and opinions concerning this thesis were extremely valuable and made this thesis acceptable as a Ph. D. dissertation.
Furthermore, this work could not have been prepared without the support of the colleagues of the polymer science laboratory. It was really a great honor to work with the students and I thank all of them who gave generously their time and talents to help me in many aspects. More than anything else, this work could not have been completed without research partners, Mr.
Shinichi Ikegaki, Ms. Yuka Sato and Ms. Aya Okumura, who contributed to the present work with actual experiments or in other ways. I would also like to thank Dr. Kazumichi Nakahama for always pushing me a little further to make the best out of my ability to solve all kinds of problems and Mr. Yasushi Osanai who helped me out with a lot of great discussions and the time-keeping of finishing the doctorate program together.
Finally, I would like to give deep thanks to my parents Isao and Sachiko and my lovely sister Akemi who have made patience and continuous encouragement throughout the years of research and gave me this wonderful opportunity to tryout myself.
In addition to these personal acknowledgements, I would also like to recognize the following scholarships and research funding programs for their generous support of my research.
Sasakawa Scientific Research Grant (2003)
Keio COE program (Life Conjugated Chemistry) (2002-2003) Koizumi Shinzou Memorial Scholarship (2002)
Keio University KLL (2000-2001)
Yasunobu Sato
February 2004
Table of Contents
Acknowledgements ... i
Table of Contents ...ii
List of tables... viii
List of figures ... ix
Chapter 1 Introduction ________________________________ 1 1.1 Objective of nucleic acid detection... 1
1.2 Overview of area and problems ... 2
1.3 Biosensors for nucleic acid detection ... 4
1.4 Peptide nucleic acid (PNA) ... 7
1.4.1 Hybridization properties of PNA 7 1.4.2 Structure of PNA/DNA 8 1.5 Polymeric microspheres... 10
1.6 Motivation and organization of thesis ... 11
References... 14
Chapter 2 Nucleic acid hybridization at the surface of a SPR biosensor _____ 18
2.1 Introduction ...18 2.2 Experimental & Methods ... 20
2.2.1 Materials 20
2.2.2 SPR experiments and setup 23
2.2.3 Character of sensor chip surface 24
2.2.4 Immobilization of biotinylated ligands 25 2.2.5 Interaction of PNA/DNA and DNA/DNA 25 2.2.6 Ability to discriminate a point mutation 26 2.2.7 Melting temperature in bulk solution and sensor surface 26
2.2.8 Effect of flow rate 27
2.2.9 Kinetic measurements 28
2.3 Results & Discussions ... 34 2.3.1 Interaction of PNA/DNA and DNA/DNA 34 2.3.2 Difference between ligands ( PNA and DNA ) 34 2.3.3 Effect of the length of the DNA analyte 35 2.3.4 Ability to discriminate a point mutation 37
2.3.5 Effect of parameters on hybridization 43
2.3.5.1 Number of base pairing 43
2.3.5.2 Effect of temperature 43
2.3.5.3 Difference in sensorgrams dependent on temperature 45
2.3.5.4 Effect of flow rate 45
2.3.5.5 Prediction of the environment surrounding the ligand 46
2.3.6 Kinetic analysis of SPR experiments 55 2.3.6.1 Responses dependent on analyte concentration 55 2.3.6.2 Kinetic analysis of PNA/DNA and DNA/DNA 55 2.3.6.3 Comparison of rate constants (k
a, k
d) 56 2.3.6.4 Comparison of binding constants (K
A) 56
2.4 Conclusions ... 64 References... 65
Chapter 3 Polymeric microspheres for
SPR response signal enhancement _____ 68
3.1 Introduction ... 68 3.2 Experimental & Methods... 70
3.2.1 Materials 70
3.2.2 Preparation of polymeric microspheres
and DNA conjugation 73 3.2.2.1 Preparation of AM hydrogel microspheres 73 3.2.2.2 Preparation of SG core-shell microspheres 74 3.2.3 SPR experiments and ligand immobilization 76 3.2.4 Interaction of PNA/DNA and
response signal enhancement by microspheres 76
3.2.5 Effect of salt concentration 77
3.2.6 Effect of temperature 77
3.2.7 Pre-annealing experiments 77
3.2.8 Melting temperatures in bulk solution 78
3.3 Results & discussions ... 82
3.3.1 Preparation of AM microspheres 82
3.3.1.1 AM hydrogel microspheres and DNA conjugation 82 3.3.1.2 Control of the size of AM microspheres 83
3.3.2 Preparation of SG microspheres 86
3.3.3 Interaction of 11PNA-bio/DNA 90
3.3.4 Response enhancement by AM microspheres 92
3.3.4.1 Calibration curves 92
3.3.4.2 Effect of the size of microspheres 98
3.3.4.3 Effect of temperature 100
3.3.4.4 Effect of salt concentration 103
3.3.4.5 Effect of flow rate in SPR experiments 105 3.3.4.6 Pre-annealing of DNA analytes
with AM-DNA microspheres 107 3.3.5 Refractive index of polymeric microspheres 111 3.3.6 Response enhancement by SG microspheres 115
3.3.6.1 Calibration curves 115
3.3.6.2 Effect of temperature and salt concentration 118 3.3.7 Response enhancement by SGNE microspheres 120
3.3.7.1 Calibration curves 120
3.3.7.2 Effect of temperature and salt concentration 123
3.3.7.3 Effect of the length of DNA analyte 123
3.3.8 Overall discussion on usage of polymeric microspheres 127
3.4 Conclusions ... 132 References... 133
Chapter 4 Flow-stress-induced
DNA point mutation detection ________ 137
4.1 Introduction ... 137 4.2 Experimental & Methods... 139
4.2.1 Materials 139
4.2.2 Preparation of flat streptavidin sensor chip 139 4.2.3 SPR experiments and sandwich assay 140
4.3 Results & discussions ... 142 4.3.1 Preparation of flat SA chip and immobilization of ligands 142 4.3.2 Selection of ligands and enhancement by microspheres 143
4.3.2.1 11DNA-bio / 60-mer DNA 143
4.3.2.2 11PNA-bio / 60-mer DNA 144
4.3.3 Effect of flow rate on DNA-carrying microspheres 147 4.3.4 Effect of viscosity and temperature 151
4.4 Conclusions ... 155 References... 156
Chapter 5 Conclusions and Future works _______________ 159
Appendix
A Theory of surface plasmon resonance ... 163
A-1 What are surface plasmons ? 163
A-2 Relation with the resonance angle 164
A-3 Optical setup of SPR sensors 165
B Kinetic interpretation of SPR sensorgrams ... 170 C Experimental protocols and calculations... 177 C-1 Quantitation of ssDNA by Oligreen method 177 C-2 Calculation of lower detection limit from calibration curves 178 C-3 Length of DNA analyte (Worm-like chain model) 179
Bibliography_________________________________________ 180
List of tables Chapter 2
Table 2.1 Codes and sequences of DNA ligands and analytes.
Table 2.2 Code and sequence of PNA ligand.
Table 2.3 Experiment conditions for SPR experiments.
Table 2.4 Experiment conditions for T
mSPR experiments.
Table 2.5 Experiment conditions for flow rate SPR experiments.
Table 2.6 Experiment conditions for kinetic experiments.
Table 2.7 Melting temperatures of PNA/DNA and DNA/DNA.
Table 2.8 Table of kinetic constants and calculated binding constants from SPR sensorgrams.
Chapter 3
Table 3.1 Code and sequence of PNA ligand.
Table 3.2 Codes and sequences of DNA probes and analtyes.
Table 3.3 Recipe of solvent and hydrodynamic diameter of prepared AM microspheres.
Table 3.4 Hydrodynamic diameters of SG derivatized microspheres.
Table 3.5 Comparison of radius between AM-DNA and SG-DNA microspheres.
Table 3.6 Comparison of lower detection limit of DNA-conjugated microspheres calculated from SPR calibration curves.
Chapter 4
Table 4.1 Codes and sequences of PNA and DNA ligand.
List of figures Chapter 1
Figure 1.1 General principles of a biosensor.
Figure 1.2 Chemical structure of DNA and peptide nucleic acid (PNA).
Figure 1.3 Advantage of using sub-micron sized microspheres for detecting DNA point mutations.
Figure 1.4 Overview and schematic representation of elements of this thesis.
Chapter 2
Figure 2.1 Relation between the immobilized ligand (15PNA-Bio and 15DNA-bio) and the analytes (11, 13, 15, 30, 60-mer) differing in length.
Figure 2.2 Representation of the integrated µ-fluidic cartridge (IFC) and the sensorchip.
Figure 2.3 Schematic representation of the surface of a SPR sensorchip and its dimension.
Figure 2.4 Example of a sensorgram showing the responses of immobilization, hybridization (interaction) and regeneration.
Figure 2.5 Representation of CM5 sensorchip and injection of 1M HCl and 1M NaOH.
Figure 2.6 Sensorgram of surface preparation of the SA sensorchip.
Figure 2.7 Sensorgram of ligand immobilization.
Figure 2.8 Relation between the amount of ligand immobilized to a surface and the spacing between the ligands in the dextran layer.
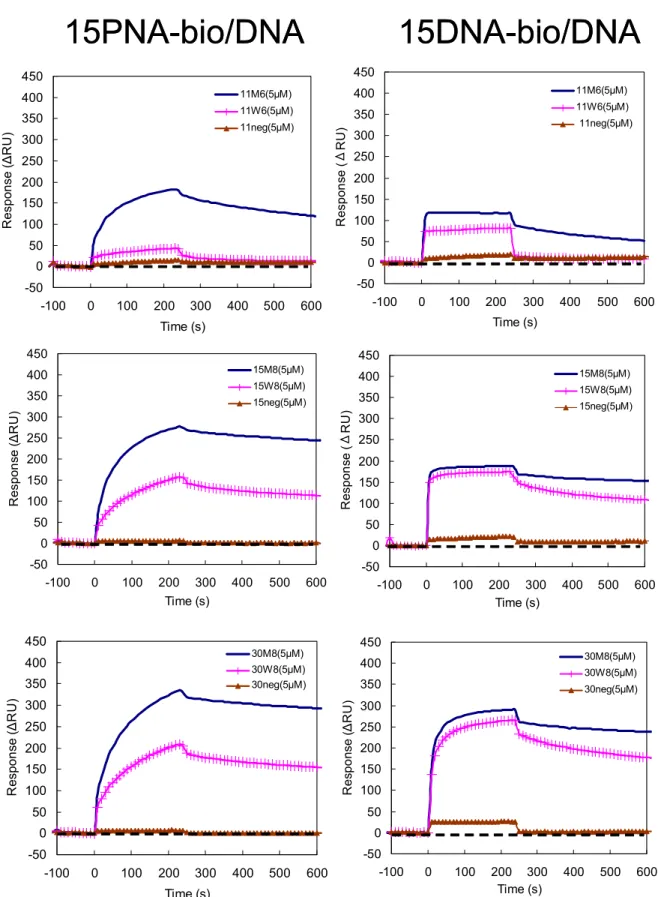
Figure 2.9 Sensorgrams of 5 µM injections of 11, 15, 30-mer DNA analytes to a 15PNA-bio and 15DNA-bio immobilized surface at 40 ℃ .
Figure 2.10 Comparison of sensorgrams of 5 µM injections of 11, 15, 30-mer DNA analytes to a 15PNA-bio immobilized surface at 40 ℃ .
Figure 2.11 Comparison of sensorgrams of 5 µM injections of 11, 15, 30-mer DNA analytes to a 15DNA-bio immobilized surface at 40 ℃ .
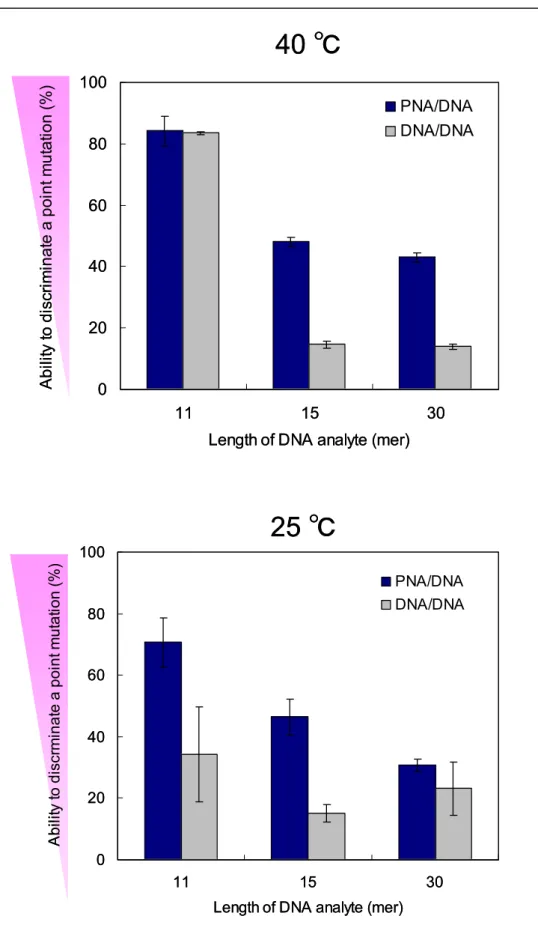
Figure 2.12 Comparison of response at equilibrium (Req) of 5 µM injections of 11, 15, 30-mer DNA analytes to a PNA and DNA immobilized sensor surface at 40 ℃ . Figure 2.13 Ability to discriminate a point mutation of PNA and DNA ligands dependent on
temperature.
Figure 2.14 Amount of DNA analytes (11, 13, 15, 30, 60-mer) at the surface and the ability to discriminate a point mutation of 15PNA-bio.
Figure 2.15 Melting curves of 15PNA-bio / 11-mer DNA and 15DNA-bio / 11-mer DNA.
Figure 2.16 SPR melting curves. Sensorgrams of 11-mer DNA analytes interacting with the
ligands at the surface of a SPR sensor dependent on temperature.
Figure 2.17 Response of 11-mer DNA analyte hybridization after the control run subtraction dependent on the change of temperature from 25 ℃ to 40 ℃ .
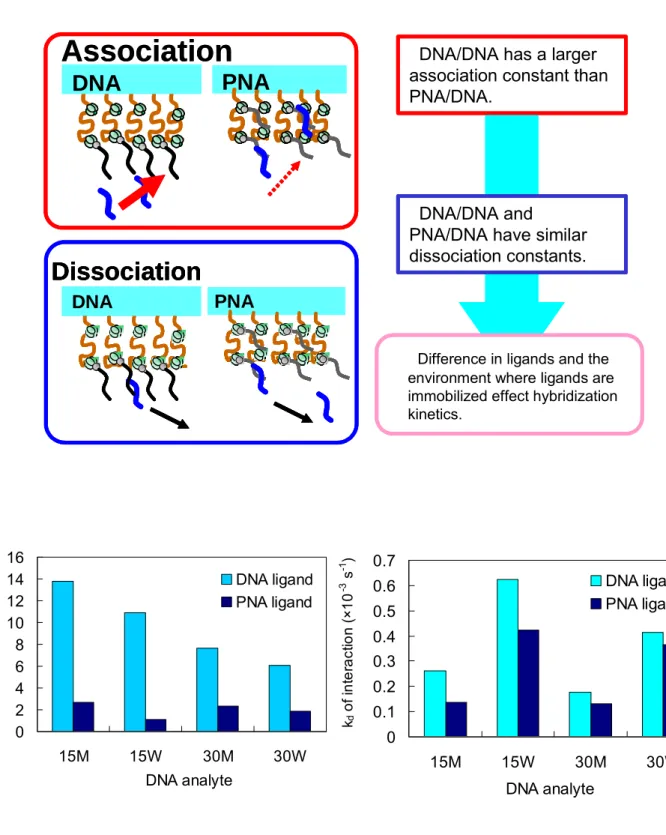
Figure 2.18 Representation of the hybrids of PNA/DNA and DNA/DNA with the relation with melting temperature.
Figure 2.19 Sensorgrams of PNA and DNA ligands interacting with 11-mer DNA analytes at 25 and 40 ℃ .
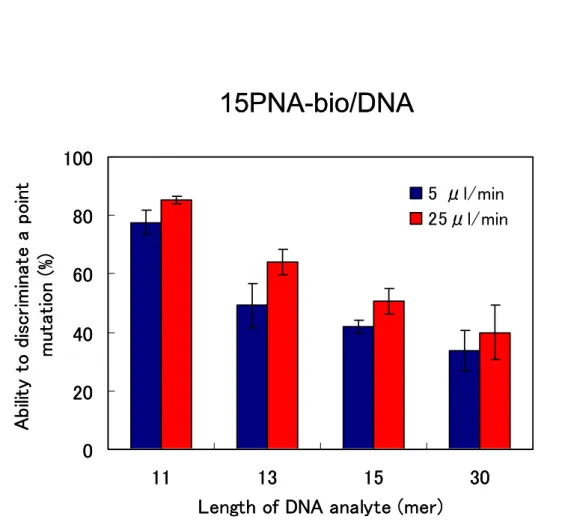
Figure 2.20 Ability to discriminate a point mutation dependent on flow rate (5 and 25 µl/min).
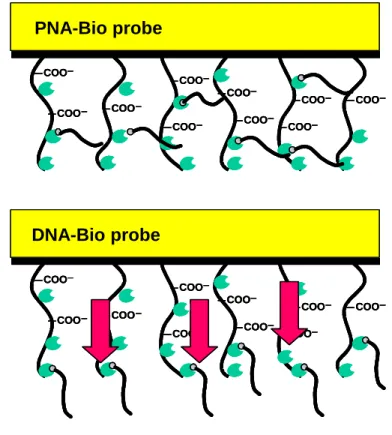
Figure 2.21 Representation of the difference in environment where the ligands are immobilzed.
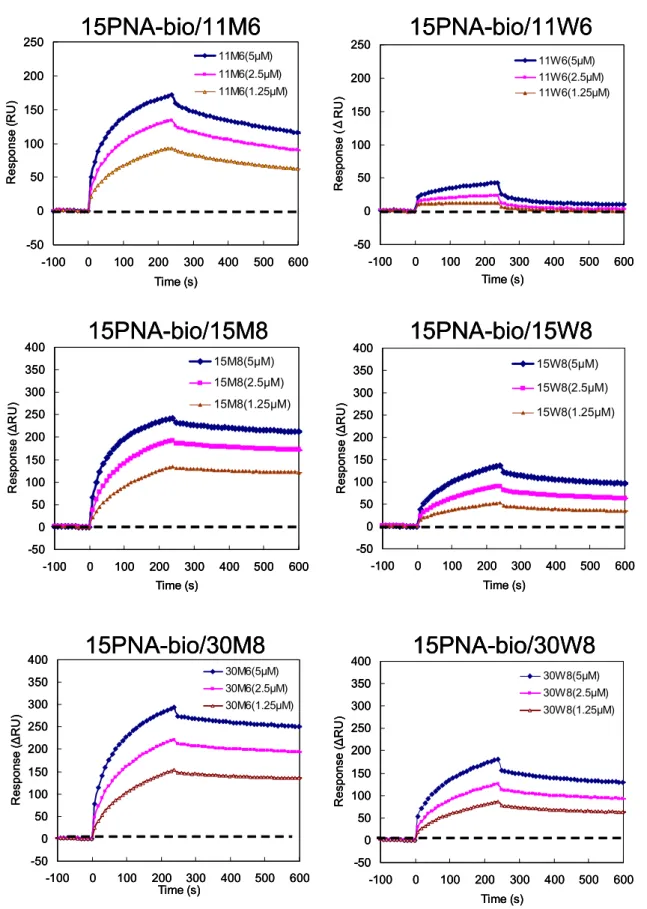
Figure 2.22 Sensorgrams of 11, 15, 30-mer DNA analytes at concentrations of 1.25, 2.5 and 5µM interacting with a PNA ligand immobilized surface at 40 ℃ .
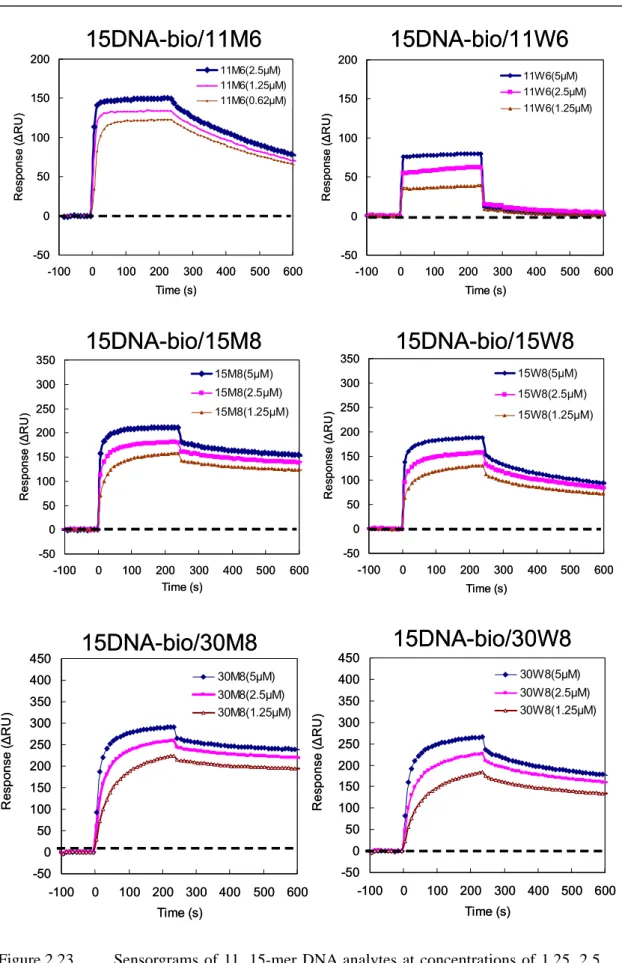
Figure 2.23 Sensorgrams of 11, 15, 30-mer DNA analytes at concentrations of 1.25, 2.5 and 5µM interacting with a DNA ligand immobilized surface at 40 ℃ .
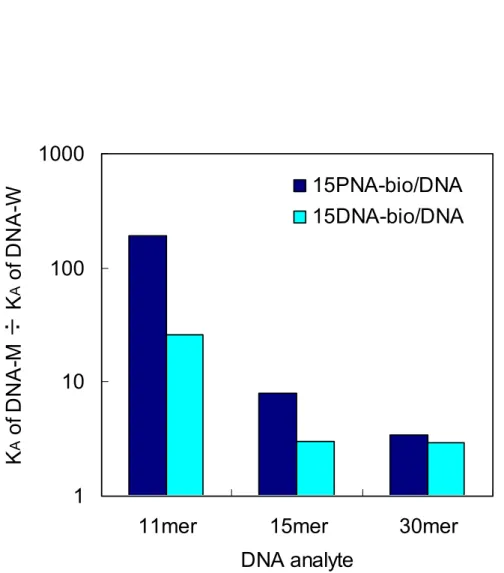
Figure 2.24 Ratio of binding constants between the complementary DNA (M) and the mismatched DNA (W) at 40 ℃ for PNA and DNA ligands.
Figure 2.25 Comparison of kinetic rate constants of DNA and PNA ligands at 40 ℃ .
Chapter 3
Figure 3.1 Schematic representation of polymeric microspheres used in sandwich assays.
Figure 3.2 Preparation of AM hydrogel microspheres and DNA probe immobilization.
Figure 3.3 Preparation of SG based microspheres and DNA probe immobilization.
Figure 3.4 Illustrations of SPR experiments and a schematic representation of response enhancement by DNA-conjugated polymeric microspheres.
Figure 3.5 SEM picture of DNA-conjugated hydrogel microspheres (AM-DNA).
Figure 3.6 Hydrodynamic diameter and poly-dispersity of DNA-conjugated hydrogel microspheres (AM-DNA).
Figure 3.7 Hydrodynamic diameter of hydrogel microspheres (AM) dependent on NaCl concentration.
Figure 3.8 Hydrodynamic diameter of hydrogel microspheres (AM) prepared by the change in solvent parameter.
Figure 3.9 TEM pictures of SG derivatized microspheres.
Figure 3.10 Amount of 15DNA-NH
2immobilized to SG-COOH microspheres dependent on EDC concentration.
Figure 3.11 SEM picture of DNA-conjugated core-shell microspheres (SG-DNA).
Figure 3.12 Response of DNA hybridization of 60M8 and 60W8 dependent on 11PNA-bio, 15PNA-bio and 15DNA-bio ligands.
Figure 3.13 Sensorgrams showing response enhancement by AM-DNA microspheres Figure 3.14 Calibration curve of AM-DNA microspheres at 25 ℃ .
Figure 3.15 Calibration curve of AM-DNA microspheres at 35 ℃ . Figure 3.16 Sensorgrams of AM-DNA microspheres with different sizes.
Figure 3.17 SPR response enhancement by AM-DNA microspheres as a function of temperature.
Figure 3.18 Sensorgrams of AM-DNA microspheres as a function of temperature.
Figure 3.19 SPR response enhancement by AM-DNA microspheres as a function of salt concentration.
Figure 3.20 SPR response enhancement by AM-DNA microspheres as a function of flow rate.
Figure 3.21 SPR response of pre-annealed AM-DNA microspheres with DNA analytes dependent on the concentration of 60-mer DNA analytes.
Figure 3.22 Schematic representation of the difference between normal experiments and pre-annealing experiments.
Figure 3.23 Refractive index of AM and SG-COOH microspheres dispersed in water.
Figure 3.24 Relation of SPR response signals with the number of microspheres at the sensor surface.
Figure 3.25 SEM pictures of SG-COOH and AM microspheres at the sensor surface.
Figure 3.26 SPR response enhancement by SG-15DNA, SG-30DNA microspheres
Figure 3.27 SPR response enhancement dependent on the amount of DNA probes attached to the SG microsphere.
Figure 3.28 Calibration curve of SG-30DNA microspheres at 35 ℃ .
Figure 3.29 SPR response enhancement by SG-30DNA microspheres as a function of temperature.
Figure 3.30 SPR response enhancement by SG-30DNA microspheres as a function of salt concentration.
Figure 3.31 Comparison of sensorgrams of SG-30DNA and SGNE-30DNA.
Figure 3.32 SPR response enhancement dependent on the amount of DNA probes attached to SGNE microspheres.
Figure 3.33 Calibration curve of SGNE-30DNA microspheres at 35 ℃
Figure 3.34 SPR response enhancement by SGNE-30DNA microspheres as a function of temperature.
Figure 3.35 SPR response enhancement by SGNE-30DNA microspheres as a function of
salt concentration.
Figure 3.36 SPR response signals dependent on the length of the DNA analyte and enhancement by SGNE-30DNA microspheres
Figure 3.37 Schematic representation of the surface of the sensor and the microsphere in the exact reduced scale showing an estimate of the number of DNA hybridization points.
Chapter 4
Figure 4.1 Schematic representation of a flat SA chip surface and SPR experiments showing the usage of flow-stress.
Figure 4.2 Sensorgrams of the hybridization of 60-mer DNA analytes with 11DNA-bio interacting with SG-30DNA microspheres and change in flow during the dissociation phase.
Figure 4.3 Sensorgrams of the hybridization of 60-mer DNA analytes with 11PNA-bio interacting with SG-30DNA microspheres and change in flow during the dissociation phase.
Figure 4.4 Magnification and comparison of the event of dissociation between 60M8 and 60W8.
Figure 4.5 Magnification and comparison of the event of dissociation between 60M8 and 60W8. Amount of SA at the sensor surface was 3000 RU.
Figure 4.6 SPR sensorgrams of DNA hybridization and response enhancement by SG-30DNA microspheres dependent on the concentration of glycerol at 25 ℃ . Figure 4.7 SPR response signals of response enhancement by SG-30DNA microspheres
dependent on the concentration of glycerol and the ability to discriminate a
point mutation at 25 and 35 ℃ .
Chapter 1 Introduction
Chapter 1 Introduction
Innovations in biotechnology that combines all sciences from fundamental chemistry to biology, with the aid of nanotechnology are moving nucleic acid technologies from futuristic possibilities into common laboratory and clinical procedures. The advance in biotechnology has opened a lot of interdisciplinary areas which have given breakthroughs that have contributed to the advance in science. The understanding of the characteristic properties of nucleic acid has provided researchers to realize technology to control the gene not just in the area of biology but also for materials. Nucleic acid is a biological polymer and conjugates with artificial polymers are becoming a great field of interest. Although there are a lot of ideas that use bio-affinity as a specific interacting material, such as sensors, the key process to control the function is to understand the phenomenon that takes place at the interface of the material and the biological molecule. The area of controlling the surface that supports the affinity of biological molecules is still a field that needs improvement for sensors. Polymeric substances are powerful materials that could be used to provide the surface for the attachment of biological molecules. In addition polymers have a wide range in variety which will give the researcher numerous choices to support the interaction of biological molecules. The design of materials which controls the character of biological molecules could be accomplished from the point of polymer chemistry and is a highly interdisciplinary field of chemistry which promises plenty of excitement throughout to come.
1.1 Objective of nucleic acid detection
As the Human Genome Project hurtled towards completion of the first finished human sequence, technologies in science have been needed for the study of genome complexity [1].
The next step of the project will place strong emphasis on assigning function to the genes. A
Chapter 1 Introduction
massive amount of information that has just begun to be explored is waiting for its usage for applications for the improvement in the quality of life. To accomplish this task genetic testing for disease susceptibility of individuals, or even entire populations will be needed for understanding the meaning of the genes. Although a lot of improvement has been seen in the area of nucleic acid detection, time consuming procedures need to be simplified for the area for clinical applications and is still a problem to overcome. Early detection of cancers is extremely important from the point of curing diseases. Among the various types of cancers, pancreatic cancer is an aggressive and devastating disease, which is characterized by invasiveness, rapid progression and profound resistance to treatment. Although the cure for pancreatic cancer is still a difficult problem, pathological classification and cancer genetics have improved the descriptive understanding of the disease [2]. K-ras (Kirsten-ras) point mutation in codon 12 is suggested to be significantly associated with the tumorigenesis of pancreatic cancer [3-5].
Therefore in this thesis the objective is to discriminate the G-G mismatch in K-ras codon 12 which is frequently found in DNA samples of pancreatic cancer.
1.2 Overview of area and problems
A lot has been done in the area of nucleic acid amplification and detection [6, 7]. The usage of stains, labels for detecting and measuring nucleic acids have made great improvement during the last decade. Cyanine dyes were developed for sensitive detection of DNAs which react in gels and solution. The continuing quest for improved labels for hybridization assays with micro- and nano-particles (quantum dots [8], gold nano-particles [9-11], polymeric particles [12, 13]) is a promising approach to the improvement in the area. Non-separation assay formats have emerged based on fluorescence energy transfer such as molecular beacons [14].
Micro-analytical devices and micro-arrays [15], combined with biosensor-technology [16, 17]
have made a new category with great impact. There are also new ideas such as nano-mechanical detection of DNA hybridization through the bending of cantilevers of AFM devices [18] which present new challenges and requirements for nucleic acid detection.
The rapid progress in the development of diverse analytical methods for mutation detection,
complex biological problems, molecular diagnosis and assessment of treatment is still growing
Chapter 1 Introduction
methods are provided for practical use. The major problem in DNA detection for practical use is the sensitivity of detecting DNAs in a reproducible manner and the specificity to discriminate a point mutation. The problem related to sensitivity has been improved with the usage of biosensors which are also considered to be applicable to mass parallel detection of DNA targets.
Currently, biosensor development is widespread in many scientific fields. Since the first biosensor developed in 1967 by Updike and Hicks [19], many biosensors have been developed.
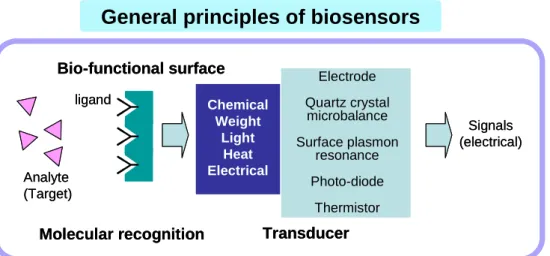
As shown in Figure 1.1 biosensors consist of a molecular recognition element and a transducer.
The development of biosensors can be divided into two major fields; molecular recognition elements and techniques and tools for biosensor construction. For nucleic acid detection the recognition element is usually a single stranded DNA and the sequence can be detected by its ability to pair to a DNA target of complementary sequence through hydrogen bonding between complementary base pairs. In regard to existing biological molecules, such as DNA and proteins, artificial materials have been developed to achieve high specificity. For the recognition of proteins, molecular imprinted polymers are developed to overcome the time-consuming search of specific interacting biological molecules. The shift from using existing biological materials to artificial bio-mimicked substances shows an interesting trend of the science today. Artificial materials that hybridize with DNA have also been developed by scientists and have given researchers a new vision to deal with DNA hybridization. The DNA mimic is called peptide nucleic acid (PNA) which will be reviewed shortly in section 1.4.
General principles of biosensors
Bio-functional surface
Molecular recognition
Signals (electrical) ligand
Analyte (Target)
Chemical Weight
Light Heat Electrical
Transducer
Electrode Quartz crystal microbalance Surface plasmon
resonance Photo-diode
Thermistor
General principles of biosensors
Bio-functional surface
Molecular recognition
Signals (electrical) ligand
Analyte (Target)
Chemical Weight
Light Heat Electrical
Transducer
Electrode Quartz crystal microbalance Surface plasmon
resonance Photo-diode
Thermistor
Figure 1.1 General principles of a biosensor showing the molecular recognition surface and
the transducer.
Chapter 1 Introduction
In this thesis let us first discuss the usage of biosensors which are used in the area of nucleic acid detection and then proceed with the approaches made to increase the specificity to discriminate a DNA point mutation by the usage of PNA which mimics DNA. After that the technique to enhance the sensitivity of a biosensor will be discussed through the usage of a sandwich method which is commonly used in Enzyme-Linked Immunosorbent Assays (ELISA).
Although sandwich assays are commonly known in the area of signal amplification, in this thesis the sandwich tag is somewhat different from normal ELISA methods. DNA-conjugated polymeric microspheres are used as a sandwich tag to enhance the signal of the biosensor which is interesting from the point of observing the interaction between the sensor and the microsphere mediated by a DNA analyte. In other words the problems lying in the area of nucleic acid detection is tackled with the usage of artificial materials which are PNA and polymeric microspheres. This approach will give a new understanding to the interface of the sensing device and will contribute to the area of ultra-sensitive nucleic acid detection with polymeric substances.
1.3 Biosensors for nucleic acid detection
The DNA analytes used for DNA chips and arrays are usually labeled with a fluorescent dye which is a time consuming step for diagnosis systems. The labeling and performing the assay can take 24-48 h to complete and new technologies are currently being developed in the form of biosensors to enable simple and rapid assays. Biosensors are devices in which signal, usually electrical or optical, is generated when one species of the biological molecule binds to another.
The application of optical biosensors for the study of bio-macromolecules is an area of rapidly
growing interest because several attractive features in the measurements can be performed
under ambient conditions. Biosensors offer the potential of measuring DNA hybridization
without the use of labels (Non-destructive analysis), within minutes of simply adding the DNA
sample of interest. The area of detecting a mismatch in a DNA target with biosensors is still
growing because of the needs in laboratory-based-research where high-throughput analysis is
recommended for drug screening to clinical diagnostic systems with high sensitivity in a small
sized device. Among the massive sensors in the field, non-labeled DNA hybridization is
Chapter 1 Introduction
resonance (SPR) sensors [21, 22] and electrochemical devices using the concept of potentiometry [23] which all have high sensitivity.
One of the most promising technologies for the direct detection of the binding of biological molecules exploits the phenomenon of SPR which rely on the measurement of binding-induced refractive index changes. The optical phenomenon SPR was first described by Wood in 1902 [24], but the advance in the usage of SPR in the area took a while. The detailed theory of SPR will be presented in Appendix A so here the historical background of SPR sensors will be first described.
The potential of SPR for characterization of thin films and monitoring processes at metal interfaces was recognized in the late seventies. In 1982 the use of SPR for gas detection and biosensing was demonstrated by Nylander and Liedberg [25, 26]. Since then SPR sensing has been receiving attention in practical applications and academic interests. Although physical measurements are possible with SPR, a great deal of work has been done in the area of optical biosensing. More than 75% [27] of the research papers deal with applications of SPR to biomolecular interaction examination and recently it has become one of the most popular approaches to analyze the dynamics of protein interactions. In 1994 the first survey on real-time biospecific interaction analysis methods appeared [28] which have since been frequently used and improved for analysis of kinetic and thermodynamic parameters of biomolecular interactions. Several assay formats for SPR sensors have been tested and direct detection of molecules has been carried out, however, the change in the refractive index produced by the interaction of small molecules may not be sufficient to be detected directly. Earlier works were mainly focused on antigen-antibody interactions to test newly developed SPR setups and to improve the surface chemistry. Current research includes more advanced systems such as protein-DNA interactions [29] and even detecting conformational changes in immobilized proteins [30].
SPR sensor technology holds potential for application in areas including medicine,
environmental monitoring, food monitoring, however, the major competitors of biosensors are
immunoassays which are commonly and widely used. In order to reach out from laboratories to
the biochemical monitoring market, SPR sensors have to compete with existing technologies on
Chapter 1 Introduction
The features of SPR biosensors [31] are:
a. Versatility: SPR sensor platforms can be constructed for detection of any analyte, providing a biomolecular recognition element recognizing the analyte available; analyte does not have to exhibit any special properties such as fluorescence or characteristic absorption.
b. No labels required: binding between the biomolecular recognition element and analyte can be observed directly without the use of radioactive or fluorescent labels because SPR is based on detecting the difference in dielectric constant at the sensor surface.
c. Speed analysis: the binding event can be observed in real-time providing potentially rapid response.
However SPR biosensors exhibit two limitations:
a. Specificity of detection: specificity is solely based on the ability of biomolecular recognition elements to recognize and capture analyte. Biomolecular recognition elements may exhibit some type of non-specific affinity to non-target molecules. If the non-target molecules are present in a sample at a high concentration, sensor response due to the non-target analyte molecules will disturb the signal which one would like to analyze.
b. Sensitivity to interfering effects: similar to other affinity biosensors relying on measurement of dielectric constant changes, SPR biosensor measurements can be compromised by interfering effects which produce refractive index variations. These include non-specific interaction at sensor surfaces. In addition extremely small substances might need a large amount of ligand to capture a lot of targets to increase the response.
The advantages of SPR biosensors has given great recognition in the area of analytical sceince.
And the usage of SPR biosensors is one of the promising approaches to detect substances that
are low in concentration. However when nucleic acid detection is an objective the detection of
clinical samples at low concentrations is a problem, therefore the methods to enhance sensitivity
of these sensors are needed. It is therefore important to understand the mechanism of
hybridization at solid surfaces [32-34] so that an efficient way in enhancing the response of the
system can be proposed.
Chapter 1 Introduction
1.4 Peptide nucleic acid (PNA)
The most important molecular recognition event in nature is perhaps the base-pairing of nucleic acids, which guarantees the storage, transfer, and expression of genetic information in living systems. The highly specific recognition through the interaction with nucleobases has become increasingly important for the applications in the area where DNAs are used [35]. DNA is a polymer that contains a sugar-phosphate backbone but a radical change to the natural structure was made by the Danish group of Buchardt, Nielsen, Egholm, and Berg who have replaced the entire backbone of DNA with a synthetic pseudopeptide backbone composed of N-(2-aminoethyl)-glycine units as shown in Figure 1.2. The astonishing result of this peptide nucleic acid (PNA) that binds with higher affinity to complementary nucleic acids than their natural counterparts, with sequence-specific recognition of DNA and RNA resulted in the rapid establishment of a new area in research such as diagnostic applications [36-38].
The general characters of PNA are
a: High ability to bind to bases and high ability to discriminate mismatches.
b: High melting temperature compared to that of DNA duplexes.
c: No influence from ionic strength.
d: Chemical stability and biological stability (towards proteases and peptidases).
One problem with PNA will be the solubility. PNAs are neutral compounds with a tendency for self-aggregation and have limited water solubility. However there are reports that show improvement in solubility with the introduction of charged groups [35, 39].
1.4.1. Hybridization properties of PNA
Sequence specific hybridization of PNA to single-stranded DNA or RNA appears to follow the
Watson-Crick-Hoogsteen base-pairing rules found for natural nucleic acids. However, both
antiparallel (PNA amino terminal facing the 3’ end of the oligonucleotide) and parallel
PNA-nucleic acid duplexes are stable, although the antiparallel duplex is the more stable by
1-1.5 ℃ per base pair. As from Figure 1.2 PNA is electrostatically neutral, and thus the
stability of PNA-nucleic acid complexes is not significantly influenced by counter ions [40]. In
general, it has been found that PNA/DNA duplexes are approximately 1 ℃ per base pair more
Chapter 1 Introduction
stable than the corresponding DNA/DNA complexes at 140 mM Na
+, whereas equal thermal stability is observed at 1 M Na
+. As expected the stability of PNA/DNA hybrids is ascribed to the lack of electrostatic repulsion between the two strands. Thermal stability studies have also indicated that the sequence discrimination of PNA hybridization is at least as good as that of DNA because Δ Tm upon introduction of mismatches in PNA/DNA are greater than observed DNA-DNA duplexes [40, 41]. A systematic examination of the effect of base pair mismatches in the middle of a pentadecamer PNA-DNA duplex revealed decreases in Tm of 8-20 ℃ for single mismatches which in some cases double that observed for DNA-DNA duplexes. The reason for the high melting temperature is explained by the lack of electrostatic repulsion with the restriction of rotation of amide bonds in the molecule [42, 43]. There are also other interesting properties of PNA where they form a triple helix, efficient strand displacement and usage as an antisense molecule [35]. However the main character used in this thesis is PNAs property having a better ability to discriminate a point mutation for the application in DNA diagnosis.
1.4.2 Structure of PNA/DNA
Structure determinations of an octameric antiparallel PNA/DNA duplex by NMR spectroscopic studies showed that the duplex contained elements of both A-form (lateral positioning of the base pairs) and B-form DNA (backbone curvature, base pair inclination, helical rise)[44]. The right handed helix contains approximately 13 base-pairs per helical turn compared to 10 base pairs for B-form DNA. The major groove is widened, and the minor groove is correspondingly shallow and narrow. The CD spectra of anti-parallel PNA/DNA duplexes are similar to DNA/DNA spectra and indicate the formation of a right-handed helix [45]. The interesting thing about the structure is that the amide bonds restrict the rotations of the molecule that they need to rotate for the formation of a PNA/DNA complex. Although the final complex forming base pairs with DNA is one of the favorable conformations for PNA, the rate of forming the complex is somewhat slow which is thought to be because of the rigidity of the backbone which is composed of amide bonds.
Overall PNA could be a promising ligand for the analysis to discriminate a point mutation in a
DNA analyte. While immobilized single-stranded DNA has been quite extensively used as
Chapter 1 Introduction
detection of PNA at solid surfaces still needs further research. Wang et al. have used the combination of QCM techniques with thiol derivatized 15-mer PNA and successfully discriminated a point mutation in a DNA [46]. Jensen et al. have performed SPR studies of the effects of mismatches on the kinetics of the association and dissociation reactions of PNA/DNA hybridization [47]. In Chapter 2, I will begin with the study of using PNA as a ligand which detects a G-G mismatch in a K-ras gene at the surface of a SPR biosensor and evaluate the difference with DNA ligands.
Deoxyribonucleic acid DNA
Peptide nucleic acid PNA
O HO
O P -O
O O
O
O P -O
O O
O
O P -O
O OR Base
Base
Base +H
3N
N O
HN O Base
N O
HN O Base
N O
NH
2O Base O
HO
O P -O
O O
O
O P -O
O O
O
O P -O
O OR Base
Base
Base +H
3N
N O
HN O Base
N O
HN O Base
N O
NH
2O Base
Figure 1.2 Chemical structure of deoxyribonucleic acid (DNA) (left) and peptide nucleic
acid (PNA) (right).
Chapter 1 Introduction
1.5 Polymeric microspheres
Polymeric microspheres can be prepared by heterogeneous polymerization, e.g. emulsion polymerization and dispersion polymerization. The features of microspheres such as large specific surface area, high mobility, uniformity, stability and easy recovery from dispersions, etc.
are utilized for the exhibition of functions. One of the most promising applications of functional polymer microspheres is used in the field of biomedical diagnosis and bioseparation. These applications are reviewed by Kawaguchi [48] and shows that a wide variety of microspheres could be prepared for specific use in the area of biotechnology.
In this thesis, polymeric microspheres are used as materials to enhance the sensitivity of the SPR biosensor. Although there are other types of particles that could enhance sensitivity of the sensor, such as inorganic particles, the interest here is the easiness of controlling the surface characters of polymeric microspheres. The softness is an interesting parameter when biological interaction is discussed. A comparison is made between hydrogels and core-shell microspheres to discuss the flexibility of the DNA probes attached to the surface of the microspheres. In this way the surface character which is unique in polymeric materials could give a new aspect to the microspheres and a chance to play an active role in the area of biosensing.
In addition the sizes of the microspheres that are prepared in this thesis are in the sub-micron order which gives a character to the microspheres to interact with the sensor surface by multiple bonding as shown in Figure 1.3. This multiple bonding interaction could be only seen between the sensor surface and the microsphere when the microsphere is large. If gold nano-particles which are very small are used for the interaction with the sensor surface, the particles will only show a single point interaction. Therefore the force that is applied to the microsphere will be a difficult parameter to control the stability of hybridization. However when multiple interaction is made, there will be a possibility of discriminating the difference of DNA hybridization at the surface by rupture force that acts to the microsphere as shown in Figure 1.3. The idea of flow-stress induced point mutation discrimination could be supported if a sub-micron sized microsphere is used and this is one of the novel aspects that will be presented in the thesis through SPR based sandwiched assays.
Chapter 1 Introduction
0 20 40 60 80 100
0 5 10 15 20 25
Force applied to detach DNA-conjugated microspheres (F) Percentage of microspheres at the surface from the initial state(%)
60W8 60M8 60W8 multiple 60M8 multiple
F=16 F=6
F=3 F=4
Single
Multiple
F=Rupture forces between sensor-microsphere interaction
0 20 40 60 80 100
0 5 10 15 20 25
Force applied to detach DNA-conjugated microspheres (F) Percentage of microspheres at the surface from the initial state(%)
60W8 60M8 60W8 multiple 60M8 multiple
F=16 F=6
F=16 F=6
F=3
F=4 F=3
F=4 Single
Multiple
F=Rupture forces between sensor-microsphere interaction
Figure 1.3 Schematic representation of a sandwich method used in SPR assays with nano-particles and sub-micron sized microspheres. The right figure shows a prediction of the relation of the percentage of microspheres at the sensor surface with the change of force applied to the nano-particles and microspheres.
1.6 Motivation and organization of thesis
Having reviewed the development and progress in DNA detection, the need of fast diagnosis in the area of cancer detection could be easily understood. The motivation of this thesis is to discriminate a G-G mismatch in a K-ras gene by solving the two major problems of the SPR biosensor which are specificity and sensitivity and a schematic overview is shown in Figure 1.4.
The increase in specificity of the SPR sensor for point mutation detection will be accomplished by employing PNA as a ligand. The increase in sensitivity of DNA analytes will be solved by using sandwiched methods with DNA-conjugated polymeric microspheres. The combination of this approach is a novel method to prior reports [46, 47] and could be used to all biosensors based on the evanescent field.
Chapter 2 will be devoted to the analysis of PNA ligand discriminating a G-G mismatch at the
SPR sensor surface. The length of DNA analytes and other factors such as temperature, flow
rate are discussed. Kinetic analysis of the hybridization of PNA with DNA is examined to
understand the reaction in detail. In addition revealing the hybridization process at solid
surfaces is important in the area of biosensing since the effect of the surface is usually a factor
Chapter 1 Introduction
Chapter 3 will discuss the matter of sensitivity with SPR biosensors and here the usage of polymeric microspheres as response enhancers is described. Polymeric microspheres with different characters are easily prepared compared to that of inorganic materials. In this chapter a hydrogel microsphere is used as a soft material and is compared with a core-shell microsphere which has a harder surface. Polymeric microspheres are useful from the point of the easiness of surface modification and the immobilization of biomolecules. The difference in materials gave a difference to the enhancement in SPR responses. This is mainly attributed to the flexibility of the surfaces with different materials used. In addition factors that influence the hybridization of DNA-conjugated microspheres are also discussed.
Chapter 4 will be devoted to a novel proposal for the detection of point mutations at the surface of SPR sensors using polymeric microspheres in a sandwich method. The size of the sandwich tag which is employed in the experiments is different from usual sandwiched materials such as antibodies and proteins. The sub-micron sized microsphere that we have prepared has an interesting character at the surface of solids under flow. Flow-stress-induced discrimination of a DNA point mutation is presented as a new method to increase the specificity of ligands. This is a new method which will provide a new character of sub-micron sized microspheres in a flow system.
Overall, the combination of employing PNA as a ligand to increase specificity and
DNA-conjugated microspheres to enhance sensitivity demonstrates a successful sandwiched
assay for the detection of a DNA point mutation which is a promising method for fast detection
of cancers.
Chapter 1 Introduction
Flow-stress
Hydrogel Core-shell Surface Plasmon Resonance Biosensor
PNA, DNA ligand
DNA analyte interaction
Polymeric microsphere interaction
Flow-stress
Hydrogel Core-shell Surface Plasmon Resonance Biosensor
PNA, DNA ligand
DNA analyte interaction
Polymeric microsphere interaction
Figure 1.4 Overview and schematic representation of elements of the thesis showing DNA
detection by surface plasmon resonance, DNA analyte interaction, polymeric
microsphere response signal enhancement and flow-stress-induced point mutation
discrimination.
Chapter 1 Introduction
References
[1] Waterston, R., Sulston, J. E. (1998) Genomics - The human genome project: Reaching the finish line. Science 282, 53.
[2] Bardeesy, N. and DePinho, R. A. (2002) Pancreatic cancer biology and genetics. Nature reviews Cancer 2, 987.
[3] Song, M-M., Nio. Y., Dong, M., Tamura, K., Furuse, K., Tian Y-L., He S-G. and Shen, K.
(2000) Comparison of K-ras point mutations at codon 12 and p21 expression in pancreatic cancer between Japanese and Chinese patients. J. of Surg. Oncol. 75, 176.
[4] Minamoto, T., Mai, M. and Ronai, Z. (2000) K-ras mutation: Early detection in molecular diagnosis and risk assessment of colorectal, pancreas, and lung cancers- A review. Cancer Detection and Prevention 24, 1.
[5] Minamoto, T., Esumi, H., Ochiai, A., Belitsky, G., Mai, M., Sugimura, T. and Ronai, Z.
(1997) Combined analysis of microsatellite instability and K-ras mutation increases detection incidence of normal samples from colorectal cancer patients. Clin. Cancer Res. 3, 1413.
[6] Schweitzer, B. and Kingsmore, S. (2001) Combining nucleic acid amplification and detection. Curr. Opin. biotechnol. 12, 21.
[7] Kricka, L. J. Stains, labels and detection strategies for nucleic acids assays. (2002) Ann.
Clin. biochem. 39, 114.
[8] Han, M., Gao, X., Su, J. Z. and Nie, S. (2001) Quantum-dot-tagged microbeads for multiplexed optical coding of biomolecules. Nat. Biotechnol. 19, 631.
[9] Jin, R., Wu, G., Li, Z., Mirkin, C. A. and Schatz, G. C. (2003) What controls the melting properties of DNA-linked gold nanoparticle assemblies? J. Am. Chem. Soc. 125, 1643.
[10] Taton, T. A., Mirkin, C. A. and Letsinger, R. L. (2000) Scanometirc DNA array detection with nanoparticle probes. Science 289, 1757.
[11] Sato, K., Hosokawa, K. and Maeda, M. (2003) Rapid aggregation of gold nanoparticles induced by non-cross-linking DNA hybridization. J. Am. Chem. Soc. 125, 8102.
[12] Hatakeyama, M., Hanashita, H., Nakamura, K., Fujimoto, K., and Kawaguchi, H. (1998)
DNA-carrying latex particles for DNA diagnosis 2. Distinction of normal and point mutant
Chapter 1 Introduction
DNA using S1 nuclease. Colloids Surf., B 10, 171.
[13] Mori, T. and Maeda, M. (2001) Formation of DNA-carrying colloidal particle from poly(N-isopropylacrylamide)-graft-DNA copolymer and its assembly through hybridization. Polymer J. 10, 830.
[14] Dubertret, B., Calame, M. and Libchaber, A. J. (2001) Single-mismatch detection using gold-quenched fluorescent oligonucleotides. Nature Biotechnol. 19, 365.
[15] Lander, E. S. (1999) Array of hope. Nature genetics supplement 21, 3.
[16] Nakamura, H. and Karube, I. (2003) Current research activity in biosensors. Anal.
Bioanal Chem. 377, 446.
[17] Liedberg, B., Nylander, C. and Lundström, I. (1995) Biosensing with surface plasmon resonance-how it all started. Biosens. Bioelectron. 10, i.
[18] Fritz, J., Baller, M. K., Lang, H. P., Rothuizen, H., Vettiger, P., Meyer, E., Güntherodt, H.-J., Gerber, Ch. and Gimzewski, J. K. (2000) Translating biomolecular recognition into nanomechanics. Science 288, 316.
[19] Updike, S. J. and Hicks, G. P. (1967) The enzyme electrode. Nature 214, 986.
[20] Okahata, Y., Kawase, M., Niikura, K., Ohtake, F., Furusawa, H. and Ebara, Y. (1998) Kinetic measurements of DNA hybridization on an oligonucleotides-immobilized 27-MHz quartz crystal microbalance. Anal.Chem. 70, 1288.
[21] Schwarz, T., Yeung, D., Hawkins, E. and Heaney, P. (1991) Detection of nucleic acid hybridization using surface plasmon resonance. Trends Biotechnol. 9, 339.
[22] Piscevic, D., Lawall, R., Veith, M., Liley, M., Okahata, Y. and Knoll, W. (1995) Oligonucleotide hybridization observed by surface plasmon optical techniques. Applied Surface Sci. 90, 425.
[23] Kharitonov, A. B., Alfonta, L., Katz, E. and Willner, I. (2000) Probing of bioaffinity interactions at interfaces using impedance spectroscopy and chronopotentiometry. J.
Electroanal. Chem. 487, 133.
[24] Wood, R. W. (1902) On a remarkable case of uneven distribution of light in a diffraction grating spectrum. Phil. Magm. 4, 396.
[25] Nylander, C., Liedberg, B., Lind, T. (1982) Gas detection by means of surface plasmons
Chapter 1 Introduction
[26] Liedberg, B., Nylander, C., Lundström, I. (1983) Surface plasmons resonance for gas detection and biosensing. Sens. Actuators 4, 299.
[27] Homala, J., Yee, S. S. and Gauglitz, G. (1999) Surface plasmon resonance sensors: review.
Sens. Actuators, B 54, 3.
[28] Lundström, I. (1994) Real-time biospecific interaction analysis. Biosens. Bioelectron. 9, 725.
[29] Mernagh, D. R., Janscak, P., Firman, K. and Kneale, G. G. (1998) Protein-protein and protein-DNA interactions in the Type I restriction endonuclease R.EcoR124I. Biol. Chem.
379, 497.
[30] Sota, H., Hasegawa, Y. and Iwakura, M. (1998) Detection of conformational changes in an immobilized protein using surface plasmon resonance. Anal. Chem. 70, 2019.
[31] Homala, J. (2003) Present and future of surface plasmon resonance biosensors. Anal.
Bioanal. Chem. 377, 528.
[32] Pappaert, K., Hummelen, P. V., Vanderhoeven, J., Baron, G. V. and Desmet, G. (2003) Diffusion-reaction modeling of DNA hybridization kinetics on biochips. Chem.Eng. Sci. 58, 4921.
[33] Schuck, P. (1996) Kinetics of ligand binding to receptor immobilized in a polymer matrix, as detected with an evancescent wave biosensor. I. A computer simulation of the influence of mass transport. Biophys. J. 70, 1230.
[34] Southern, E., Mir, K. and Shchepinov, M. (1999) Molecular interactions on microarrays.
Nature Genet. supplement 21, 5.
[35] Uhlmann, E., Peyman, A., Breipohl, G. and Will, D. W. (1998) PNA: Synthetic polyamide nucleic acids with unusual binding properties. Angew. Chem. Int. Ed. 37, 2796.
[36] Nielsen, P. E., Egholm, M., Berg, R. H. and Buchardt, O. (1991) Sequence-selective recognition of DNA by strand displacement with a thymine-substituted polyamide. Science 254, 1497.
[37] Hyrup, B. and Nielsen, P. E. (1996) Peptide nucleic acids (PNA): synthesis, properties and potential applications. Bioorg. Med. Chem. 4, 5.
[38] Nielsen, P. E. (1999) Peptide nucleic acid. A molecule with two identities. Acc. Chem. Res.
Chapter 1 Introduction
[39] Egholm, M., Buchardt, O., Nielsen, P. E., Berg, R. H. (1992) Peptide nucleic-acids (PNA) – oligonucleotide analogs with an achiral peptide backbone. J. Am. Chem. Soc. 114, 1895.
[40] Egholm, M., Buchardt, O., Christensen, L., Behrens, C., Freier, S. M., Driver, D. A., Berg, R. H., Kim, S. K., Nórden, B. and Nielsen, P. E. (1993) PNA hybridizes to complementary oligonucleotides obeying the Watson-Crick hydrogen bonding rules. Nature 365, 556.
[41] Jensen, K. K., Ørum, H., Nielsen, P. E., Nórden, B. (1997) Hybridization kinetics of peptide nucleic acids with DNA and RNA studied with BIAcore technique. Biochemistry 36, 5072.
[42] Eriksson, M. and Nielsen, P. E. (1996) PNA nucleic acid complexes. Structure, stability and dynamics. Q. Rev. Biophys. 29, 369.
[43] Sen, S., and Nilsson, L. (1998) Molecular Dynamics of Duplex Systems Involing PNA Structural and Dynamical Consequences of the Nucleic Acid Backbone. J. Am. Chem. Soc.
20, 619.
[44] Eriksson, M. and Nielsen, P. E. (1996) Solution structure of a peptide nucleic acid-DNA duplex. Nat. Struct. Biol. 3, 410.
[45] Witttung, P., Eriksson, M., Lyng, R. and Nielsen, P. E. (1995) Induced chirality in PNA-PNA duplexes. J. Am. Chem. Soc. 117, 10167.
[46] Wang, J., Palecek, E., Nielsen, P. E., Rivas, G., Cai, X., Shiraishi. H., Dontha, N., Luo, D.
and Farias, P. A. M. (1996) Peptide nucleic acid probes for sequence-specific DNA biosensors. J. Am. Chem. Soc. 118, 7667.
[47] Jensen, K. K., Orum, H., Nielsen, P. E., and Norden, B. (1997) Kinetics for Hybridization of Peptide Nucleic Acids (PNA) with DNA and RNA Studied with the BIAcore Technique.
Biochemistry 36, 5072.
[48] Kawaguchi, H. (2000) Functional polymer microspheres. Prog. Polym. Sci. 25, 1171.
Chapter 2 Nucleic acid hybridization at the sensor surface
Chapter 2 Nucleic acid hybridization at the surface of a SPR biosensor
2.1 Introduction
There has been great interest in the behavior of DNA ligands immobilized on solid supports such as high-throughput analyzing DNA arrays [1-3] and colloidal substances such as gold nanoparticles [4, 5] and latex microspheres [6-8]. The advantage of the usage of surfaces compared to that of solution is the easiness to evaluate reactions in parallel assays and the reusability of the surface by washing it with regenerating solutions for repetitive experiments. In these systems the solid-solution interface acts as a place for interaction between ligands and analytes. Attachment of one of the ligands to a solid phase introduces problems which are not encountered when the interactions take place in a homogeneous solution as it constrains the ways in which the ligands can interact with each other. An important factor that should be considered in developing the surface of these systems is that in most cases the solid phase affects the character of the ligand by the reduction of the reaction rate, addition of steric factors and change in electrostatic interactions [9, 10]. The detection of a DNA point mutation at a solid support is of interest with the relation to the surface character which is not fully known and is essential for the understanding of the mechanism with relation to the ability to discriminate a point mutation.
In this chapter I will discuss about the effect of the potential of the ligand to discriminate a
point mutation in an analyte and the effect of the environment that surrounds the ligand where
recognition takes place. First, the difference between DNA and peptide nucleic acid (PNA)
ligands is examined. A comparison between a 15-mer PNA and DNA ligand is made for
detecting a G-G mismatch in K-ras codon 12 which is frequently found in primary pancreatic,
colorectal and lung carcinomas. The extents of hybridization using DNA analytes of different
Chapter 2 Nucleic acid hybridization at the sensor surface
length are studied and the ability to discriminate a point mutation is evaluated to find out the best length for point mutation detection. In addition the importance of the experiment temperature which is related with the melting temperature of the duplex is also discussed.
Normally in experiments of DNA hybridization, the final equilibrium is mainly the interest of
the interaction. However the dynamic process of the interaction has earned great interest which
is important to understand the mechanism of the process of recognition behaviors. To
understand the process in detail, kinetic analysis was also performed and association rate
constants (k
a), dissociation rate constants (k
d) and affinity constants (K
A) were calculated. These
results indicate the importance of the effect from the analyte lengths; temperature and the
environment surrounding the ligand for achieving an all or none single base mismatched
detection system.
Chapter 2 Nucleic acid hybridization at the sensor surface
2.2 Experimental & methods 2.2.1 Materials
PNA and DNA sequences used in this chapter are listed in Table 2.1 and their relation with each other in Figure 2.1. The HPLC purified PNA ligand with a hydrophilic spacer in this study was obtained from Nippon Flour Mills (Japan) and used as received. All DNA ligand and DNA analytes were synthesized and column purified by JBios(Japan). The prefix number of DNA analytes indicates the length of the analyte and the suffix the place of the mismatch from the 3’-end. M is complementary and W has a one base mismatch to the ligand. Neg was synthesized not to match the probe (G to T and A to C) and used as a negative control which will not hybridize to the ligands prepared. Na
2HPO
4, NaH
2PO
4, NaCl for the preparation of PBS buffer and NaOH for regeneration were from WAKO Pure Chemical Industries Ltd. (Japan) and used as received.
Table 2.1 Codes and sequences of DNA ligand and analytes
Code of DNA DNA sequence
Ligand 15DNA-Bio 5’-Bio-o-o-ACG-CCA-CgA-GCT-CCA-3’
Analyte
11M6 5’-GAG CTc GTG GC-3’
11W6 5’-GAG CTg GTG GC-3’
11neg 5’-TCT AGA TGT TG-3’
13M7 5’-GGA GCT cGT GGC G-3’
13W7 5’-GGA GCT gGT GGC G-3’
13neg 5’-TTC TAG ATG TTG T-3’
15M8 5’-TGG AGC TcG TGG CGT-3’
15W8 5’-TGG AGC TgG TGG CGT-3’
Chapter 2 Nucleic acid hybridization at the sensor surface
15neg 5’-GTT CTA GAT GTT GTG-3’
30M8 5’-TAA ACT TGT GGT AGT TGG AGC TcG TGG CGT-3’
30W8 5’-TAA ACT TGT GGT AGT TGG AGC TgG TGG CGT-3’
30neg 5’-TAA ACT TGT GGT AGT GTT CTA GAT GTT GTG-3’
60M8 5’-GGA GAG AGG CCT GCT GAA AAT GAC TGA ATA TAA ACT TGT GGT AGT TGG AGC TcG TGG CGT-3’
60W8 5’-GGA GAG AGG CCT GCT GAA AAT GAC TGA ATA TAA ACT TGT GGT AGT TGG AGC TgG TGG CGT-3’
60neg 5’-GGA GAG AGG CCT GCT GAA AAT GAC TGA ATA TAA ACT TGT GGT AGT GTT CTA GAT GTT GTG-3’
Hydrophilic linker o ( BiotinTEG Phosphoramidite )
O O
O O O
HN NH
S
O HN
ODMT O P
O
N(i PR)2 CNEt