Atsushi Sato
REGULATION OF LIPID ACCUMULATION
IN GREEN ALGAE
- 1 -
Contents
GENERAL INTRODUCTION 3
CHAPTER 1 TAG accumulation in green algae 11
1-1. Introduction 12
1-2. Materials and methods 13
1-3. Results 15
1-4. Discussion 45
CHAPTER 2 Analysis of TAG synthetic pathway in C. reinhardtii 55
2-1. Introduction 56
2-2. Materials and methods 57
2-3. Results 59
2-4. Discussion 68
CHAPTER 3 TAG accumulating mechanisms and participation of SAC genes 70
3-1. Introduction 71
3-2. Materials and methods 72
3-3. Results 73
3-4. Discussion 88
References 92
- 2 -
Abbreviations
APM amiprophos-methyl ARS arylsulfurtase CAP chloramphenicol CHI cycloheximide Chl chlorophyllC. kessleri Chlorella kessleri
C. reinhardtii Chlamydomonas reinhardtii
CT control
DAG diacylglycerol
DCMU 3-(3,4-dichlorophenyl)-1,1-dimethylurea
DCW dry cell weight
DGAT diacylglycerol acyltransferase
DGDG digalactosyl diacylglycerol
DGTS diacylglyceryl-N,N,N-trimethylhomoserine
DGTT diacylglycerol acyltransferase type two
DHAP dihydroxyacetone phosphate
FAME fatty acid methyl ester
FFA free fatty acid
GPAT glycerol-3-phosphate acyltransferase
GPDH glycerol phosphate dehydrogenase
LPA lyso-phosphatidic acid
LPAAT lyso-phosphatidic acid acyltransferase
MAG monoacylglycerol MGDG monogalactosyl diacylglycerol LDs lipid droplet NLs neutral lipids PA phosphatidic acid PG phosphatidylglycerol PLs polar lipids
RAD regular air drying
SAC sulfur acclimation
SE standard error
SNRK SNF1-related protein kinase
TLs total lipids
- 3 -
General introduction
Lipids, which are hydrophobic components in organisms, are divided into polar lipids (PLs)
and neutral lipids (NLs) by the chemical characteristics. PLs mostly form lipid bilayer to
construct biological membranes with membrane proteins. Biological membranes not only
prepare conditions for metabolism by separating internal environment from external one to
limit traffic of substances, but also perform transportation of materials or provide the place in
which membrane proteins function.
Membrane lipids, which comprise biological membrans, do not have any activities like
those of proteins. Respective biological membranes show characteristic lipid compositions.
This characteristic suggests that lipids of biological membranes contribute to the exertion of
membrane functions. For example, thylakoid membranes, which perform photosynthetic
reaction, include four classes of lipids : monogalactosyl diacylglycerol (MGDG), digalactosyl
diacylglycerol (DGDG), sulfoquinovosyl giacylglycerol (SQDG), phosphatidyl glycerol (PG)
(Fig. a). These lipids are commonly found in O
2evolving photosynthetic organisms (Gounaris
et al., 1986). Photosystem II (PSII) protein complexes involve these lipids (Lu et al., 2007).
Our laboratory reported that SQDG in thylakoid membranes contributes to the maintenance
PSII structure and activity (Sato et al., 1995a; Aoki et al., 2004). Moreover, SQDG functions
as sulfur pool for protein synthesis in C. reinhardtii under sulfur starved conditions (Sugimoto
et al., 2007). Thus, SQDG plays a role in supporting PSII activity and providing sulfur as
intracellular-sulfur reservoir.
Melting points of fatty acids included in membrane lipids are changed by the length of
carbon chains, number of double bonds (degrees of unsaturation), and the cis/trans type of the
double bonds. Shorter carbon chains or, in particular, higher degrees of unsaturation
generally decrease the melting point. For example, when palmitic acid (16:0) turns into
palmitoleic acid (16:1), the melting point declines from 63.1°C to -0.5°C (Table a). This
change is caused by molecular density of fatty acids, and vacant space increases fluidity
among lipids. It was reported that, in cyanobacteium Synechocystis sp. PCC 6803, fatty acids
were desaturated in membrane lipids without de novo fatty acid synthesis when growth
temperature was shifted from 38°C to 22°C
(Wada et al., 1990). It is considered that theregulation of membrane fluidity is necessary for the proper functioning of biological
membranes (Cossins et al., 1989)
- 4 -
NLs, carotenoids are pigments including β-carotene, lutein, and astaxanthin, which
respectively have a potent anti-oxidative activity. β-carotene is also known as a precursor of
vitamin A. However, the amount of NLs mainly depends on TAG content in cells. TAG is
synthesized mainly on the Kennedy pathway, through transfer of three fatty acids to
3-phosphate (G3P) (Fig. c). The fatty acids released from TAG after lipase digestion are used
for β oxidation to yield acetyl-CoA. Acetyl-CoA is used for production of chemical energy
sources such as ATP in TCA cycle, or it is changed to carbohydrates by glyoxylate cycle. The
fatty acids also take part in PLs synthesis. Thus, TAG can be regarded as storage lipid of
energy and carbon.
TAG is included widely in animals and plants. Animals such as human and mouse hold
adipocytes which synthesize and reserve TAG, while plant accumulates TAG in specific
organs such as seeds and fruits. TAG form lipid droplet (LDs) which is surrounded by
monolayer of phospholipids (Tzen et al., 1992).
Algae are eukaryotic photosynthetic organisms, which are classified into various groups
such as Chlorophyta (green algae), Bacillariophyta (diatomea), Phaeophyta (blown algae),
Rhodophyta (red algae), etc. Algae also have TAG as lipid droplets
(LDs).
Interestingly,
algae accumulate TAG under some stress conditions. In green algae, it is well known that
cells increase starch and lipids (especially TAG) content in nitrogen (N)-deplete cultures. In
diatomea which have outer shells made of silica (Si), TAG accumulation is observed under
Si-deprived condition (Chen et al., 2008, Eizadora et al., 2009). However the reason of algal
TAG accumulation under stress conditions is still unclear.
TAG from plants is utilized for production of food oils and processed goods. Moreover,
attention is recently paid to production of biodiesel fuel (BDF) from plant oils from the aspect
of carbon neutral conception or green sustainable chemistry. Production of biomaterial from
algae have advantages such as effective use of land for culturing, and high yields in short term,
for instance, so that the applied algal technology for production of biomaterials from algae
have been attempted actively in the world. However, there still remain many technological
problems. The author has reported about membrane lipid changes as a response to sulfur
deficient stress in microalgae. In the process of lipid analysis, it was found that green alga
Clamydomonas reinhardtii (C. reinhardtii) accumulates TAG under sulfur deprived condition.
The information on the mechanism for algal lipid accumulation is limited. Therefore, lipid
changes and gene analyses were performed to investigate TAG accumulating mechanisms in
algae.
- 5 -
- 6 -
Fatty acid
Common name
Melting point (℃)12 : 0 Lauric acid 44.2 14 : 0 Myristic acid 52 16 : 0 Palmitic acid 63.1 18 : 0 Stearic acid 69.6 20 : 0 Arachidic acid 75.4 22 : 0 Behenic acid 81 24 : 0 Lignoceric acid 84.2 16 : 1 Palmitoleic acid -0.5
18 : 1 Oleic acid (cis -Δ9) 13.4
18 : 2 Linoleic acid (cis,cis -Δ9,Δ12) -9
18 : 3
α-Linolenic acid
-1718 : 3
γ-Linolenic acid
20 : 4 Arachidonic acid -49.5
20 : 5 Eicosapentaenoic acid (EPA) -54 22 : 6 Docosahexaenoic acid (DHA) -44.
- 7 -
- 8 -
http://www.3dchem.com/moremolecules.asp?I D=320&othername=triacylglycerol
- 9 -
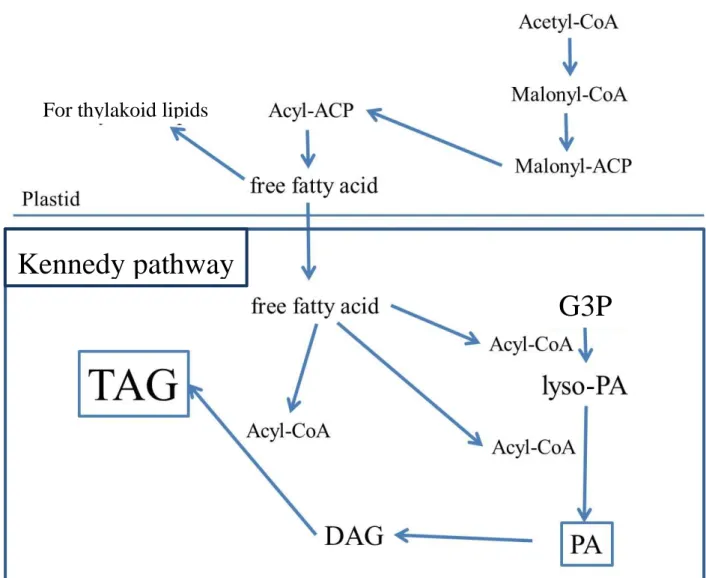
Fig.
c.
TAG
synthesis
is
carried
on
Kennedy
pathway
from
glycerol-3-phosphate (G3P) to TAG via lyso-phosphatidic acid (PA), PA and
DAG.
Kennedy pathway
G3P
- 10 -
Fig. d. Chlamydomonas reinhardtii CC125 mt+
C. reinhardtii can swim using flagella (black triangle)
forward to light. Eye spot (blue triangle) works as sensor of
light. Contains a bowl shaped chloroplast (green triangle) and
cell wall (no visual).
- 11 -
Chapter 1
- 12 -
1-1 IntroductionTriacylglycerol (TAG), which is one of the neutral lipids, is ubiquitous in eukaryotes and also present in a limited group of prokaryotes (Alvarez et al., 2002). Distinct from PLs that are predominantly membrane components, TAG has formed as lipid droplets (LDs). TAG has been considered as a storage compound: e.g. in oil seed plants, FAs esterified to TAG in seeds utilized by β-oxidation for energy production and gluconeogenesis, which supports the seedling growth after germination (Stone et al., 1997, Quettier & Eastmond, 2009). Recent studies indicated that TAG also participates in the synthesis of membrane lipids as an intermediate metabolite by supplying FAs in actively growing cells of yeast, Saccharomyces cerevisiae, and thus is critical for maintenance of lipid homeostasis (Rajakumari et al., 2010; Kohlwein & Henry, 2011). On the other hand, the view of industry, TAG is important as food oil and has been recently expected as a source of biodiesel fuel (BDF), which is produced through its chemical conversion into methyl or ethyl esters of FAs. Extensive attention has been paid to BDF production with photosynthetic organisms in particular, in terms of the carbon neutrality concept (Hu et al., 2008).
Many algal species have several advantages over terrestrial plants as to the production of biomaterials, including high annual biomass productivity on an area basis that is ensured by their high growth rates (Hu et al., 2008). Eukaryotic algae generally contain TAG at a low level during optimal growth conditions, but the content remarkably increases along with aging of the culture or under unfavorable stress conditions such as nutritional limitation (Hu et al., 2008), high salinity (Siaut et al., 2011), or high light (Picaud et al., 1991). As to nutrients, nitrogen deficiency has been shown to be the most effective factor for induction of accumulation of TAG in numerous algal species including green and red algae, diatoms, golden algae, haptophytes, eustigmatophytes, dinophytes, and yellow-green algae (Hu et al., 2008). Study of the mechanism by which the accumulation of TAG is stimulated, e.g. identification of key genes as to TAG synthesis and proteomic analysis of LDs, is indispensable for enhancement of the productivity of TAG, but this has only just begun for algal species (Nguyen et al., 2011; Boyle et al., 2012; Deng et al., 2012; Msanne et al., 2012).
The author had studied about thylakoid membrane lipid changes under nutrient such as sulfur and phosphorus, deficient conditions using green alga C. reinhardtii. On that process of lipid analysis, it was found that C. reinhardtii accumulates NLs in sulfur-starved condition. NLs were nearly occupied by TAG in general. Therefore, firstly, the author demonstrated TAG accumulation under sulfur deficient condition, and performed quantitative analysis to compare with TAG increasing in known by nitrogen deficiency in this chapter.
- 13 -
1-2 Material and Methods
Strains and growth conditions
C. reinhardtii and
Chlorella kessleri
11h were cultured with continuous illumination at 30°C in TAP medium (Harris, 1989) for mixotrophic growth of C. reinhartdii cells in a flask on a rotary shaker, or in 3/10 HSM (Gillham et al., 1970) for photoaoutotrophic growth of C. reinhardtii and C. kessleri cells in an oblong glass vessel with aeration. For transfer to nutritionally starved conditions, cells grown to the mid-logarithmic phase in TAP medium or ones grown to the mid-linear phase in 3/10 HSM were harvested by centrifugation, washed twice and then resuspended in the corresponding S-, N- or P-free medium (Sugimoto et al., 2010). Growth of the cells was monitored by determination of the optical density at 730 nm with a spectrophotometer DU800 (Beckman, USA). When needed, the flask, in which cells of C. reinhardtii were mixotrophically cultured, was completely covered with aluminum foil for subjection to the dark condition.Extraction of lipids, and their quantitative analysis
Total lipids were extracted from cells of C. reinhardtii and C. kessleri, respectively, according to the method of Bligh and Dyer (1959), and thereafter separated into individual classes of neutral lipids by TLC on precoated silica gel plates [Merck 5721, (Sugimoto et al., 2007)] with a solvent system of hexane/diethylether/acetate (70:30:1, v/v/v, Chen et al., 2008). The spots of lipids were visualized by illumination of UV light after spraying with primulin (0.01% in 80% acetone, w/v). Fatty acid methyl esters were prepared from the total lipids, TAG, and free FAs by heating at 95°C with 5% anhydrous methanolic HCl, and thereafter analyzed by capillary GLC, as described previously (Sato et al., 1995). The FA content of each fraction was estimated with arachidonic acid as an internal standard.
Microscopic observation of lipid droplets
A Nile red solution (0.25 mg·ml-1 in acetone, Keith et al., 1987) was added to respective cell
suspensions of C. reinhardtii and C. kessleri (1:50, v/v) and the stained cells were observed under a fluorescence microscope (BX-FLA, Olympus Optical Co., Tokyo, Japan) with the use of a 520-550 nm excitation filter.
Regular air drying condition and harvesting
To impose regular air-drying (RAD) condition on the cells, 20 mL of a pre-culture was vacuumed on a glass fiber filter (GF/C 47mm, Whatman GE healthcare UK) which were measured the weight in advance. Thereafter, the cells were incubated on the filter at 30°C for 96 h in a plastic box with illumination with fluorescent light (15 µmol photons/m2 s). For slow drying of the filter, the air was
- 14 -
in culture medium or H2O. For measurement of dry cell weight (DCW), the cells on the glass filter
- 15 -
1-3Results
Enhanced accumulation of TAG under stress conditions in C. renhardtii
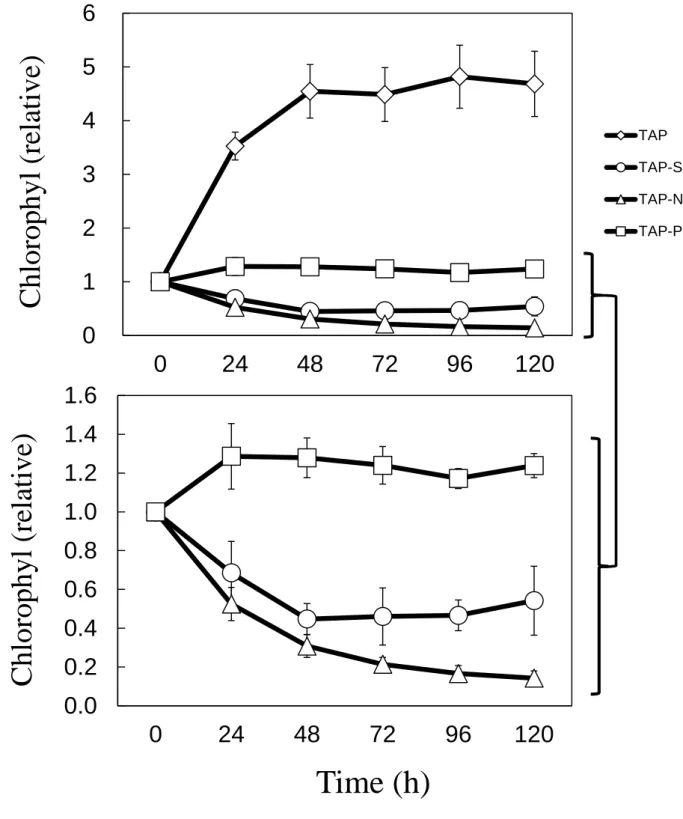
Growth rates were measured in C. reinhardtii under TAP, TAP-S (-S), TAP-N (-N), TAP-P (-P) (Fig. 1-1). Cells under TAP medium increased to 5.1-fold as a maximum level at 72h, and the value was kept until 120h. In contrast, under stress condition -S, -N, -P showed 2.1, 1.8, 2.9-fold respectively at 120h. Chlorophyll (Chl) content was also suppressed in each medium, and especially in TAP-S and TAP-N, Chl decreased to less than a half of initial level (Fig. 1-2).
LDs were increased under -S, and -N conditions remarkably, but LDs were observed generally in cells (Fig. 1-3). Stress exposed cells tended to become corpulence comparing with control, and popping cells were often observed (see in -N). Moreover it was investigated that iron (-Fe), and both nitrogen and phosphorus (-N, -P) deficient stress. As a result, only double -N, -P conditions led increase in LD, although cell bleaching seen in a few cells.
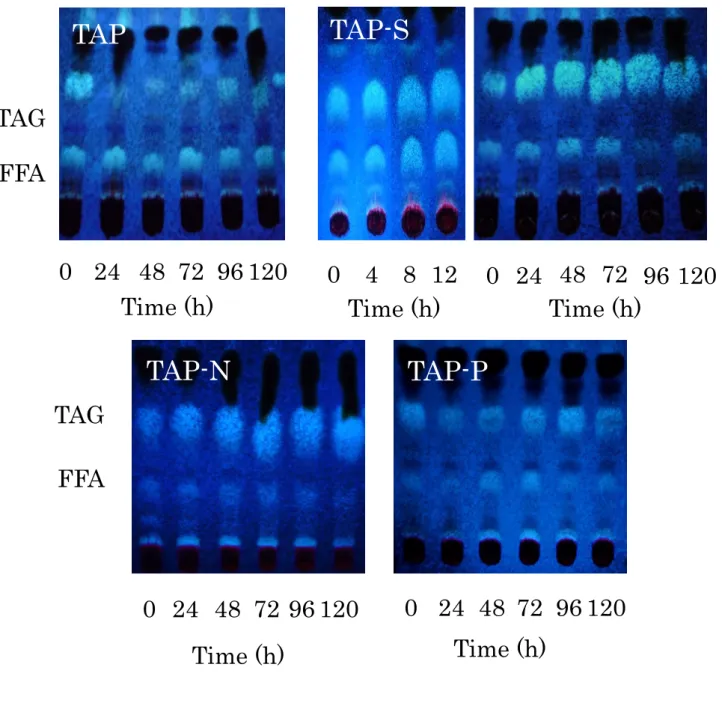
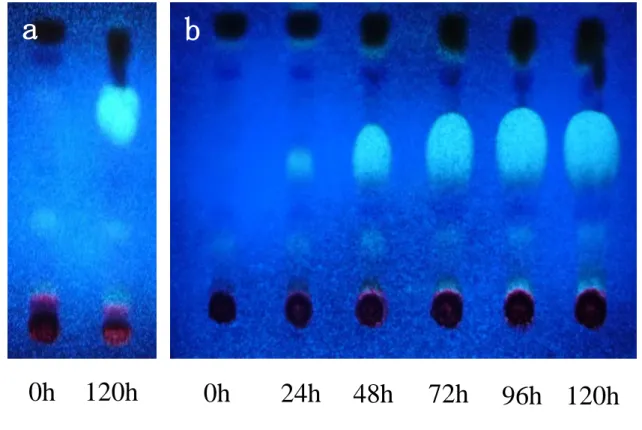
Lipids were extracted from cells under stress conditions, and were separated into neutral lipids class (FFA, TAG) by TLC, and exhibited TAG accumulation under -S and -N conditions. TAG was also included in -P cells (Fig. 1-4).
TAG content and fatty acid composition
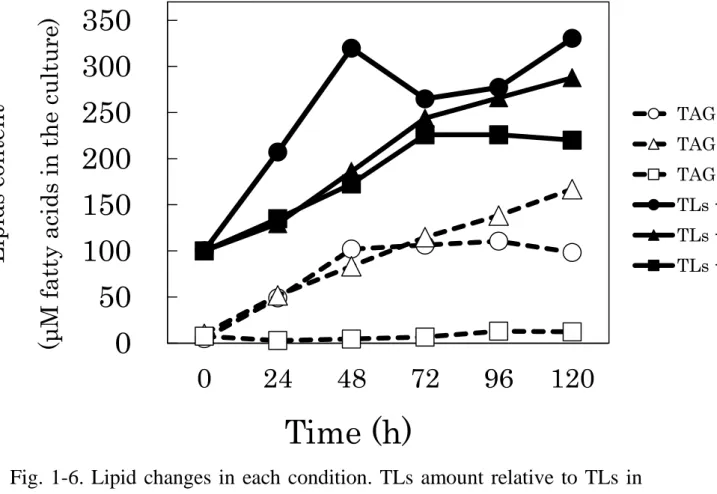
FAs analysis about TAG, FFA, and total lipids (TLs) were performed by gas chromatography. TAG content relative TLs were 40.3% as the highest volume at 72h under -S condition. After that, the volume decreased gently, and showed 36.3% finally at 120h. In the case of -N condition, TAG content kept increasing until 120h, and reached 56.6%. While -P conditions, TAG content declined to 2.3% after 24h from 7.7% at the beginning time. After that, it recovered slowly to 5.6% at 120h (Fig. 1-5). TAG content relative to the liquid culture were shown by adjusting TLs content at 0h to 100µM (Fig. 1-6). TLs contents increased under -S, -N, -P conditions, and showed 330.4µM, 287.8µM, 220.1µM respectively. TAG content were 98.3µM、166.8µM、12.2µM. In these result, it was suggested that -S conditions causes TAG accumulation as well as in known N-limitation, but P-limitation have no relationship to TAG accumulation in C. reinhardtii.
FAs composition were common in each -S, -N, -P (table 1-1, 2, 3). TAG possessed palmitic acid (16:0), oleic acid (18:1), linoleic acid (18:2), linolenic acid (18:3) mainly. By stress condition degrees of unsaturation was raised but no change in C16/C18 ratio (table 1-4).
Photo autotrophic TAG accumulation in algae
To understand TAG accumulation in photo autotrophic (PA) growth, Chlorella kessleri (C. kessleri) and C. reinhardtii were brought up with 3/10 HSM medium. Growth rate in C. kessleri was suppressed to 0.43 and 0.28-fold under PA -S, and -N respectively (Fig. 1-7). PA -S growth showed 3.5 -fold in
C. reinhardtii, the value was as 1.6-fold high as that of mixo trophic -S (MX: means TAP-S growth)
- 16 -
reinhardtii (Fig. 1-8), and increased TAG content, that shown in TLC (Fig. 1-9).
TAG contents in the PA growth condition were shown in Fig. 1-10. Comparing MX and PA under -S condition in C. reinhardtii, PA condition raised TAG content relative to TLs at 56.9% which was nearly equal to MX-N condition. C. kessleri accumulated TAG at 43.5%, and 73.0% in -S, and -N respectively. There were no differences between C. kessleri and C. hardtii in TAG accumulation under -S condition. However, TAG production per liquid culture in C. kessleri was more twice higher than that in C. reinhardtii.
PA growth did not affect FA composition of TAG and TLs in C. reinhardtii (table 1-5) C. kessleri included palmitic acid, stearic acid, oleic acid, linoleic acid, and linolenic acid mainly. Especially, linoleic acid occupied about 30% to as the whole of TAG (Fig. 1-1)
Change of fatty acid composition by temperature in C. kessleri
C. kessleri grew at 35°C as well as 30°C, and increased 5.6-fold at 120h under -S condition. However,
vaporization of culture medium is notably so that values in A730 were varied. The other one at 20°C
showed 4.1-fold (Fig. 1-12).
Interestingly, TAG contents relative to TLs were 78.8% and 52.5% at 20°C and 35°C under -S condition (20°C-S, 35°C-S) respectively (Fig. 1-13a). These values are higher than the value of 30°C-S as a usual condition. Lipid contents relative to cell volume were shown in Fig. 1-13b. The values of TAG were 345µmol and 291µmol in 20°C-S and 35°C-S conditions. These values were 2.1 and 1.8-fold higher than that of in 30°C-S condition (Fig. 1-13b).
FA composition of TAG changed remarkably in 20°C -S condition. Stearic acid and linoleic acid decreased, but oleic acid and linolenic acid increased. Especially oleic acid was contained more than 40% in TAG (Fig. 1-14). Degree of unsaturation was increased to 1.41 from 1.23, and melting point was decreased to 11.9 degrees Celsius (table 1-6).
Comparative analyses of TAG accmulation in C. reinhardtii and C. kessleri
Each strain were suppressed growth rate under -S condition, but C. kessleri showed more than 5-fold increase which was higher than that of C. reinhardtii in TAP medium (Fig. 1-15a). TAG accumulations were observed from 24h and 48h in C. reinhardtii and C. kessleri separately. There were no significant differences in final TAG content relative to TLs and cell volume, interestingly (Fig. 1-15b,c). For example, TAG content relative to TLs were kept 40±3% in each strain. However, produced TAG volume in the culture was 371µM in C. kessleri. It is 4.8-fold higher than that of C. reinhardtii (Fig. 1-15d).
- 17 -
compare with C. reinhardtii and C. kessleri simply because of difference of culture medium, but there was found that -N condition tended to cause high accumulation of TAG.
Air-drying cell growth and TAG accumulation in C. reinhardtii
Cells were grown on glass-fiber filter aerating 2% CO2 in chamber, and named this condition regular
air drying (RAD). RAD condition was able to grow the cells till 48h but decreased Chl content to a half of initial level at 120h (Fig. 1-17). LDs were contained in RAD cells but half of these cells were died (Fig. 1-18a). TAG volume in which was 37.9% at 72h as the highest level, kept until 120h with slow decreasing (Fig. 1-18b). FA composition of TAG was C16 saturated FA and C18 unsaturated FAs as well as that of other conditions (table 1-7).
To demonstrate what determined TAG content under RAD condition, culture medium (3/10 HSM) or pure-water (H2O) were supplied from the bottom of filter (see supplement Fig. 1-a). Growth rate and
TAG content were measured (Fig. 1-19). Supplying 3/10 HSM allowed higher growth and Chl content than supplying H2O or RAD condition (Fig. 1-19a). About TAG contents, supplying H2O showed
1.4-fold as high as RAD condition, in contrary, supplying 3/10HSM decreased to 0.8-fold. TAG contents relative to dry cell weight (DCW) were 4.9%, 3.2%, 5.9% in supplying 3/10HSM, supplying H2O, and RAD respectively (Fig. 1-19b).
- 18 -
Fig. 1-1. Growth rate under TAP (open diamonds), TAP-S (open circles),
TAP-N (open triangles), and TAP-P (open squares) in C. reinhardtii.
OD
730values were measured and set value at 0h to 1.0 as initial level in
- 19 -
0.0
0.2
0.4
0.6
0.8
1.0
1.2
1.4
1.6
0
24
48
72
96
120
0
1
2
3
4
5
6
0
24
48
72
96
120
TAP TAP-S TAP-N TAP-PChloro
ph
yl
(re
la
ti
ve)
Chloro
ph
yl
(re
la
ti
ve)
Time (h)
- 20 -
TAP
TAP-S
TAP-N
TAP-P
TAP-Fe
TAP-N,-P
10µm
40µm
40µm
10µm
- 21 -
TAG
FFA
0 24 48 72 96 120
0 24 48 72 96 120
0 24 48 72 96 120
TAP-S
TAP-N
TAP-P
TAG
FFA
0 4 8 12
0 24 48 72 96 120
TAP
Time (h)
Time (h)
Time (h)
Time (h)
Time (h)
- 22 -
-0.1
0
0.1
0.2
0.3
0.4
0.5
0.6
0.7
0
24
48
72
96
120
T
AG
co
nte
nt re
lati
ve
to
T
Ls
(m
ol%)
Time (h)
10
20
30
40
50
60
*
*
- 23 -
0
50
100
150
200
250
300
350
0
24
48
72
96
120
TAG - S
TAG - N
TAG - P
TLs - S
TLs - N
TLs - P
Lipids co
nte
nt
(μ
M
fatt
y aci
ds in the
cult
ure)
Fig. 1-6. Lipid changes in each condition. TLs amount relative to TLs in
TAP-S (open circles), TAP-N (open triangles), TAP-P (open squares). Fatty
acids from TAG or TLs were formed to fatty acid methyl ester (FAME),
and analyzed by GC with internal standard. All values mean average ± SE
determined by three independent experiments. Asterisk means that there
was meaningful difference between two results (p < 0.05).
- 24 -
TAG
TAP-S TAP-N TAP-P
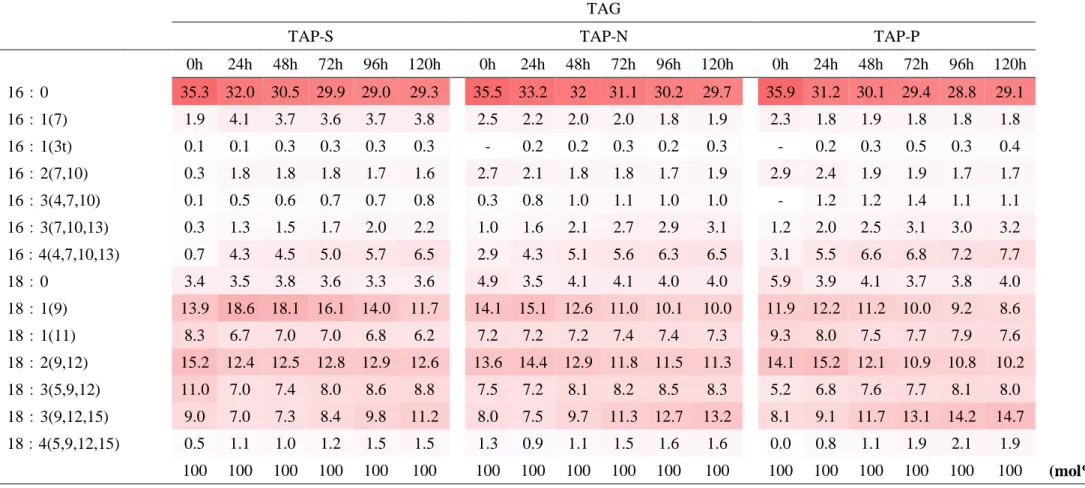
0h 24h 48h 72h 96h 120h 0h 24h 48h 72h 96h 120h 0h 24h 48h 72h 96h 120h 16:0 35.3 32.0 30.5 29.9 29.0 29.3 35.5 33.2 32 31.1 30.2 29.7 35.9 31.2 30.1 29.4 28.8 29.1 16:1(7) 1.9 4.1 3.7 3.6 3.7 3.8 2.5 2.2 2.0 2.0 1.8 1.9 2.3 1.8 1.9 1.8 1.8 1.8 16:1(3t) 0.1 0.1 0.3 0.3 0.3 0.3 - 0.2 0.2 0.3 0.2 0.3 - 0.2 0.3 0.5 0.3 0.4 16:2(7,10) 0.3 1.8 1.8 1.8 1.7 1.6 2.7 2.1 1.8 1.8 1.7 1.9 2.9 2.4 1.9 1.9 1.7 1.7 16:3(4,7,10) 0.1 0.5 0.6 0.7 0.7 0.8 0.3 0.8 1.0 1.1 1.0 1.0 - 1.2 1.2 1.4 1.1 1.1 16:3(7,10,13) 0.3 1.3 1.5 1.7 2.0 2.2 1.0 1.6 2.1 2.7 2.9 3.1 1.2 2.0 2.5 3.1 3.0 3.2 16:4(4,7,10,13) 0.7 4.3 4.5 5.0 5.7 6.5 2.9 4.3 5.1 5.6 6.3 6.5 3.1 5.5 6.6 6.8 7.2 7.7 18:0 3.4 3.5 3.8 3.6 3.3 3.6 4.9 3.5 4.1 4.1 4.0 4.0 5.9 3.9 4.1 3.7 3.8 4.0 18:1(9) 13.9 18.6 18.1 16.1 14.0 11.7 14.1 15.1 12.6 11.0 10.1 10.0 11.9 12.2 11.2 10.0 9.2 8.6 18:1(11) 8.3 6.7 7.0 7.0 6.8 6.2 7.2 7.2 7.2 7.4 7.4 7.3 9.3 8.0 7.5 7.7 7.9 7.6 18:2(9,12) 15.2 12.4 12.5 12.8 12.9 12.6 13.6 14.4 12.9 11.8 11.5 11.3 14.1 15.2 12.1 10.9 10.8 10.2 18:3(5,9,12) 11.0 7.0 7.4 8.0 8.6 8.8 7.5 7.2 8.1 8.2 8.5 8.3 5.2 6.8 7.6 7.7 8.1 8.0 18:3(9,12,15) 9.0 7.0 7.3 8.4 9.8 11.2 8.0 7.5 9.7 11.3 12.7 13.2 8.1 9.1 11.7 13.1 14.2 14.7 18:4(5,9,12,15) 0.5 1.1 1.0 1.2 1.5 1.5 1.3 0.9 1.1 1.5 1.6 1.6 0.0 0.8 1.1 1.9 2.1 1.9 100 100 100 100 100 100 100 100 100 100 100 100 100 100 100 100 100 100 (mol%)
Table 1-1. Fatty acid composition of TAG in TAP-S, -N, -P. Fatty acids from TAG were formed to
FAME, and determined by GC.
* Not detected
- 25 -
TLs
TAP-S TAP-N TAP-P
0h 24h 48h 72h 96h 120h 0h 24h 48h 72h 96h 120h 0h 24h 48h 72h 96h 120h 16:0 20.2 24.5 27.0 26.0 25.8 25.5 23.2 28.2 29.4 30.4 30.7 30.7 23.0 27.1 28.2 28.2 29.4 29.6 16:1(7) 1.9 2.6 2.8 3.0 3.2 3.4 2.0 1.8 1.7 1.7 1.7 1.9 1.4 1.7 2.0 1.7 1.8 1.8 16:1(3t) 1.0 1.2 0.8 1.1 1.1 1.2 0.7 0.3 0.3 0.9 0.2 0.3 1.0 -* 0.4 1.8 0.3 0.4 16:2(7,10) 2.9 2.2 2.0 2.1 1.7 1.7 3.2 2.2 1.5 1.3 1.5 1.7 2.9 1.9 1.6 1.3 1.6 1.4 16:3(4,7,10) 1.7 1.2 1.0 1.1 1.0 1.0 1.8 1.6 1.1 1.4 1.0 0.9 2.1 1.6 1.1 1.0 1.1 0.9 16:3(7,10,13) 2.8 2.0 2.3 2.3 2.3 2.3 3.1 2.2 2.4 4.0 2.7 2.6 2.7 2.4 2.4 2.5 2.6 2.6 16:4(4,7,10,13) 11.8 9.2 7.9 8.2 7.7 8.0 10.6 8.3 7.0 6.7 6.2 6.1 10.8 9.1 7.1 6.9 6.9 6.8 18:0 3.4 3.5 4.0 3.7 3.7 3.9 4.3 5.7 5.9 6.2 5.3 4.8 5.2 7.2 8.3 7.3 5.7 5.2 18:1(9) 5.8 9.7 10.3 9.7 8.7 7.6 5.8 7.7 8.0 7.5 7.7 8.0 3.5 5.5 7.6 7.4 7.3 7.1 18:1(11) 3.3 4.6 5.5 5.6 5.8 5.8 3.1 4.2 5.5 6.9 6.9 7.0 3.6 4.1 5.6 6.4 7.9 7.5 18:2(9,12) 15.5 14.1 12.9 13.1 12.6 12.5 15.8 13.5 11 9.9 9.9 10.5 16.3 13.2 9.3 8.9 8.7 9.2 18:3(5,9,12) 8.5 8.3 8.4 8.7 9.3 9.7 8.1 8.3 9.4 11.7 9.6 9.7 8.5 8.6 8.3 8.7 9.2 9.8 18:3(9,12,15) 19.9 15.8 14.8 15.1 15.9 16.3 17.1 15.1 15.3 10.2 14.7 14.3 18.0 16.5 15.8 15.5 15.6 15.6 18:4(5,9,12,15) 1.4 1.4 1.4 1.1 1.2 1.2 1.2 1.0 1.7 1.6 1.9 1.8 0.9 1.1 2.3 2.1 1.8 2.2 100 100 100 100 100 100 100 100 100 100 100 100 100 100 100 100 100 100 (mol%)
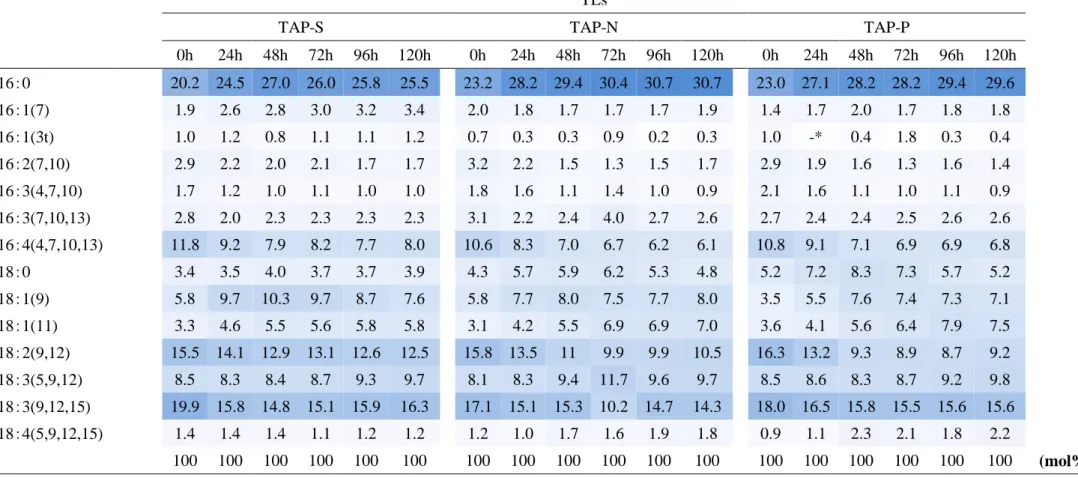
table 1-2. Fatty acid composition of TLs in TAP-S, -N, -P. Fatty acids from TLs were formed to
FAME, and determined by GC.
* Not detected
- 26 -
FFATAP-S TAP-N TAP-P
0h 24h 48h 72h 96h 120h 0h 24h 48h 72h 96h 120h 0h 24h 48h 72h 96h 120h 16:0 21.2 25.8 26.4 26.1 26.6 31.1 29.3 32.7 29.5 33.2 38.2 35.8 40.3 36.4 31.0 35.2 39.1 34.9 16:1(7) 1.3 1.2 1.9 2.0 2.0 2.3 3.6 - 1.9 2.5 2.6 - 7.2 - 2.0 2.4 5.1 - 16:1(3t) - - - - 16:2(7,10) 3.8 - - - 5.9 2.8 - - - - 16:3(4,7,10) - - - 0.5 - 0.5 - - - - 16:3(7,10,13) - - - 0.8 - - - - 16:4(4,7,10,13) 1.7 - - - - 2.2 - - - - 18:0 19.0 33.8 35.0 25.9 24.2 28.9 25.8 38.6 31.2 31 29.4 31.4 37.2 56.1 55.1 53.7 43.0 47.0 18:1(9) 4.8 4.9 4.8 6.0 5.3 6.6 7.0 5.7 4.9 4.4 3.6 4.3 10.2 3.8 4.6 4.5 2.8 3.2 18:1(11) 2.6 1.2 2.2 2.8 3.1 3.9 0.8 0.9 1.7 1.3 2 2.8 - - - 2.0 18:2(9,12) 14.3 10.8 8.9 9.0 9.1 11.0 10.1 7.4 6.8 5.4 5.0 6.0 - 1.6 2.1 - 2.2 2.3 18:3(5,9,12) 5.2 - 0.6 0.8 2.3 3.7 1.7 1.0 2.5 1.0 1.8 2.9 - - - 1.7 18:3(9,12,15) 22.4 21.2 18.5 23.6 23.3 12.7 22.9 12.9 21.6 22.9 19.0 17.6 5.1 2.1 5.2 4.3 7.8 8.9 18:4(5,9,12,15) 3.6 4.0 5.3 4.7 6.4 2.6 - 1.1 - - - - 100 100 100 100 100 100 100 100 100 100 100 100 100 100 100 100 100 100 (mol%)
Table 1-3. Fatty acid composition of FFA in TAP-S, -N, -P. Free fatty acids from cell were
formed to FAME, and determined by GC.
* Not detected
- 27 -
FFA
TAG
TLs
0h
24h 48h 72h 96h 120h
0h
24h 48h 72h 96h 120h
0h
24h 48h 72h 96h 120h
C16/C18
TAP-S 0.28 0.36 0.37 0.39 0.47 0.57
0.63 0.78 0.75 0.75 0.76 0.80
0.73 0.75 0.76 0.77 0.75 0.76
TAP-N 0.48 0.48 0.46 0.54 0.67 0.55
0.79 0.80 0.79 0.81 0.79 0.80
0.81 0.80 0.76 0.86 0.79 0.79
TAP-P 0.90 0.57 0.49 0.60 0.79 0.54
0.83 0.79 0.80 0.82 0.79 0.82
0.78 0.78 0.75 0.96 0.78 0.77
Degrees of
Unsaturation
TAP-S 1.45 0.96 0.89 1.09 1.24 1.04
1.20 1.23 1.27 1.34 1.42 1.47
1.96 1.71 1.62 1.65 1.65 1.67
TAP-N 1.05 0.64 0.94 0.91 0.81 0.81
1.20 1.27 1.36 1.42 1.48 1.50
1.84 1.61 1.55 1.50 1.50 1.50
TAP-P 0.33 0.13 0.26 0.20 0.36 0.42
1.13 1.37 1.46 1.51 1.55 1.56
1.86 1.66 1.51 1.50 1.53 1.54
Table 1-4. Characteristics of FA in 16 cabon fatty acids (C16) and 18 carbon fatty acids (C18)
ratio, and degrees of Unsaturation .
- 28 -
Fig. 1-7. Growth rates in 3/10HSM -S, and -N condition (after
120h). Cells were cultured with bubbling air. A
730was measured
- 29 -
C.kessleri
-N
-S
control
10µm
10µm
30
a
0h 120h
0h
24h
48h
72h
96h 120h
b
31
0
20
40
60
80
100
0
200
400
600
800
1000
MX
T
AG co
nten
t (
μ
M)
T
A
G content
re
la
tive
to
T
Ls
(mol%
)
MX
PA
PA
PA
-S
-N
Fig. 1-10. Lipid content under various conditions in C. reinhardtii and C.
kessleri at 120h. Lipid content is calculated in FA base. Photo-autotrophic
- 33 -
0h TLs 120h TLs 120h TAG 16:0 21.64 29.38 27.14 16:1(7) 2.97 5.95 6.51 16:1(3t) 1.87 0.67 0.27 16:2(7,10) 3.04 1.58 1.65 16:3(4,7,10) 2.32 0.53 0.54 16:3(7,10,13) 2.77 2.99 3.48 16:4(4,7,10,13) 13.52 4.60 4.36 18:0 5.90 4.83 3.10 18:1(9) 4.00 12.32 15.93 18:1(11) 3.96 7.45 7.96 18:2(9,12) 10.30 10.40 11.11 18:3(5,9,12) 6.99 8.17 7.53 18:3(9,12,15) 19.50 9.76 9.10 18:4(5,9,12,15) 1.19 1.37 1.33 (mol%)- 34 -
0
5
10
15
20
25
30
35
40
TAG-N
TLs-N
TAG-S
TLs-S
F
A
(
%
)
Fig. 1-11. Fatty acid (FA) composition of TAG and TLs in
C.kessleri. Values are averages ± SE for three independent
- 35 -
0
1
2
3
4
5
6
7
8
20℃
30℃
35℃
G
row
th
(
relati
v
e)
Fig. 1-12. Effect of temperature on growth rate under -S
conditions in C.kesseri (120h). Cells were cultured at 30°C
as control. Values were related on A
730at 0h. Three
36
0
15
30
45
60
75
90
20°C
35°C
T
AG
co
nte
nt re
lati
ve
to
T
L
s (mo
l%
)
0
150
300
450
600
750
20°C
30°C
35°C
TAG
TLs
Lipid c
onte
nt
s
(Re
lat
ive)
a
b
37
0
20
40
60
80
100
20℃
30℃
35℃
18:3(9,12,15) 18:2(9,12) 18:1(9) 18:0 16:3(7,10,13) 16:2(7,10) 16:1(3t) 16:1(7) 16:038
20℃
30℃
35℃
Degrees of unsatulation*
1.41
1.23
1.21
Melting point(°C )**
11.1
19.9
19.7
Table 1-6. Lipid characteristics by temperature. TAG was
prepared from S-starved C.kessleri cells at 120h
39
0
5
10
15
20
0
24 48 72 96 120
0
20
40
60
80
0
24 48 72 96 120
0
100
200
300
400
500
0
24 48 72 96 120
0
10
20
30
40
50
60
0 24 48 72 96 120Growth
(
relative)
T
AG
con
ten
t r
elati
v
e to
TL
s
(m
o
l%)
T
AG
con
ten
t
(F
As
μM)
T
AG
con
ten
t (
Rela
tiv
e)
Time (h)
Time (h)
Time (h)
Time (h)
a
c
d
b
Fig. 1-15. Comparing the cells between C. reinhardtii (open symbols)
and C. kessleri (closed symbols). C. reinhardtii cells were cultured with
TAP medium (Fig. a, open diamonds), and 3/10 HSM was used for C.
kessrelei (closed diamonds). Values in Fig. c relative to cell volume
40
Dr
y c
ell
w
eig
h
t (%)
0
10
20
30
40
8.5% 14.9% 10.5% 17.5% 18.4% 34.0%41
2.0
3.0
4.0
5.0
6.0
7.0
40
60
80
100
120
140
160
0
24
48
72
96
120
Chl c
ontent (
μ
g/
filter
)
DCW (mg/
fil
ter)
Time (h)
42
-10
0
10
20
30
40
50
0
24
48
72
96
120
TAG
b
a
Fig. 1-18. Nile red staining of RAD cells at 96h (a). LDs were observed
in some cells (yellow triangle), some cells were discolored (white
triangle). Scale bar means 10µm. FA derived from TAG relative to TFA
(red circles) with TLC background (b). The values are averages ± SE in
three filters at same periods respectively.
43
TAG NL+PL 0h 24h 48h 72h 96h 120h 0h 24h 48h 72h 96h 120h 16:0 -* 35.1 28.1 27.5 26.6 27.0 19.8 22.3 24.7 26.1 26.5 30.2 16:1(7) - 6.8 5.6 4.7 4.3 3.8 4.5 4.5 4.2 4.0 3.6 3.7 16:1(3t) - - 0.1 0.2 0.2 0.1 1.5 1.5 0.9 0.6 0.5 0.5 16:2(7,10) - 0.8 1.7 1.7 1.8 1.8 3.4 2.4 2.5 2.1 1.5 1.7 16:3(4,7,10) - 0.5 0.7 0.8 0.9 1.0 2.3 1.7 1.4 1.4 1.2 1.3 16:3(7,10,13) - 1.0 1.7 1.9 2.2 2.3 2.6 2.3 2.4 2.2 2.1 1.8 16:4(4,7,10,13) - 3.6 4.6 5.2 6.0 6.4 12.2 11.1 8.9 8.7 8.1 6.8 18:0 - 13.8 4.4 4.3 4.3 4.6 8.9 7.8 7.1 6.1 7.4 12.7 18:1(9) - 13.6 14.6 11.6 11.1 9.0 9.7 9.5 8.8 7.5 5.7 6.1 18:1(11) - 8.5 13.7 14.4 13.9 14.2 2.9 4.5 7.7 9.2 9.8 9.8 18:2(9,12) - 6.4 9.8 10.6 10.4 9.9 8.4 9.4 10.2 9.4 7.0 6.7 18:3(5,9,12) - 4.7 6.6 7.1 7.2 7.4 5.2 5.2 5.7 6.4 7.8 5.7 18:3(9,12,15) - 4.7 7.1 8.6 9.7 10.8 17.2 16.6 14.6 15.1 17.5 12.0 18:4(5,9,12,15) - 0.6 1.1 1.4 1.4 1.8 1.2 1.2 0.9 1.1 1.3 1.0 - 100 100 100 100 100 100 100 100 100 100 100Table 1-7. Fatty acid composition in C.reinhardtii under RAD conditions.
Three independent experiments were shown as average
* Not detected
44
0.0
2.0
4.0
6.0
8.0
10.0
0
50
100
150
200
250
0.0
2.0
4.0
6.0
8.0
0
10
20
30
40
50
3/10 HSM
H
2
O
RAD
T
AG co
nten
t
rel
ati
ve
t
o D
CW
(%
)
Chl c
ont
ent
(μ
g
/f
il
ter)
DCW
(mg/
filter)
T
AG co
nten
t
rel
ati
ve
t
o T
Ls
(mol
%)
3/10 HSM
H
2
O
RAD
Fig. 1-19. Influences of supplying culture or H
2O on growth (a) and
TAG accumulation (b) after 96h RAD conditions. Chl content (white
bar), DCW (black bar), TAG content relative to TLs (white bar with
dot), TAG content relative to DCW (black bar with dot). Values are
averages ± SE for three filters at the same term.
45
1-4 DiscussionAlgal TAG accumulations in nutrient deficiency were shown in this chapter. It is known that algae store TAG in stress conditions such as nitrogen deficiency, high salt etc. In addition to these conditions, it was found that sulfur-starved stress also triggered the TAG accumulation. Stressed cells tended to become large, and, the structure of chloroplast was disintegrated under -S or -N conditions (Fig. 1-3). Cell hypertrophy is also known in a SQDG deficient mutant and temperature dependent cell division mutant (2004 Imai master thesis, Brandt et al., 2012), SQDG redistributes and declines actually in S-starved cells (Sugimoto et al., 2007). Chl decreasing supports the disintegration of chloroplastic structure. Electron microscopy helps the understanding to the detail of this chloroplast redistribution. It appears that starch oppresses the grana at chloroplast in N-starved cells (Fan et al., 2011). Sulfur deficient condition also induce starch amount in C. kessleri and C. reinhardtii (Brányiková et al.,2010; Mizuno et al., 2013, Russa et al 2012), and the author confirmed, too (supplemental Fig. 1-a). LDs which contain TAG are surrounded by monolayer phospholipid with oleosin, caleosin, and steleosin that are alkali-proteins in land plant (Tzen et al., 1992, Purkrtova et al., 2008). The function of these alkali-proteins has not been definite, but oleosin and caleosin were considered that control the size or stabilization of LDs (Purkrtova et al., 2008, Chapman et al., 2012). Chlamydomonas have oleosin-like protein, and also functions as well as land plant. However Chlorella has not been reported about oleosin. The author tried to seek oleosin-like protein but there was no positive evidence in Clollera. This was the reason why the size of LDs in C. kessleri was larger than that of in C. reinhardtii (Fig. 1-8). Moreover, C. reinhardtii have LDs specific protein called major lipid droplet protein (MLDP) that is super hydrophobic protein (Neguyen et al., 2011). Recent study has developed the understanding of LD formed process, LDs are localized in cytosol mainly, but chloroplasts and endoplasmic reticulum (ER) cooperate to form LDs (Goodson et al., 2011).
46
contained lipid as SQDG and nitrogen contained lipid as DGTS are in membrane lipids. Former is minority lipid, nevertheless participates in photosynthesis as one of thylakoid membrane lipid, and supports its activity (Sato et al., 1995, Aoki et al., 2004). DGTS is abundant as about 20% in membrane lipid, and it is the most major lipid which don’t compose thylakoid membranes (supplemental table. 1-a). It is also known that DGTS synthetic enzyme is contained in LDs (Neguyen et al., 2011). Thus, less increase of TLs under -N conditions than -S was explained by balance of DAG supply in the view of nutrient necessity. DGTS was able to be synthesized in -S, and DAG was used for TAG and other lipids including DGTS [also known phospholipids increasing in -S (2009 Sato master thesis)] synthesis. In the -N condition, DAG flow would incline to TAG synthesis.
TAG of C. reinhardtiii contained palmitic acid, oleic acid, linoleic acid (table 1-1), and besides in C. kessleri included stearic acid. For lack of desaturate enzyme, FA composition of C.
kessleri was simpler than that in C. reinhardtii. These major FAs in algae were similar to palm
(fruit) oil which is the most used in the world. Melting point was about 20°C (data not shown). Included other C16 and C18 unsaturated FFAs, FA variety was shown in green algae. Notably, TAG involved 16:1 (3t) FA which is present in PG particularly. This result suggested that TAG synthesis involved in FAs reusing. However, main FFAs were palmitic acid, stearic acid, and linolenic acid. Utilization of FAs from distributed lipids was minority, since FA composition of TAG did not increase these FAs. Degrees of unsaturation of TAG increased in each condition at 120h (table 1-4). That of TLs did not show the tendency, it was characteristic in TAG. Getting degrees of unsaturation gives fluidity to cell membrane and results of surplus energy consumption (Sugimoto et al., 2008). TAG may have a possibility to receive surplus energy, because that would not compose cell membranes.
TAP medium includes acetate as carbon source, and acetate is involved in FA synthesis as acetyl-CoA. Acetate acts extremely to the volume of LDs under N-starved conditions in starch-less mutant C. reinhardtii (Goodson et al., 2011), so that it is considered that adding carbon source is important to TAG accumulation. However, the author showed high TAG accumulation in PA growth (Fig. 1-10). The volume of supplied carbon source by bubbling air may be higher than use of TAP, because acetate in TAP was used rapidly and be exhausted within a day (Ramanan et al., 2010). Therefore, the author concluded that carbon acquisition in cell was important but not existence of acetate or MX growth condtions. In addition to, the used starch-less mutants also known as high TAG accumulation under -N condition (Wang et al., 2009, Li et al., 2010a). These cells would show differences easily in TAG accumulation.
47
growth rate at 20°C was less than in usual condition as 30°C. Membrane lipids which are necessary for cell division wouldn’t be undergone. Changing FA composition by temperature is useful for manipulating lipid quality without gene modifying. In the aspect of industrial application, poly-unsaturated FAs are expected compound with profits. It is also known that concentration of CO2 affect FA composition (Tsuzuki et al., 1990). Meanwhile, the author
examined same experiments in C. reinhardtii, but that cells showed high sensitivity to the temperature. Therefore cells were extinct at 35°C and little growth at 20°C (data not shown). However recent study reported FA changing in C .reinhardtii by temperature (Yao et al., 2012).
There were no differences in TAG accumulating content of C .reinhardtii and C. kessleri under -S condition (Fig. 1-15b, c). However C. kessleri grew 3.5-fold as high as C. reinhardtii under -S condition, and it allowed high TAG produce ultimately (Fig. 1-15a, d). Thus, to produce TAG valuably, it is important that cell tolerance to environmental loads.
Applied technology using algae is limited by high cost such as light source, harvest, and water etc. Algae differ from large plants in that algae have problems to maintain and to remove water. Then, our laboratory developed culture methods using on cloth or paper with minimum medium named regular air drying (RAD) condition. The author examined the method in C.
reinhardtii to understand TAG accumulation. C. kessleri also cultured and reported by Shiratake
master thesis in 2012. As a result, C. reinhardtii was able to glow on glass-fiber filter as 6.0-fold at 48h in DCW. However, it was found that about 40-50% cell were died by microscopy observation (Fig. 1-18a). Comparing with C. kessleri (supplemental Fig.1-d), C. reinhardtii had high sensitivity to RAD stress. Although cell dying, TAG accumulating was also found under RAD conditions, and showed 37.9% at 72h (Fig. 1-18b). Thus, it is found that is possible for C.
reinhardtii to grow under RAD conditions, and it leads TAG accumulation. However, C. reinhardtii could not exhibit TAG accumulation completely because of high intolerable stress.
Actually, supplying culture medium from bottom permitted DCW increasing (Fig. 1-19a). It is difficult to figure out clearly that what RAD stress is. However, there were a few hints to help understanding. At first, RAD condition appeared to be complex stress with the both of dehydration and nutrient deficiency. Limiting water leads inhibition to essential metabolism in cells such as hydrolysis, or cell density stress by shortage of habitant space. Secondly, Fig. 1-19b indicated that nutrients are limiting factor to glow on filter but, it showed TAG accumulation. On the other hand, supplying H2O could enhance TAG content per TLs. These
48
method resolves water control such as temperature and necessity of strong container, and complex harvesting process.
- 49 -
Cells
Filter
Wet paper
Supplement Fig. 1-a. Model of RAD conditions (a), actual cultivating
situation (b), and harvest filters after dried (c). Keep the humidity more
than 99% in the box (see drip on lid in Fig. 1-b), and water source is
limited only from wet paper (except supplying H
2O).
a
- 50 -
TAP
TAP-S
Supplement Fig. 1-b. Starch staining in C.reinhardtii at 24h. Stroma starchs were observed in both of TAP
and TAP-S (brown triangles). Pyrenoid starchs were developed especially in TAP-S (purple triangles).
a
a
a
a
a
- 51 -
0
50
100
150
200
250
300
350
0
24
48
72
96 120
PLs- P PLs- S PLs- NTime (h)
PLs c
on
te
nt (μ
M)
- 52 -
Fig. 1-d. Lipid content in C.
kessleri under RAD
conditions (Shiratake and Sato et al., 2013). Total lipids
(TLs), dry cell weight (DCW). Values are averages ± SE
for three filters at the same term.
Time (h)
TAG/TLs
TLs/DCW
TAG/DCW
- 54 -
Table1-a. Fatty acid composition of polar lipids
in C. reinhardtii.
37.8
21.2
6.6
5.7
22.3
5.2
1.2
Lipid/TLs (%)
55
Chapter 2
56
2-1 IntroductionTAG was synthesized mainly in Kennedy pathway (Kennedy 1969)。This reaction goes acyl-translation to sn-1, 2, 3 positions in glycerol backbone. Diacylglycerol acyltransferase (DGAT) which is considered as limiting enzyme in this synthetic pathway, carries final step as acylation to sn-3 position of DAG. Two types of DGATs were found in many organisms called DGAT type 1 (DGAT1), and DGAT type 2 (DAGT2 or DGTT) (Turchetto-Zolet et al., 2011). In mammal and plant study about DGATs, designates characteristics of these two proteins. DGAT1 which includes 6 or more transmembrane domains, is membrane proteins (Cases et al., 1998). Using land plant, it was reported that DGAT1 expressed in various organs and cells widely, in In
Arabidopsis thaliana, DGAT1 genes sustain TAG content in seeds (Caboche et al., 1999, Zou et
al., 1999). DGAT2 is also membrane protein, in which 2 or 3 transmembrane domains are contained. Overexpression of DGAT2 from Umbelopsis ramannian increased TAG amount in
Glycine max, and Zea mays (Lardizaval et al., 2008, Oakes et al., 2011). Functional differences
between DGAT1 and DGAT2 is still not clear but studies on DGAT2 indicated that this enzyme may function in lipid developing organs such like seeds (Shockey et al., 2006,, Li et al., 2013). However, these enzymes concern OD formation, since both of these gene mutants in mice did not have any LDs (Harris et al., 2011). Other TAG synthetic proteins are also known. Cytosolic DGAT called DGAT3 was found in Arachis hypogea, and Arabidopsis thaliana (Saha et al., 2006, Vaistij et al., 2012). Acyl-CoA independent TAG synthesis, is allowed by phospholipid; diacylglycerol acyltransferase (PDAT). PDAT which translates acyl-fatty acid from sn-2 position of phospholipid such as PE and PC to sn-3 position in DAG, were reported in
Saccharomyces cerevisiae, Arabidopsis thaliana (Dahlqvist et al.,2000, Ståhl et al., 2004), and Chlamydomonas (Yoon et al., 2012). Moreover, interestingly, lipase which acts on thylakoid
lipid MGDG, translating FA was found in Chlamydomonas (Li et al., 2012).
57
2-2 Material and MethodsDGAT gene analysis and characterization
DGAT homologs in C. reinhardtii were picked up using BLAST in The National Center for Biotechnology Information (NCBI http://www.ncbi.nlm.nih.gov/), and Genome Net (http://www.
genome.jp/ja/) by from yeast (NP_014888.1, NCBI) and Arabidopsis (AT3G51520, KEGG).
Multiple alignment and phylogenetic tree were also drawn with CLUSTALW (http://www.
genome.jp/tools/clustalw/), BoxShade (http://www.ch.embnet.org/software/BOX_form.html),
and MOLECULAR EVOLUTIONARY GENETICS ANALYSIS ( MEGA , Tamura et al., 2011) prepared from http://www.megasoftware.net/.
Semi-quantitative determination of transcript levels by reverse transcriptase (RT)-PCR
Total RNA was extracted and purified by phenol–chloroform extraction, as described by Los et
al. (1997), and then used for cDNA synthesis by reverse-transcription with random primers
(Tabei et al., 2007). The cDNA synthesized was used as a template for semi-quantitative RT-PCR (Tabei et al., 2007). The forward (F) and reverse (R) primers used are summarized in supporting information Table S1. The primer sets for DGAT1 and DGTT1-4, GPDH1-3, and 18 rRNA were the same as those reported by Msanne et al. (2012), Herrera-Valencia et al. (2012), and Teramoto et al. (2002), respectively (see below). The primer sets for GPAT1, GPAT2, and
LPAAT were designed on the basis of their corresponding cDNA sequences (NCBI reference
58
Primer set5’→3’
Gene name Forward Reverse
DGTT1 GAAGCAGGTGTTTGGCTTCT CAGTGCCTCCGTGTAGGTCT
DGTT2 GCGCCGCAACATTTACATGG CAGCCGTACTCGGTCTTGTG
DGTT3 GTCAGAGCCAAGTGCTGGAC CCACCTCCTTGTCGAACTC
DGTT4 GCATGTTTGGGCAGTACGGC GCCTTGTGCTTGTCGTACAG DGAT1 ACTGGTGGAATGCGGCTAC TAGCAGCTCGTGGAACACAG GPAT GTGTGTTTGCCCATATGCTG CATCATGGGGTAGCTGAACA
GPAT9 CCTGTGGCCATCAAGTACAA AGATGTCGCACACCAGAGC
LPAT CGCCCTTCTACAAAGTCACG CTCACCCTCAGGGAAGAACA
59
2-3 ResultsDGATs in C. reinhardtii and its characteristics about amino acid sequences.
One DGAT1 and 5 DGAT2s (now called DGTTs in algae) were found in C. reinhardtii. DGTT1-4 protein lengths were 320-350 amino acids residue which is common in other DGAT2 proteins (table 2-1). Phylogenetic tree indicated that C. reinhardtii possess 3 grouped DGTTs. At first, DGTT1 which had 35% homology with DGA1 protein (Sorger et al., 2002) was belonged in the group of animals. DGTT4 which is the highest homology with atDGAT2 was in land plants group. Thirdly, DGTT2, 3, 5 made an original group as C. reinhardtii (Fig. 2-1). These DGTTs were predicted membrane protein as well as other DGAT2s (table 2-2, Fig. 2-2). However, there were differences in the number of transmembrane domains by tools. Regions of 41-63 residues were common, but TMHMM server didn’t recognized about 97-119、253-275 residues in DGTT1. Also seen in DGTT5, that is 124-146 and 150-171 regions were not included by TMHMM.
C. reinhardtii DGAT1 (crDGAT1) reserved well known DGAT1 motif HKWXXRHXYXP and active histidine residue (Fig. 2-3) (Mcfie et al., 2010). Former HKWXXRHXYXP binds DAG/phorbol (Oelkers et al., 1998). Multiple alignments of DGTTs supported as active DGAT2 protein possibility (Fig. 2-4). It was widely known that DGAT2 contain three motifs as YFP, HPHG, RXGFX(K/R)XAXXXGXXX(L/V) VPXXXFG(E/Q) (Liu et al., 2011). First YFP was reserved in DGTT1, 4, third proline (P) changes to lysine (K), histidine (H), asparagine (N) in DGTT2, 3, 5 respectively (Fig. 2-4). PH is important for DGAT2 activity in second HPHG residues, and almost of all organisms which have TAG contain this region (Liu et al., 2011). Animal second motif known as HPHG, but there are often found EPHS in plants. All DGTTs have PH residues but first residues were changed to phenylalanine, serine, cysteine. The half of third motif as RXGFX(K/R)XAXXXG highly accorded but latter XXX(L/V)VPXXXFG(E/Q), L/V was replaced to isoleucine (I) in DGTT2, 3, 5, besides DGTT3, 222 proline was changed to cysteine. Finally, DGTT1 and DGTT5 were not phenylalanine in 192 tyrosine and 274 methionine respectively.
Gene expression analysis in Kennedy pathway
DGATs and other acyl-transition enzymes in Kennedy pathway described as
glycerol-3-phosphate: acyltransferase (GPAT), and lyso-phosphatidic acid: acyltransferase (LPAAT), moreover phosphate dehydrogenase (GPDH) which gives glycerol-3-phosphate (G3P) from dihydroxyacetone phosphate (DHAP) in glycolysis. These 5 classes and 10 genes were investigated the expressions with RT-PCR. Results were shown in pictures and
60
increased clearly after 8h in -S and -N. Interestingly every genes detected in -S were more clearly than that of in -N. DGTT5 has not been detected. This result was according to other reports in -N (Msanne et al., 2012, Boyle et al., 2012). DAG synthesis in Kennedy pathway carried by GPAT1 and LPAAT was up-regulated under -S and -P but not -N. These genes code chloroplast localized protein with targeting peptide. GPAT2 which does not have targeting peptide, so that considered as cytosolic GPAT. This GPAT2 gene did not show any expression pattern changes. Finally, GPDH showed similar pattern to DGTTs, increasing in -S and -N.
61
atDGAT2 DGTT4 DGA1p length
atDGAT2 - 37 314 DGTT1 28 31 35 320 DGTT2 30 30 25 324 DGTT3 34 28 25 346 DGTT4 38 - 30 327 DGA1p 30 30 - 418
Protein sequence homology (%) Amino acid (aa) length
62
Fig. 2-1. Phylogenetic tree of DGAT type 2s (DGTTs) was described by MEGA software (Tamura et al., 2011) with maximum likelihood estimation. Amino acid sequences were prepared from NCBI (http://www.ncbi.nlm.nih.gov/) btDGAT2:
Bos Taurus (NP_991362.2). mmDGAT2: Mus musculus (NP_080660).
hsDGAT2: Homo sapiens (AAQ88896). ggDGAT2: Gallus gallus
(XP_419374.3). xtDGAT2: Xenopus tropicalis (NP_989372.1). mrDGAT2:
Umbelopsis ramanniana (Q96UY2.1). DGA1: Saccharomyces cerevisiae S288c
(NP_014888.1). otDGAT2: Ostreococcus tauri (XP_003083539.1). atDGAT2:
Arabidopsis thaliana (NP_566952.1). rcDGAT2: Ricinus communis (XP_002528531.1). jcDGAT2: Jatropha curcas (AEZ56254.1) DGTT:
63
type
helices
region
DGTT1 MEMBRANE PROTEIN 3 41-63,97-119,253-275
DGTT2 MEMBRANE PROTEIN 2 26-48,55-77
DGTT3 MEMBRANE PROTEIN 3 49-71,78-100,149-171
DGTT4 MEMBRANE PROTEIN 2 11-33,43-65
DGTT5 MEMBRANE PROTEIN 4 33-55,62-84,124-146,150-171