Introduction
Climate change is an urgent issue that requires immediate solutions. The specifi c heat of ocean water is about 4 times higher than that of air and the ocean mass is about 260 times larger than the atmospheric mass. The total heat capacity of the oceans is about 1,000 times the mass of the atmosphere. Therefore, a change in ocean heat content exerts a tremendous influence on the distribution of heat on Earth and eventually on changes in surface air temperature.
According to the Fourth Assessment Report (AR4)
[1]
of the Intergovernmental Panel on Climate Change (IPCC), “Observations since 1961 show that the average temperature of the global ocean has increased to depths of at least 3000 m and that the ocean has been absorbing more than 80% of the heat added to the climate system.” It also states, “the average temperature of the global ocean up to a depth of 700 m has risen 0.1ºC in the last few decades.” However, with regard to the circulation of deep waters, AR4 notes that “there is insuffi cient evidence to determine whether trends exist on MOC of the global Ocean.”
There are two kinds of large-scale and systematic ocean circulation. One of them is a wind-driven circulation, in which seawater near the ocean surface flows along a horizontal plane. For instance, the Kuroshio is part of the wind-driven circulation. The other is something like convection, which is driven by density differences due to varying seawater salinity and temperature and circulates in a vertical plane.
This is called meridional ocean circulation. The portion of the circulation reaching the deep ocean is called “Meridional Overturning Circulation (MOC).”
Meridional circulation plays a role transporting the oxygen, carbon dioxide and other substances dissolved in seawater on the sea surface to the ocean interior.
5
Trends in Observation and Research of Deep Ocean Circulation and Heat Transport
Takeshi K
AWANOAffi liated Fellow
1
For instance, if the circulation does not reach the deep ocean in the Sea of Japan due to warming, oxygen is not supplied to the deep waters, raising the possibility of threatening the ecosystem of bacteria and benthic life. Such a possibility has been reported in recent newspaper articles.
[2]Transport of carbon dioxide to the ocean interior influences the carbon dioxide absorption capacity of the ocean in a relatively long time scale.
Furthermore, the MOC, including deep ocean circulation, is believed to have been playing an important role in climate change. The seawater, around the Antarctic area by the MOC, is cooled due to the release of large amount of heat into the atmosphere and then sinks to deep waters, and transporting to the north in the bottom layer of the Ocean. That is to say, heat transport by MOC plays an important role in the global climate, as it heats the atmosphere near the poles. Therefore, a change in the circulation may be strongly related to relatively abrupt climate change.
More than 10,000 years ago, or during the period when warming was in progress due to the end of the glacial stage, there was what is called the Younger Dryas event, a period of abrupt climate change from a moderate interstadial phase to a cold stadial phase.
According to a widely held theory, this climate change was caused by a major change in the MOC.
A recent study suggests that the Atlantic meridional overturn circulation, which sinks to the ocean floor off Greenland, moves southward in the Atlantic intermediate and deep layer and then moves northward near the sea surface, may have slowed by about 30%
in the last 50 years. Since a research paper concerning
this possibility was published in Nature in 2005,
observation and research to investigate this slowdown
in details have been underway, prompted by concerns
that if the research result proved to be true it may
lead to rapid climate change (cooling, in this case).
Moreover, temperature increases in bottom layer have been observed in each ocean, suggesting a change in the circulation originating in Antarctica that sinks in the Antarctic area, moves northward in the depths of the oceans and then move southward in intermediate and deep layer before returning to Antarctica. These recent findings have raised awareness of the need to conduct research concerning changes in deep ocean circulation. This report describes in detail the need to study deep oceans and trends in domestic and international ocean researches, focusing on the direct impact on our living temperature of changes in the meridional overturning circulation, in particular, changes in the circulation that reaches the deepest part of the oceans.
Deep Circulation and Climate
2-1 Mechanism of Thermohaline Circulation
Because the earth is a sphere, the amount of heat that the earth’s surface receives from the sun is small in the north and south pole regions and large in the near-equatorial regions. On the other hand, the amount of heat that the earth radiates to space is less dependent on latitude. Therefore, regions at a northern or southern latitude of 40 degrees or less are always warmed up, while other regions closer to the Arctic or Antarctic are always cooled down. In circumpolar areas, because the seawater is cooled or frozen, heavy and high-salinity water is formed. In fact, heavy seawater is formed in the sea around the Antarctic Continent and off the coast of Greenland and it sinks
Indian subcontinent
Indian
OceanJava from the Pa
cifi c Ocean
Australia Australia
Red Sea Ove
rflow Water Red S
ea Overflow Wa ter (RSOW)
(RSOW )
Indian Ocean Deep Indian
Ocean Deep Water (IODW) Water (IODW)
Circumpolar Deep Circ
umpolar D eep Water (CDW) Water (C
DW)
Subantarctic Mode Subantarctic Mode Water (SAMW) Water (SAMW) Antarctic Intermediate Antarctic Intermediate Water (AAIW) Water (AAIW)
N orth Atlantic D eep N orth Atlantic Deep
Water (NADW) Water (NADW)
Antarctic Ocean Antarctic Ocean
Antarctica Antarctica
Upper Intermediate Water (UPPER IW) Upper Intermediate Wa
ter (UPPER IW)
Antarctic Intermediate Water (AAIW) Antarctic Intermediate Water (AAIW)
Upper Intermediate Water (UPPER IW) Upper Intermediate Wa
ter (UPPER IW)
Antarctic Circumpolar Antarctic Circ
umpolar Current (AAC) Current (AAC)
Indonesia Indonesia
Pacifi c Ocean
Aleutian Islands
N o r th P a cific D eep N o r th P a cific D eep Water (NPDW) Water (NPDW) Subantarctic Mode
Subantarctic Mode Water (SAMW) Water (SAMW) Circumpolar Deep
Circumpolar Deep Water (CDW) Water (CDW)
Circumpolar Deep Water (CDW )
Circumpolar Deep Wa ter (C
DW )
Circumpolar Deep Circump
olar D Water (CDW) eep Water (C
DW)
North Atlantic Deep Water (NADW) North A
tlantic D eep Wa
ter (NADW )
North Atlantic Deep Water (NADW)North Atlantic Deep Water (NADW)
Off GreenlandOff Greenland
Atlantic Ocean Atlantic Ocean
Vertical Mixing Vertical Mixing Antarctic Intermediate
Antarctic Intermediate Water (AAIW) Water (
AAIW) Subantarctic Mode Suban
tarctic Mode Water (SAMW) Water (SAMW)
Atlantic Overturn Atlantic Overturn
Arctic Bottom Water (AABW) Arctic Bottom Water (AABW)
Antarctic Overturn Antarctic Overturn
Source: Prepared by the STFC based on Reference[4] and data provided by Japan Agency for Marine-Earth Science and Technology Figure 1: Pattern Diagram of Thermohaline Circulation
The circulation that sinks in the North Atlantic Ocean and moves northward along the upper layer of water is called Atlantic overturn, and the circulation that sinks around the Antarctica area, moves northward along the bottom layers and then moves southward along the deep layer of water is called Antarctic overturn (which exists in the Pacifi c, Atlantic and Indian oceans). Although the sea surface temperature in low latitudes rises close to 30 degrees C, temperature in deep layer is about 1 degree C as seawater cooled near the poles is constantly supplied to the deep layer of the ocean.
2
as deep water. The seawater then travels in the sea, gets lighter due to mixing with surrounding seawater and geothermal heat, and then upwells toward the upper layer again.
This circulation is called “thermohaline circulation.”
It is a convection current that restores the heat balance between low latitudes and high latitudes by releasing the heat that seawater received in low-latitude regions to the atmosphere in high-latitude regions. It is a large-scale circulation in a meridional direction from the sea surface to the bottom and covers all oceans.
Therefore, it is also called “meridional overturn circulation.” Since the circulation reaches deep waters, this portion of the circulation is called “deep ocean circulation.” Figure 1 is a view showing the meridional overturning circulation identified as a result of the World Ocean Circulation Experiment (WOCE), which will be described later. It shows seawater circulation in the Pacific, Atlantic and Indian oceans, centering on the Antarctic.
[3]The seawater cooled in the Arctic or Antarctic fl ows into deep waters and circulates in the meridian planes of each ocean. Due to variations of strength of heating and salinity of seawater in the global Ocean, densities the of sinking water are different, resulting in complicated circulations with multiple routes at different depths. In Figure 1, the diagonal arrows show the flow of upper layer water, the white arrows show the fl ow of intermediate layer water, and the black arrows show the flow of deep water. Since the seawaters which drive the circulations can be characterized by their water temperature, salinity and dissolved matters, they are each given names as “water mass.” In one of the deep circulations which reaches the deepest layers in each ocean, seawater fl ows into the deepest layer in the Antarctic area and moves northward along the Pacifi c, Atlantic and Indian ocean floors and then flows southward through intermediate and deep layers. This is called Antarctic Overturn. The seawater which flows northward on the Pacific floor is called circumpolar deep water. While flowing northward on the Pacific floor, the circumpolar deep water gets lighter as it is mixed with surrounding seawater and warmed by geothermal heat. In the northern hemisphere, seawater sinks to the deep waters off Greenland, fl ows southward through the intermediate and deep layers of the ocean and then fl ows to the upper layer northward.
This is called the Atlantic Overturn. In the Atlantic Ocean, there is also Antarctic overturning circulation,
in which seawater sinks in the Antarctic area and fl ows along the deepest layer of the Ocean northward.
The seawater gets gradually lighter as in the Pacific Ocean and moves in the intermediate and upper layers of the ocean southward.
2-2 Influence of Thermohaline Circulation on Climate
The findings from ocean observations related to climate change in IPCC 4
threport can be summarized as follows.
- The improvement of observations networks has made it possible to detect changes in water temperature and sea level with more accuracy.
- The average temperature of the global ocean has increased to depths of at least 3000m and the ocean has been absorbing more than 80% of the heat added to the climate system.
- The average temperature of the global ocean shallower than 700m has risen 0.1ºC in the last few decades.
- Sea level rose 1.8mm/year during the period from 1961 to 2003 and 3.1mm/year during the period from 1993 to 2003. About half of the rise posted during the 1993-2003 period was due to thermal expansion.
- Salinity in seawater is decreasing in mid- and high- latitudes and increasing in low latitudes. This suggests a change in the relationship between precipitation and evaporation.
As seen above, knowledge on changes in the shallow layer of the ocean has been built up. On the other hand, AR4 states, “there is insufficient evidence to determine whether trends exist on MOC (meridional overturn circulation) of the global ocean.” Still, it is clear that the MOC has a major infl uence on climate change. In particular, the formation of deep water in the polar region plays an important role in maintaining relatively moderate climates in the polar region, as the ocean, when seawater is cooled, releases vast amounts of heat and warms the air.
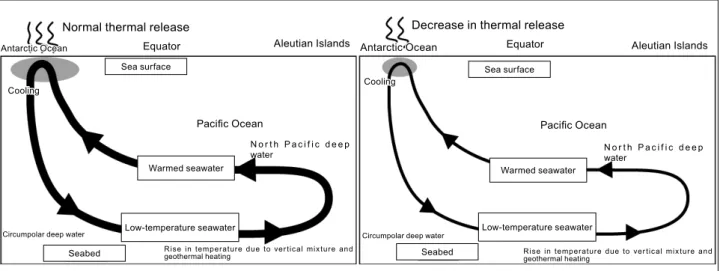
Figure 2 shows pattern diagrams of the MOC’s
climate-maintaining role in high latitudes by using
the meridional circulation which reaches the depths
of the Pacifi c Ocean in Figure 1. The seawater cooled
in the Antarctic area gets heavy, begins to sink and
moves on northward in the bottom of Pacific. Then,
the seawater is modified by geothermal heating and
through mixture with seawater directly above it
(vertical mixing) and gets lighter due to a rise in water temperature, and returns to the intermediate and upper layers of the Pacifi c Ocean. It then releases heat to the atmosphere in the Antarctic area, that is to say, it is cooled again, and sinks. This circulation warms up the atmosphere as if it were the coolant of an air conditioning appliance.
When the circulation weakens, the heat transport to the Antarctic area decreases, and then the heat release to the atmosphere reduce. For this reason, if the temperature of the ocean in the Antarctic area rises due to global warming, for instance, the difference between temperature of the ocean
And atmosphere decreases and the release of heat to the atmosphere decreases. That is to say, the cooling of the ocean weakens and it is expected to lead to the weakening of the circulation. This change in temperature directly causes a change in the MOC- related heat transport system. At the same time, a change in the ocean interior can cause a change in the heat transport which is important for the maintenance of climate in high latitudes. For instance, if salinity of seawater near the ocean surface decreases due to a change in the properties of water mass or an increase in fresh water inflow, the density of the seawater decreases drastically. In such a case, it reduces the amount of sinking water and weakens the circulation, resulting in reducing the ocean’s heat release.
Because such processes are involved, deep water circulation is one of the factors determining meridional diffenece in of climate and heat balance on the earth. Deep water circulation moves slowly on a time scale of several hundred years. However,
once a change in the circulation begins to affect the atmosphere through a change in heat release, it causes a climate change on a time scale of several decades.
Therefore, a change in deep water circulation may be directly related to a large climate change.
For instance, if the amount of sinking seawater decreases or the speed of the circulation drops in the Antarctic area or off Greenland, it may reduce atmosphere heating in high latitudes, causing a drastic cooling of the climate in wide areas. Paleoclimate records suggest that such changes occurred in the past.
One such example is the Younger Dryas, the period of an abrupt decline in temperature after the end of the interstadial period 10,000 years ago, when warming was in progress.
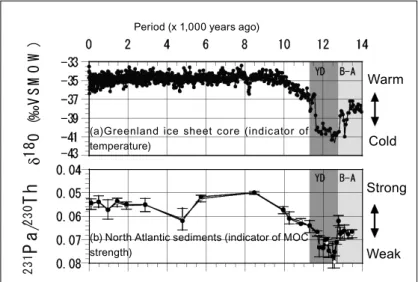
Figure 3 shows the results of analyses of indicators showing past temperatures and circulations from gases contained in ice sheets and radioactive nuclides contained in seabed sediments. There are three isotopes of oxygen with each having atomic number 16, 17 or 18. When the temperature is low, more water molecules with smaller atomic number vaporize. When an ice sheet is formed in the process of evaporation, condensation and precipitation, the isotope ratio of heavier oxygen (δ
18O) is small during precipitation, if the temperature is low. Therefore, the oxygen isotope ratio becomes a barometer indicating temperature.
Figure 3 (a) shows changes in past temperature reproduced from the oxygen isotope ratio ( δ
18O) in the core of ice sheets extracted in Greenland.
[4]It shows that although warming was progressing gradually during the interstadial period, which is called the Bolling-Allerod Period (B-A in Figure 3), temperature dropped sharply and kept declining for more than
Prepared by the STFC Figure 2: Pattern Diagram of MOC of the Pacifi c Ocean
Normal thermal release Decrease in thermal release
Antarctic Ocean
Antarctic Ocean Equator
Aleutian Islands Antarctic Ocean
Antarctic Ocean Equator Aleutian Islands
Sea surface
Cooling Cooling Cooling
Cooling
Circumpolar deep water
Sea surface
Warmed seawater Warmed seawater
Low-temperature seawater Low-temperature seawater
Seabed
N o r t h P a c i f i c d e e p
water N o r t h P a c i f i c d e e p
water
Pacifi c Ocean Pacifi c Ocean
Seabed Rise in temperature due to ver tical mixture and
geothermal heating Rise in temperature due to ver tical mixture and
geothermal heating Circumpolar deep water
1,000 years (YD in Figure 3). This period is called the Younger Dryas.
This change occurred on a time scale of several decades and it is believed that the temperature dropped more than 5ºC in the northern hemisphere during this period.While the IPCC AR4 states that the temperature rose 0.74ºC during the period from 1906 to 2005. According to numerical model simulations of temperature changes up to the end of the 21
stcentury, the temperature will rise about 4ºC in the worst case scenario (high-growth society scenario focused on fossil energy resources) and about 1.8ºC in the best case scenario (sustainable-growth society scenario).
Compared with these projections, the temperature change during the Younger Dryas period was rapid and drastic.
Protactinium (
231Pa) and thorium (
230Th) are both uranium series radionuclides and their production per unit time in seawater is considered to have been constant throughout the ages. However, due to differences in their adsorption properties, their residence time in seawater is different – about 200 years in the case of
231Pa and about 40 years in the case of
230Th. As a particle with longer residence time tends to be horizontally transported by advection, when the
231Pa/
230Th ratio becomes large, the advection velocity becomes slow. Although the speed cannot be calculated, the ratio is used as an indicator of circulation speed. Figure 3 (b) shows the strength of deep water circulation reproduced by analyzing North Atlantic sediments and by using this indicator.
[5]As Figure 3 (b) shows, the deep ocean circulation in the
Younger Dryas period of about 12,000 years ago was weak.
The cause of the weakened overturning circulation is postulated to be the outburst of freshwater into the ocean from a glacial lake (Lake Agassiz) in Canada which was triggered by the melting of continental ice sheets due to warming, making seawater light and thus reducing seawater sinking. This weakening of the deep ocean circulation that was providing heat to high latitudes is widely believed to have caused a decline in temperature in high latitudes (Figure 3 (a)).
Observation Results Suggesting Changes in Deep Sea Circulation
Although IPCC AR4 states that changes in the MOC “cannot be assessed with confi dence,” there are recent observation results suggesting the weakening of deep sea circulation both in the Atlantic Overturn and the Antarctic Overturn. Some of the representative observation results will be outlined in this section.
3-1 Weakening of the Atlantic Overturn
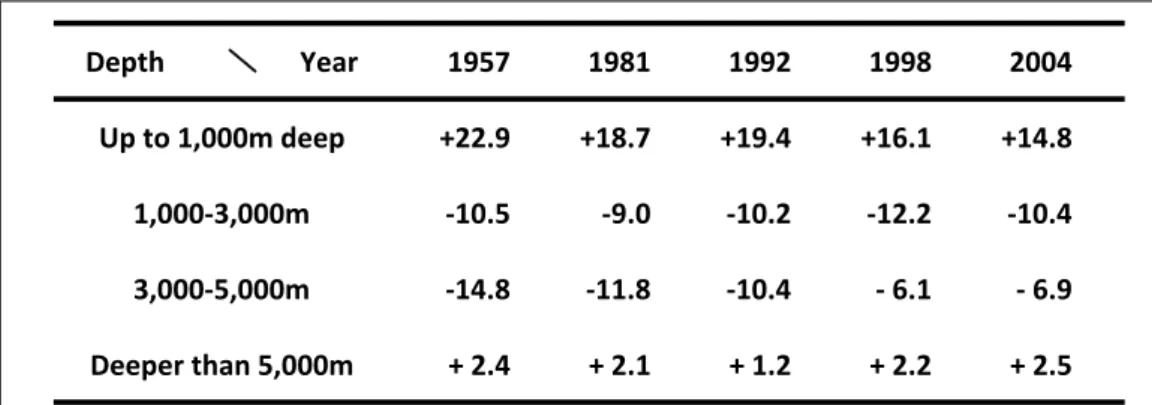
H.L. Bryden et al. announced in the magazine Nature
[3]that the Atlantic overturning circulation has weakened about 30% in the last 50 years, based on 5 separate ship-based observations conducted at 25° north in the Atlantic Ocean in 1957, 1981, 1992, 1998 and 2004 under the World Ocean Circulation Experiment (WOCE) and the Climate Variability and Predictability Project (CLIVAR).
Table 1 shows changes in the volume of flow at D : 2 0 6 9 ͙ 2
D 3
K 7
Period (x 1,000 years ago)
Warm
Strong Cold
Weak
(a)Greenland ice sheet core (indicator of temperature)
(b) North Atlantic sediments (indicator of MOC strength)
Source: Prepared by the STFC based on References[5,6] and data provided by the Japan Agency for Marine-Earth Science and Technology
Figure 3: Relation between Circulation Strength and Temperature Reproduced from Paleoclimate Records
3
latitude 25° north, with positive figures indicating northward flow. The sea area at latitude 25° north in the Atlantic Ocean is the northern one-third of the Atlantic Ocean in Figure 1. As Figure 1 shows, seawater flows northward in the sea up to 1,000m deep as part of the Atlantic overturn, flows near the ocean bottom northward in the sea deeper than 5,000m as part of the Antarctic overturn, and flows southward in the sea in-between. For instance, the volume of fl ow in the water up to 1,000m deep, which was 22.9×10
6m
3/s in 1957, decreased to 14.8×10
6m
3/ s in 2004. However, some people disagreed with this finding, prompting new research in the United State and European countries, which will be described in Section 4.
3-2 Weakening of the Antarctic Overturn
Fukasawa et al. discovered bottom water warming in the North Pacifi c Ocean
[7]and later it was revealed that bottom water was warmed across the Pacific Ocean.
[8]Figure 4 shows changes in the amount of heat in waters from a depth of 5,000m to the sea bottom. This is the results of analyses of data on “the international collaborative studies on the clarification and the overall observation system of ocean circulation” and “Subarctic Gyre Experiment (SAGE) in the North Pacific Ocean” and data obtained in ship-based observations conducted in and after 1990 under the framework of “World Ocean Circulation Experiment” and “Climate Variability and Predictability Project.”
Figure 4 shows normalized estimates of decadal changes in heat content in the Pacific Ocean areas segmented by survey lines and lands.
[9]Darker colors indicate larger increases in heat content. Figure 4 shows that the heat content increased in the deep layer over almost the entire Pacifi c Ocean. The heat content decreased in the northeastern Pacifi c but the decrease is minimal. The increase in heat content is large in the Antarctic area, where deep water is formed, and along the pathway of lower circumpolar deep water in the Pacifi c Ocean (arrow line) A numerical model analysis revealed that this large increase in heat content, is due to a decrease in the amount of deep water formed in the Antarctic area. Furthermore, it is inferred that the decrease in deep-water formation is due to a decrease in seawater cooling caused by a decrease in air-sea heat fl ux off the Adelie Coast of Antarctica (longitude 140°~150°E). Figure 4 suggests that the impact of a
change in the formation of circumpolar deep water reaches the North Pacific in about 40 years.
[10]Such an increase in heat content in the deep layer has also been discovered in the South Pacific and the Indian Ocean
[11,12]and the increases are large in the Antarctic area, suggesting the weakening of the entire Antarctic overturn.
Although changes in deep-water heat content are not quantitatively assessed in IPCC AR4, recent observation results provide estimates of heat-content changes worldwide, including the deep layers of oceans, in an integrated manner. As a result, it has been pointed out that the heat-content in the deep layer, even at a depth of more than 3,000m, has increased in almost all ocean and that the increase may be equivalent to 5~30% of the heat-content increases in waters up to 700~800m mentioned in the IPCC AR4.
[13]Trends in Observation and Research of Deep Waters
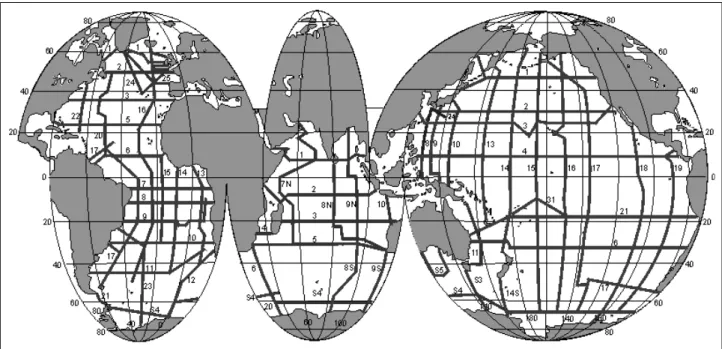
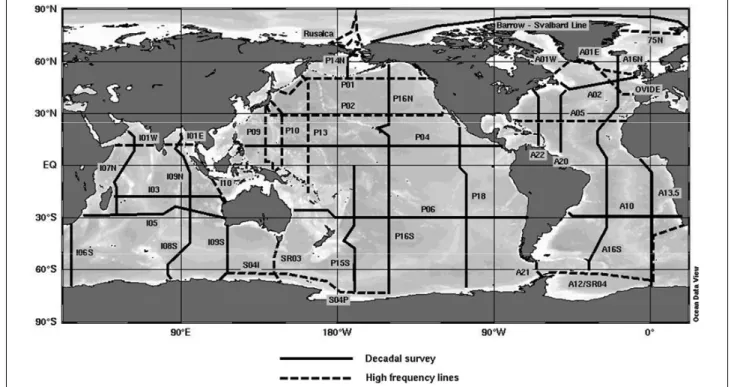
4-1 International observation and research 1)World Ocean Circulation Experiment (WOCE) From 1990 to 1998, as part of the World Climate Research Program (WCRP), the World Ocean Circulation Experiment (WOCE) was implemented to collect the data necessary to develop models that are capable of describing the present state of the ocean and predict its evolution. The project was participated in by more than 30 countries, in addition to Japan, the United States, United Kingdom and other advanced countries. During the period from 1990 to 1998, The highest-accurate observations were carried out from the surface to the bottom along zonal and meridional trans-ocean sections. Each survey line is given a name comprised of a letter and number, with P standing for Pacifi c Ocean, A for Atlantic Ocean, I for Indian Ocean and S for Southern Ocean. These survey lines have come to be used as reference lines for the development of large-scale ocean observation plans.
WOCE made a list of essential measurement items, including water temperature, salinity, dissolved oxygen and nutrients (phosphate, nitrite, silicate), and prepared a manual to provide guidelines for setting a goal for measurement accuracy for each item and obtaining the best measurement accuracy.
[15]WOCE also prepared guidelines concerning the contents of
4
observation reports, requiring the persons responsible for each observation item to describe the accuracy of their observation and how they estimated the accuracy by specifying observation and analysis methods.
2)Climate Variability and Predictability Project (CLIVAR)
A plan to implement the Climate Variability and Predictability Project, which is aimed at studying climate variability and predictability on seasonal, decadal and centennial time-scales, was formulated in 1998 and the 15-year project is under way until 2013.
The mission of CLIVAR is to extend WOCE research results by updating the knowledge on the amount of ocean heat and freshwater transport obtained from WOCE, monitoring and studying ocean changes on decadal or shorter time scales, and providing data to evaluate climate system models. To that end, re-observation of the WOCE survey lines in Figure 5 was proposed and some of the lines were carried out. And the analysis of the observation results led to the discoveries of the possibility of Atlantic overturn weakening and the rises in deep water temperature in each ocean described in Section 3.
Depth
䇭䇭䇭䌜䇭䇭Year 1957 1981 1992 1998 2004
Upto1,000mdeep +22.9 +18.7 +19.4 +16.1 +14.8
1,000Ͳ3,000m Ͳ10.5 Ͳ9.0 Ͳ10.2 Ͳ12.2 Ͳ10.4
3,000Ͳ5,000m Ͳ14.8 Ͳ11.8 Ͳ10.4 Ͳ6.1 Ͳ6.9
Deeperthan5,000m +2.4 +2.1 +1.2 +2.2 +2.5
*indicatesnorthwardflowand䋭indicatessouthwardflow.Theunitisinm
3/s.
Prepared by the STFC based on Reference[3]
Table 1: Results of Flow Observations in Pacifi c Ocean at Latitude 25°N
Prepared by the STFC based on Reference[9]
Figure 4: Normalized Values of Decadal Changes of Heat Built Up in Waters from the Depth of 5,000M to the Bottom during the 1990s to 2000s The value in each box represents changes in heat content (W/m2). The arrow shows the pathway of circumpolar deep water that sinks in the Antarctic area and fl ows northward along the bottom of the Pacifi c Ocean.
Since the research activities covered by CLIVAR include study on anthropogenic climate changes, an emphasis is placed on the observation of ocean carbon dioxide when the WOCE survey lines are re- observed. In order to contribute to the promotion of research by conducting observations without overlaps and collecting and disclosing research data, the International Ocean Carbon Coordination Project (IOCCP) was established and the IOCCP has been promoting exchanges of information on observation plans and disclosure of data mainly via the Internet in close cooperation with CLIVAR.
3)Global Ocean Ship-based Hydrographic Investigations Panel (GO-SHIP)
In 2007, the Global Ocean Ship-based Hydrographic Investigations Panel (GO-SHIP) was established by groups of researchers conducting ship-based observations under CLIVAR or IOCCP. GO-SHIP has set the following objectives:
- Understanding the controls and distribution of natural and anthropogenic carbon and biogeochemistry in the ocean interior
- Understanding ocean changes below 2 km and their contributions to global heat and sea-level budgets - Understanding the variability in water masses,
ventilation, and pathways - Quantifying transports - Evaluating ocean models
GO-SHIP selected survey lines necessary to achieve these goals from among WOCE survey lines
and divided them into those requiring observation with precision about once every 10 years and those requiring observation with higher frequency (see Figure 6). It also set necessary observation items and revised the manual on measuring methods and put them together as GO-SHIP’s observation strategy. In order to make this strategy a part of comprehensive ocean observation strategies, a resolution was adopted to promote the cooperation of the Ocean Observations Panel for Climate (OOPC) and the International Ocean Carbon Coordination Project (IOCCP) at the 3
rdmeeting of the Joint WMO(1)- IOC(2) Technical Commission for Oceanography and Marine Meteorology (JCOMM) in September 2009.
Furthermore, the resolution was introduced at the 43
rdsession of the IOC Executive Council in June 2010 and supported by the Executive Council.
4)Research on Meridional Circulation in the Atlantic Ocean
In January 2007, the U.S. National Science and Technology Council’s Joint Subcommittee on Ocean Science and Technology (JSOST) developed its Ocean Research Priorities Plan (ORPP). This plan identifi ed Atlantic Meridional Overturning Circulation (AMOC) and its relationship to sudden climate change as one of four research priorities. In response to the ORPP, a U.S.
inter-agency team was formed supported by the U.S.
Prepared by the STFC based on Reference[14]
Figure 5: WOCE Survey Lines Used as World Standard
(1) WMO: World Meteorological Organization (2) IOC: Intergovernmental Oceanographic
Commission
CLIVAR Offi ce. The team has worked out an AMOC implementation plan from the aspects of observation, impact, data integration and predictability.
Meanwhile, in Britain, the National Environment Research Council has been conducting a research project called Rapid Climate Change (RAPID) to investigate the relationship between the Atlantic overturning circulation and climate change since 2001.
In 2008, the project was changed to RAPID-WATCH, which is aimed at collecting a decade-long (2004- 2014) time series of observation data on the Atlantic Meridional Overturning Circulation in collaboration with the Hadley Centre in the U.K.
5)Observation in the Southern Ocean
In 2006, a workshop concerning the establishment of a Southern Ocean observing system was held with the support of the Scientific Committee on Antarctic Research (SCAR), raising awareness of the importance of Southern Ocean observation. In 2010, researchers from Britain, the United States and Australia developed a Southern Ocean Observing System (SOOS) plan, a comprehensive program concerning Southern Ocean observation. The plan addresses the following six challenges.
(a)The role of the Southern Ocean in the planet’s heat and freshwater balance
(b)The stability of the Southern Ocean overturning circulation
(c)The role of the ocean in the stability of the Antarctic ice sheet and its contribution to seal-level rise (d)The future and consequences of Southern Ocean
carbon uptake
(e)The future of Antarctic sea ice
(f)The impacts of global change on Southern Ocean ecosystems
In them, (a), (b) and (d) are closely related to the observation and research of ocean overturning circulation. The SOOS also suggests necessary observation variables and the most appropriate platform (ship, fl oat, etc.) to address the 6 challenges.
In particular, with regard to ship-based observations, the SOOS is expected to conduct re-observations of the WOCE observation lines in collaboration with GO-SHIP.
4-2 Deep Ocean Observation in Japan
1) International collaborative studies on the clarifi cation and the overall observation system of ocean circulation
From 1990 to 1994, “international collaborative studies on the elucidation of Ocean, circulation and
Source: Reference[16]
Figure 6: Survey lines Drawn by GO-SHIP
The solid lines represent sections requiring a decadal survey and the dotted lines represent sections requiring survey with higher frequency[16]
global observing system” was held as a project covered by the special coordinated funds for promoting science and technology. The project was attended by researchers from such institutions as the University of Tokyo, Tokai University, the Meteorological Agency, the Fisheries Agency, the Hydrographic Department of the Japan Coast Guard, and the Japan Marine Science and Technology Center. Under the framework of this project, Japan joined the WOCE and conducted observation of P2 line (30 ° N in the Pacifi c Ocean), P9 line (137 ° E), P13 (165 ° E) and P24 (off Kyushu) of the WOCE’s observation lines.
Although the science and technology promotion subsidy was terminated in 1996, the Fisheries Agency, the Japan Coast Guard and the Japan Marine Science and Technology Center conducted observation of P8 (130 degrees east longitude), using their recurring research funds.
2) Joint International Research on North Pacific Subpolar Gyre and Climate Change
From 1997 to 2001, “Joint International Research on North Pacific Subpolar Gyre and Climate Change”
was held with the aim of contributing to CLIVAR. In the institutions participating in this research project, the Fisheries Agency, the Japan Marine Science and Technology Center and the University of Tokyo conducted re-observations of WOCE observation line P1 (47 ° N in the Pacifi c Ocean) and P17 (off Alaska) as part of CLIVAR.
3) Independent Research by Individual Institutions Although no large comprehensive funds have been available in Japan since 2002, individual research institutes have been conducting independent research using their ordinary research funds. The Japan Agency for Marine-Earth Science and Technology and the Meteorological Agency conducted re- observations of P6 (32 ° S in the Pacifi c Ocean), A10 (32 ° S in the Atlantic Ocean), I3/4 (20 ° S in the Indian Ocean), P10 (149 ° E), P3 (24 ° N in the Pacifi c Ocean), P1 (47 ° N in the Pacifi c Ocean), P9 (137 ° E), P14 (179 ° E), and P21 (17 ° S). By further analyses of the results from observations conducted since 1990 under projects covered by special coordinate funds for promoting science and technology, Japanese researchers have published scientifi c papers in 2004, 2006 and 2010, to describe the discoveries of temperature increase in the deep layer of the Pacifi c Ocean and the possibility of
the weakening of the meridional overturn circulation that were described in Section 3.
[7-10]4-3 Problems Involved in Japanese Deep-Ocean Observing System
Monitoring of changes in the circulation of deep waters requires large-scale, long-term research, it is effective to use ships for ocean observation from the surface to the bottom under international cooperation.
However, the progress of ship-based observations has been slow worldwide. Various implementation plans for ocean observation aimed at building a sustainable climate observing system have been drafted by the Global Climate Observing System (GCOS), an international institution co-sponsored by the Intergovernmental Oceanographic Commission (IOC), the World Meteorological Organization (WMO), the United Nations Environment Program, and the International Council for Scientific Unions (ICSU)
[17]. However, according to a report published in 2009, the accomplishment rate of repeat hydrographic observation stayed at 62%.
[18]In Japan, some universities, independent administrative organizations, the Meteorological Agency and the Fisheries Research Agency own ocean observation ships. As described in Chapter 4, Japan was engaged in WOCE and other international observation activities through various organizations established with Science and Technology Promotion & Coordination funds in the 1990s. However, such funds are no longer available.
Therefore, research on deep ocean circulation in Japan is being undertaken only by academic institutions and individual laboratories as their ordinary research projects. It is diffi cult for individual institutions to engage in international research programs by effectively using a research vessel.
Although a group of volunteers has established the Japan Repeat Hydrography Implementation Group, a contact point to implement the GO-SHIP strategy described earlier, in 2009, it is weak in terms of size and sustainability. These problems were pointed out in a recommendation made by the Scientists Committee of the Science Council of Japan on March 17, 2010. The recommendation, which is titled
“Large-scale Academic Facility Plan/Large-scale
Research Program – Design/Promotion Measures and
Preparation of Master Plan -”,
[19]points out that it is
urgent for Japan to “implement ‘large-scale research
plans’ aimed at supporting large academic fi elds, such
References
[1] Summary for Policymakers of the IPCC Report “Climate Change 2007 Synthesis Report,” Japanese language version
[2] “Lack of Oxygen in the Deep Part of the Japan Sea,” Mainichi Shimbun, Sept. 14, 2010 Morning edition page 26
[3] H.L. Bryden et al., Slowing of the Atlantic meridional overturning circulation at 25 ゜ N, Nature 438, 655-657, 2005
[4] W.J. Schmitz, Jr., On the World Ocean Circulation: Volume II, Woods Hole Oceanographic Institution Technical Report, WHOL 96-08, 238pp, 1996
[5] P.M. Grootes et al., Comparison of oxygen isotope records from the GISP Greenland ice cores, Nature 366, 525-554, 1993
[6] J.F. McManus et al., Collapse and rapid resumption of Atlantic meridional circulation linked to deglacial climate changes, Nature 428, 834-837, 2004
[7] M. Fukasawa et al., Bottom water warming in the North Pacifi c Ocean. Nature, 427, 825-827, 2004
[8] T. Kawano et al., Bottom water warming along the pathway of lower circumpolar deep water in the Pacifi c Ocean. Geophysical Research Letters. 33, L23613, doi:101029/2006GL027933. 2006
[9] T. Kawano et al., Heat content change in the Pacifi c Ocean between the 1990s and 2000s. Deep-Sea Res. Part II, 57, 1141-1151, 2010
[10] S. Masuda, et al., Simulated rapid warming of abyssal North Pacifi c waters, Science 329, 319-322, 2010 [11] G.C. Johnson and S.C. Doney. Recent western South Atlantic bottom water warming. Geophysical Research as long-term monitoring, large-scale data collection,
wide-ranging database and large-scale data libraries, and realizing the future academic prosperity of Japan by organizing a group of researchers in wide-ranging fields, including life science and geoenvironmental science.” The research of the meridional overturning circulation is an important component of the master plan which aims at creating “programs of integrated observation, experiment and modeling of the global environment for future prediction.”
The current ship-based hydrographic survey is in a severe state. For instance, the Meteorological Agency has retired three of its fi ve observation ships in 2010.
Other institutions are also anticipated to reduce the operating days of their research vessels due to severe fi scal conditions. Under such circumstances, fi rst, it is important to create a framework for all-Japan efforts in order to realize large-scale research essential for the study of global climate change, such as the meridional overturning circulation, and the preparation of measures to respond to and alleviate the situation, and then promote research in collaboration with other countries.
Conclusion
Changes in the meridional overturn circulation
could be strongly related to relatively abrupt climate change. In Europe and the United States, international research programs aimed at understanding changes in deep ocean circulation have been under way, prompted by concerns that the weakening of the Atlantic overturn may lead to abrupt cooling.
Meanwhile, there are also research fi ndings pointing to the possibility of the weakening of the Antarctic overturn. Although mitigation and adaptation tends to draw attention recently in the fi eld of climate change study, it does not mean that the monitoring of climate change has lost its importance. Rather, the knowledge obtained from monitoring research is essential for developing measures against climate change.
However, observation and research to detect climate change is insuffi cient worldwide. In particular, Japan needs to overhaul its observation system and promote research in collaboration with other countries.
Acknowledgment
This report was prepared with the cooperation of Dr. Masao Fukasawa, research director at the Japan Agency for Marine-Earth Science and Technology (JAMSTEC), Dr. Naomi Harada, of JAMSTEC, Dr.
Shinya Kouketsu of JAMSTEC, and Mr. Tomimasa Doi, of JAMSTEC.
5
Letters. 33(14), L14614, doi:101029/2006GL026769. 2006
[12] G.C. Johnson et al., Warming and freshening in the abyssal southeastern Indian Ocean. J. Climate, 21 (20), 5351-5363, 2008
[13] S. Kouketsu et al., Deep ocean heat-content changes estimated from observation and reanalysis data and their infl uence on seal level change, submitted
[14] http://www.clivar.org/carbon_hydro/hydro_table.php
[15] WOCE Operations Manual, http://whpo.ucsd/edu/manuals.html [16] http://www.go-ship.org/Docs/cwp2A09.pdf
[17] International Plan for the Global Observing System for Climate in support of the UNFCCC, GCOS -92.
“WMO/TD No. 1219, 2004
[18] http://www.earthobservations.org/documents/committees/stc/200909_11thSTC/072_Taskrpt_Dexter.pdf [19] http://www.scj.go.jp/ja/info/kohyo/pdf/kohyo-21-t90-2pdf
Takeshi KAWANO Affi liated Fellow
Program director, Research Institute for Global Change, Japan Agency for Marine-Earth Science and Technology
http://www.jamstec.go.jp/rigc/j/occrp/index.html
Dr. Kawano specializes in oceanology. He is engaged in research to shed light on marine environmental changes. He is researching deep water warming and changes in the Antarctic overturn. He is a visiting professor at the Graduate School of Frontier Sciences, the University of Tokyo.