M
ul t i - poi nt m
eas ur em
ent us i ng t w
o- c hannel
r ef l ec t om
et er w
i t h ant enna s w
i t c hi ng f or s t udy
of hi gh- f r equenc y f l uc t uat i ons i n G
AM
M
A 10
著者
I kez oe R. , I c hi m
ur a M
. , O
kada T. , I t agaki J . ,
H
i r at a M
. , Sum
i da S. , J ang S. , I z um
i K. ,
Tanaka A. , Yos hi kaw
a M
. , Kohagur a J . , Sakam
ot o
M
. , N
akas hi m
a Y.
j our nal or
publ i c at i on t i t l e
Revi ew
of s c i ent i f i c i ns t r um
ent s
vol um
e
88
num
ber
3
page r ange
033504
year
2017- 03
権利
Thi s ar t i c l e m
ay be dow
nl oaded f or per s onal
us e onl y. Any ot her us e r equi r es pr i or
per m
i s s i on of t he aut hor and AI P Publ i s hi ng.
The f ol l ow
i ng ar t i c l e appear ed i n Rev. Sc i .
I ns t r um
. 88, 033504 ( 2017) and m
ay be f ound at
ht t p: / / ai p. s c i t at i on. or g/ doi / abs / 10. 1063/ 1. 497
8323.
U
RL
ht t p: / / hdl . handl e. net / 2241/ 00146041
Multi-point measurement using two-channel reflectometer with antenna switching
for study of high-frequency fluctuations in GAMMA 10
R. Ikezoe, M. Ichimura, T. Okada, J. Itagaki, M. Hirata, S. Sumida, S. Jang, K. Izumi, A. Tanaka, M. Yoshikawa, J. Kohagura, M. Sakamoto, and Y. Nakashima
Citation: Review of Scientific Instruments 88, 033504 (2017); doi: 10.1063/1.4978323 View online: http://dx.doi.org/10.1063/1.4978323
View Table of Contents: http://aip.scitation.org/toc/rsi/88/3
Published by the American Institute of Physics
Articles you may be interested in
Study of hydrogen ECR plasma in a simple mirror magnetic trap heated by 75 GHz pulsed gyrotron radiation
Review of Scientific Instruments 88, 033503033503 (2017); 10.1063/1.4978278
Design of a 75–140 GHz high-pass printed circuit board dichroic filter
Review of Scientific Instruments 88, 034704034704 (2017); 10.1063/1.4977935
Chemical aerosol Raman detector
Review of Scientific Instruments 88, 033107033107 (2017); 10.1063/1.4977725
Fast, precise, and widely tunable frequency control of an optical parametric oscillator referenced to a frequency comb
Review of Scientific Instruments 88, 033101033101 (2017); 10.1063/1.4977049
Techniques for precise energy calibration of particle pixel detectors
Review of Scientific Instruments 88, 033301033301 (2017); 10.1063/1.4978281
Electron energy loss spectroscopy with parallel readout of energy and momentum
REVIEW OF SCIENTIFIC INSTRUMENTS88, 033504 (2017)
Multi-point measurement using two-channel reflectometer with antenna
switching for study of high-frequency fluctuations in GAMMA 10
R. Ikezoe,a) M. Ichimura, T. Okada, J. Itagaki, M. Hirata, S. Sumida, S. Jang, K. Izumi, A. Tanaka, M. Yoshikawa, J. Kohagura, M. Sakamoto, and Y. Nakashima
Plasma Research Center, University of Tsukuba, Tsukuba 305-8577, Japan
(Received 5 July 2016; accepted 25 February 2017; published online 16 March 2017)
A two-channel microwave reflectometer system with fast microwave antenna switching capability was developed and applied to the GAMMA 10 tandem mirror device to study high-frequency small-amplitude fluctuations in a hot mirror plasma. The fast switching of the antennas is controlled using PIN diode switches, which offers the significant advantage of reducing the number of high-cost microwave components and digitizers with high bandwidths and large memory that are required to measure the spatiotemporal behavior of the high-frequency fluctuations. The use of two channels rather than one adds the important function of a simultaneous two-point measurement in either the radial direction or the direction of the antenna array to measure the phase profile of the fluctuations along with the normal amplitude profile. The density fluctuations measured using this system clearly showed the high-frequency coherent fluctuations that are associated with Alfv´en-ion-cyclotron (AIC) waves in GAMMA 10. A correlation analysis applied to simultaneously measured density fluctuations showed that the phase component that was included in a reflected microwave provided both high coherence and a clear phase difference for the AIC waves, while the amplitude component showed neither significant coherence nor clear phase difference. The axial phase differences of the AIC waves measured inside the hot plasma confirmed the formation of a standing wave structure. The axial variation of the radial profiles was evaluated and a clear difference was found among the AIC waves for the first time, which would be a key to clarify the unknown boundary conditions of the AIC waves.Published by AIP Publishing.[http://dx.doi.org/10.1063/1.4978323]
I. INTRODUCTION
The excitation of waves in a laboratory plasma at long wavelengths that are comparable to the device length scale is subject to boundary conditions in addition to the drive terms and damping mechanisms. Representative examples of these waves include the ion-cyclotron range of frequencies (ICRF) waves that are used for plasma production and ion heating in the GAMMA 10 tandem mirror device,1,2and also the Alfv´en-ion-cyclotron (AIC) waves3–6 that are spontaneously excited by strong anisotropy in the ion temperature. AIC waves have several discrete peaks in the unstable frequency range that occur just below the ion cyclotron frequency near the midplane of the GAMMA 10 central cell.7 The boundary conditions required for the formation of such eigenmodes in the unstable frequency range are not clear to date. The three-dimensional spatial structure of the AIC waves, which is crucial to the clarification of the boundary conditions, has not yet been mea-sured. Additionally, while there have been some observations and calculations to indicate that the AIC waves have signif-icant effects on the performance of the collisionless mirror plasma in GAMMA 10,8–10 the mechanism by which they affect the plasma parameters has not been fully revealed. An understanding of the wave-particle interactions that cause the axial transport of the high-energy ions and an assessment of
a)Electronic mail: ikezoe@prc.tsukuba.ac.jp
the nonlinear phenomena that may be related to the observed heating efficiency degradation would also be helpful.11,12 For all the research described above, a multi-point measure-ment system that can obtain the amplitude and phase pro-files of these high-frequency small-amplitude fluctuations is required.
Because probe measurements, which are well suited to multi-point and local detection applications, are not allowed in hot plasmas, we adopted microwave reflectometry as an alter-native detection method for the above studies and obtained data that correspond to high-frequency ICRF waves, includ-ing the spontaneously excited AIC waves that occurred in GAMMA 10.13,14 Our reflectometer system is basically a fixed-frequency reflectometer that is used for the measure-ment of precise time evolution. Such a system has been widely used for the density fluctuation measurement of the plasma instabilities in fusion experimental devices because of charac-teristics that include contactless diagnostics, good sensitivity to fluctuations with high locality, and a relatively compact and low-cost system. The application of these systems to high-frequency wave measurements has also been performed previously in several devices.15–20 Following the successful use of a reflectometer as a high-frequency fluctuation mea-surement device, we have recently upgraded our reflectometer to provide a multi-point detection system. The basic features of the upgraded system are as follows: heterodyne detection for separate detection of the phase and amplitude fluctua-tion components, an axial antenna array, fast switching of
033504-2 Ikezoeet al. Rev. Sci. Instrum.88, 033504 (2017)
the microwave antennas using PIN diode switches, and simul-taneous two-point detection in either the radial or the axial direction.
Among these features, the most important is the use of PIN diode switches for fast antenna switching during a sin-gle discharge. The PIN diode switch itself has been used in plasma diagnostics in the past and helped to reduce the number of microwave components required to form a multi-channel interferometer.21,22Here, PIN diode switches are used to form a multi-channel reflectometer for the first time. For the measurement of the temporal behavior of high-frequency fluctuations of the order of MHz (as per this study) or more, the most expensive instrument would be a high-performance digitizer with much wider bandwidths than the measurement frequency and a large memory capacity. Additionally, to mea-sure the spatial behavior, it would be necessary to prepare many similar instruments and the digitizer would also be required to have the same number of channels as the num-ber of instruments. In such a situation, the use of PIN diode switches in multi-point measurement allows the minimum set of microwave components and data acquisition channels, and hence it is advantageous from the viewpoint of cost and synchronization.
Two other features, heterodyne detection and simulta-neous two-point detection, are also required for our study. The separation of the phase fluctuation component from the amplitude fluctuation component that is included in the reflected microwave has been shown to be crucial for the high-frequency and small-amplitude fluctuations of AIC waves. Simultaneous two-point detection enables the assessment of the phase profiles of the fluctuations in addi-tion to their ordinal amplitude profiles; both of these profiles are important to the study of the wave-related issues described earlier.
The rest of the paper is organized as follows. The specifi-cation of the developed reflectometer using PIN diode switches is described in Sec. II. The experimental results are given
in Sec.III, which includes a brief description of the GAMMA 10 device; discussion of the applicability of the developed reflectometer to two-point correlation analysis of the high-frequency fluctuations with the clear effect of phase and amplitude separation; a demonstration of antenna switching over time; and the results of our first observation of the axial variation of the AIC waves. A summary of the work is given in Sec.IV.
II. REFLECTOMETER FOR MULTI-POINT DETECTION
A. System design
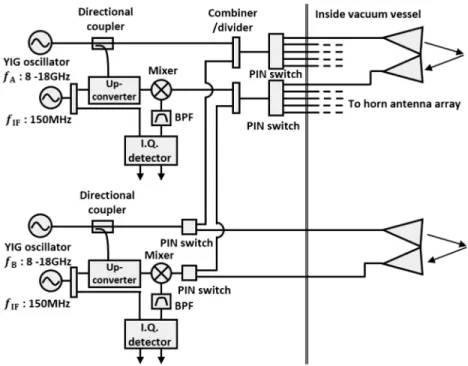
A block diagram of the newly upgraded reflectome-ter is shown in Fig. 1. This system consists of two sim-ple heterodyne reflectometers with frequency-tunable yttrium iron garnet (YIG) microwave oscillators (MLOS-1326, Micro Lambda Wireless, Inc.). One of the incident lines (the top line shown in Fig.1) is fed to a PIN diode switch (SP5T, RFSP5TA0118G, RF-Lambda), and the exit ports of this switch are connected to each of the incident antennas that are arrayed in the axial direction. The time response and the isolation of the PIN switch are 100 ns and 65/60 dB (8–12/12–18 GHz), respectively. The receiving line is also fed to each of the receiving antennas through another switch in a similar manner to the incident line and both switches are always synchronized. There are also other PIN diode switches (SPDT, RFSP2TA0118G, RF-Lambda) in the sys-tem that combine the two reflectometers and switch between the two different measurement schemes. One scheme involves simultaneous two-point measurements at axially spaced posi-tions, i.e., independent reflectometers. When almost identi-cal incident frequencies are used, detection processes on the same magnetic field line are possible. The other measurement scheme involves simultaneous two-point measurements per-formed at radially spaced positions, which are perper-formed by launching microwaves at different frequencies from the same antenna.
033504-3 Ikezoeet al. Rev. Sci. Instrum.88, 033504 (2017)
Four output signals from two IQ (In-phase and Quadra-ture) detectors are digitized at 50 MHz for the entire discharge duration of 200 ms using a fast four-channel oscil-loscope with bandwidths of 400 MHz that is located near the reflectometer. This oscilloscope has a central process-ing unit (CPU), and LabVIEW (National Instruments Corp.) is installed to control the data acquisition process. The data are automatically saved on a network data server through a local area network (LAN) connection. A compact multi-channel analog input/output (I/O) and digital I/O device (NI USB-6363) is used to drive the four PIN diode switches and
to tune the two YIG oscillators. The maximum digital out-put rate of the USB-6363 is 1 MHz, which is fast enough for our use here; we normally switch antennas at less than 5 kHz to fix the incident and receiving antennas for a period that is longer than the time window required for the fast Fourier transform (FFT). The USB-6363 is also controlled by a LabVIEW program through a Universal Serial Bus (USB) connection to the oscilloscope. Because the aim of this pro-cess is to perform fluctuation measurements, we basically set the incident microwave frequency to a fixed value during a discharge.
033504-4 Ikezoeet al. Rev. Sci. Instrum.88, 033504 (2017)
B. Arrangement in GAMMA 10
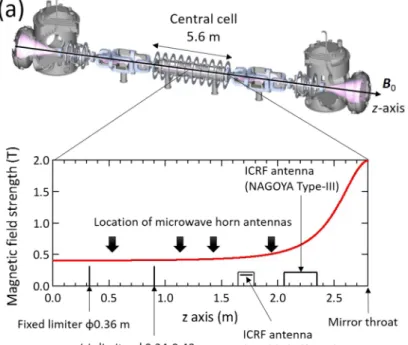
The developed reflectometer system is located near the GAMMA 10 central cell. The transmitting length, includ-ing the incident and receivinclud-ing lines, is less than 8 m in total and is formed from low-loss microwave coaxial cables. SMA (SubMiniature version A) connectors are mounted on vacuum flanges to feed the microwave signals to the antennas that are installed inside the vacuum vessel. To form an antenna array suitable for the present study, we installed antennas inside the vacuum vessel without the restrictions of the attainable vacuum ports. The vacuum vessel is 1.00 m in diameter and the plasma diameter in the central cell is 0.36 m. The antenna arrangement is shown in Fig.2. Pyramidal horn antennas (HAs) with gains of 15 dBi and 3 dB widths of∼30◦ are installed at four axial positions ofz= 0.52, 1.12, 1.42, and 1.93 m; the z-axis is set on the magnetic field axis, with the origin located at the midplane of the central cell. As shown in Figs.2(c)and2(d), four antenna sets with standard WR-90 (X-band) sizes and ordinary-mode (O-mode) orientations are installed in the axial direction. A WR-62 (Ku-band) horn antenna set with extraordinary-mode (X-mode) orientation is also installed atz= 1.12 m. The angle of incidence for all antennas is supposed to be almost normal to the cutoff layer. The cutoff frequencies of the O-mode and the X-modes in the GAMMA 10 central cell are shown in Fig.3 for two density profiles: typically used model and an exper-imentally obtained profile. The use of O-mode microwaves in the X-band can access a relatively wide radial region in GAMMA 10, although access to the center is dependent on the core density. Very peripheral regions can be accessed using a right-handed polarized X-mode microwave in the Ku-band. In the presented system, the exit ports of the SP5T switches are fed to the O-mode antenna sets atz= 0.52, 1.42, and 1.93 m and the X-mode antenna set at z = 1.12 m. We plan to add another antenna set in the near future to cover the remaining ports of
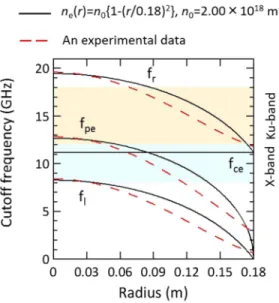
FIG. 3. Radial profiles of cutoff frequencies for a typical density profile (solid lines) and an experimentally obtained profile (dashed lines) in the GAMMA 10 central cell; here,fpe,fce,fr, andfldenote the plasma frequency (O-mode), the electron cyclotron frequency, and the right- and left-handed polarized X-mode frequencies, respectively. The frequency range of the microwave oscillator used, in the X- and Ku-bands (8–18 GHz), is hatched.
both SP5T switches, which are now directly connected to each other through a 20 dB attenuator for some of the system tests. An O-mode antenna set atz= 1.12 m is always connected to one of the two circuits without the SP5T switches, i.e., at the bottom part of the block diagram that is shown in Fig.1. This setup enables radial two-point measurements to be taken at z= 0.52, 1.42, and 1.93 m using the O-modes and atz= 1.12 m using the X-modes. Measurement using dual modes (O-X), like O-X correlation reflectometry23,24is also possible at z= 1.12 m. For the axial two-point measurements, the O-mode horn antenna sets atz= 0.52, 1.42, and 1.93 m can be used with the O-mode antenna set located atz= 1.12 m acting as the reference.
C. On contamination of the microwaves
The use of two reflectometers with independent oscilla-tors in the system may disrupt ideal operation through radio-frequency (RF) leakage or crosstalk, even when both reflec-tometers are well adjusted. The largest unfavorable RF leakage source is that which comes from the power combiner/divider when the system is operated to perform two-point measure-ments in radially spaced positions. During this operation, the two microwave signals are combined through the power com-biner/divider and transmitted to the plasma from the incident antenna that is selected by the SP5T switch, and the reflected microwaves that are received by the receiving antenna are in turn divided into two receiving circuits through the power com-biner/divider. It is noted that each of the divided microwaves is composed of the two frequencies that originated from the two oscillators, i.e.,fA and fB. After mixing with a
refer-ence microwave signal offA/B+ 150 MHz in each heterodyne
detection circuit, four signal frequencies (fA/B + 150 MHz
±f′
AandfA/B+ 150 MHz±f ′
B) are produced; where the use
of′
denotes the plasma path. Only one of these four frequen-cies is the exact intermediate frequency of 150 MHz. The two frequenciesfA/B should be separated by a few tens of MHz
to cut out the unwanted componentfA/B + 150 MHz☞ fB/A′
via the band-pass filter, which is installed just before the IQ detector. The passband of which loss is less than 1 dB is about 130–180 MHz. There is also a large and unfavorable RF leak-age in the two-point measurement operation in axially spaced positions; a microwave signal launched from an antenna can thus be received by the antennas at the other axial positions. The microwaves that enter the receiving antennas that were not selected by the SP5T switch can be neglected because of the high isolation of the switch. In contrast, the microwave signal that enters the receiving antenna selected by the switch is then transmitted to the heterodyne detection circuit; in this case, however, it can also be cut out by the band-pass filter as described above. Therefore, when measuring along the field line, we set slightly different microwave frequencies forfA
andfB. The difference used in this study is 50 MHz, which
results in a radial deviation of much less than 1 mm.
033504-5 Ikezoeet al. Rev. Sci. Instrum.88, 033504 (2017)
one of the oscillators. As a result, the total crosstalk level was evaluated to be in the approximate range from 10☞4to 10☞3in power for the AIC waves. The noise level, which was obtained by turning off both oscillators, was less than the crosstalk described above; the AIC waves are spontaneously excited inside the vacuum vessel and thus their electromagnetic radi-ation in air is quite low when compared with the externally driven ICRF waves.
III. EXPERIMENTAL RESULTS AND DISCUSSION
A. Brief description of the GAMMA 10 device
The GAMMA 10 is a tandem mirror device that consists of five mirror cells: a central cell, two anchor cells for mag-netohydrodynamics (MHD) stabilization using a minimum-B configuration, and two plug/barrier cells for confinement potential formation.25Measurements using the reflectometer were performed in the main confinement region, known as the central cell, where two types of ICRF antennas are installed at the two sides, as shown in Fig.2. Nagoya type-III antennas are used for plasma production and ion heating in the anchor cells.1,26Double half-turn antennas are used to perform fun-damental ion heating in the central cell, with a resonance near z=±1 m for the vacuum field and a frequency of 6.36 MHz; the species used here is hydrogen. This so-called beach heat-ing process is very effective for the production of the high-beta and anisotropic plasmas that are required for the excitation of the AIC waves. The ion temperature, when measured perpen-dicular to the field line near the midplane of the central cell, easily reaches several keV with a relatively low density of 2×10¹⁸m☞3. The GAMMA 10 plasma is produced and sus-tained using these ICRF waves alone. Each of the antennas is normally driven with an input power of less than 150 kW, and the pulse length is 200 ms.
B. Phase separation and correlation analysis of high-frequency fluctuations
When a cutoff layer fluctuates in time, mixing of the reflected microwave with a reference microwave produces the fluctuations. This fluctuation includes not only the pure phase fluctuation component that arises from the fluctuating optical path difference caused by the variation of the cutoff layer but also includes the amplitude fluctuation component. When using a heterodyne system, these two components can be clearly separated if the system is well adjusted and works almost ideally. We have confirmed that the separated ampli-tude component that was obtained by our system was well correlated in time with the reflected microwave power that was detected using a power detector. This indirectly supports the measurement accuracy of the separated phase fluctuation component.
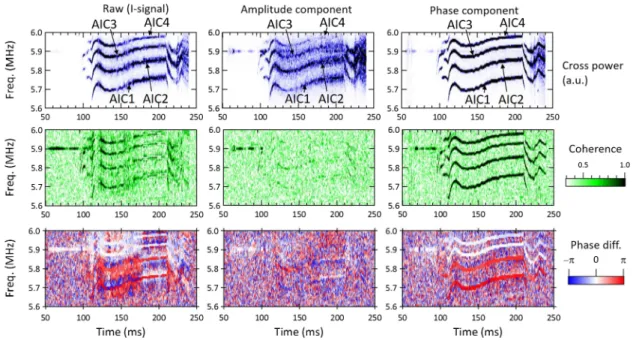
An effect of the clear phase separation produced by our reflectometer on the low-level high-frequency fluctuations is demonstrated in Fig.4. We measured the density fluctuation that was caused by the AIC waves atz= 0.52 and 1.12 when the antennas were fixed in time using 10.00 and 10.05 GHz microwaves, and then calculated the cross power spectra, the coherence, and the phase difference between the obtained sig-nals. We compared the results obtained against three different signals, with results as shown in Fig.4. The graphs on the left side of Fig.4were obtained for the raw outputs (I) of the IQ detectors, which involves a type of homodyne detection, and the graphs at the center and in the right side are those of the separated amplitude and phase components, respectively. In the cross-power spectra for the three patterns that were described above, the four peaks that were associated with the AIC waves (denoted by AIC1–4 in Fig.4) were observed in the 5.6–6.0 MHz range. The phase components show these peak frequencies most clearly, which demonstrates the high
033504-6 Ikezoeet al. Rev. Sci. Instrum.88, 033504 (2017)
sensitivity of the reflectometer’s phase component to the high-frequency fluctuations caused by the AIC waves, and also indi-cate the good separation of this component from the raw signal. The amplitude component does show the contribution from the AIC waves but its peaks are relatively broadened by some background fluctuations. Therefore, the raw outputs of the IQ detectors are shown to be contaminated by the significant amplitude component that is also present in the high-frequency band.
The difference is more explicit for the coherence and phase differences between the two points. Here, ensemble averaging is performed over time for 10 ensembles, and the noise level of the coherence is approximately 0.4, which is slightly greater than the ideal statistical noise level of 0.32 because of a small data overlap. With regard to the coherence for the raw signals, while high coherence of close to unity is occasionally obtained, there are significant periods with low coherence. The phase difference shown in the bottom part of Fig.4has both clear and ambiguous values at the AIC wave fre-quencies, depending on the time. Therefore, when a homodyne system is used to detect the phase difference of the AIC waves, the data must be selected carefully, and as a result, the precise measurement of its time evolution is difficult. With regard to the amplitude component shown in the center column in Fig.4, the coherence is almost at the noise level for the entire dis-charge duration and the phase difference is almost random. We can no longer distinguish the AIC wave frequencies from the graph in this case. In contrast, a high coherence of nearly 1 is temporarily sustained for the phase component. The phase dif-ference is also very clear. Therefore, for the AIC waves at least, the phase component that is separated from the raw I/Q signals by the heterodyne system retains the correct phase information for the AIC waves and is applicable to correlation analysis pro-cesses such as that shown in Fig.4. The amplitude component includes the contribution of the AIC waves but contains no phase correlation; multiple phases that arise from a nonsingu-lar point or some integration effects can be mixed up to disturb the phase information at the cutoff layer. While there have been some previous discussions on the treatment of the amplitude fluctuation component,27 the detailed generation mechanism and the cause of the visible difference shown in Fig.4remain unclear in our case. Therefore, we basically use the phase fluctuation component to perform the following evaluation of the spatial structure of the high-frequency fluctuations. From the phase difference that was obtained from the separated phase fluctuation components, it is confirmed that the AIC waves form a standing wave structure (with a phase difference of 0 or π) in the axial direction, as expected
from the results that were obtained using a magnetic probe set at the plasma edge;28 previous results showed that the axial wavelength changed from k// = 5∼10 m☞1 to zero as the waves form a standing wave structure. Additionally, we can see differences among the AIC waves; phase differences of 0 for the two AIC waves at higher frequencies (AIC3 and AIC4) and πfor the two AIC waves at lower
frequen-cies (AIC1 and AIC2), which should be related to differ-ences in their node positions. Changes were also observed in these phase differences with variations in the plasma parameters; see, e.g., Fig.7for comparison with Fig.4. These
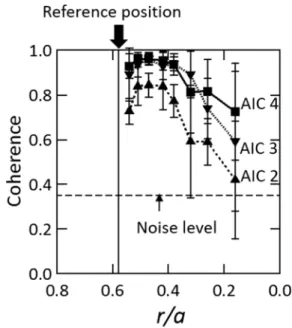
FIG. 5. Radial dependence of coherence at the AIC wave frequencies.
results show that the boundary conditions that determine the spatial structure could possibly be investigated inside the hot plasma using the developed two-channel reflectometer system.
C. High coherence in a wide spatial region
In addition to the coherence that is shown in Fig.4, we confirmed high coherence for the axial two-point measure-ments when using the farthest antenna pair with an axial distance of 0.81 m. We then checked the coherence profile in the radial direction in another experiment. Figure5shows the radial profile of the coherence that was obtained via a radial two-point measurement using the O-mode antenna set at z= 1.12 m over a series of discharges when varying one of
033504-7 Ikezoeet al. Rev. Sci. Instrum.88, 033504 (2017)
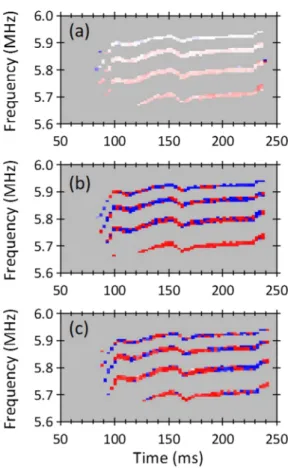
FIG. 7. Time evolution of the three phase differences when separated from the profile shown in Fig.6for each antenna pair; (a)–(c) are the characteristics for antenna pairs p1, p2, and p3 from Fig.6, respectively. The color bar of three graphs are the same with that in Fig.6.
the incident frequencies from shot-to-shot, while the other incident frequency remained fixed at 8 GHz for reference. The coherence relative tor/a∼0.58 (where the incident fre-quency is 8 GHz) decreases when we approach the plasma core, although the AIC waves should show a coherent structure throughout the radial region. This degradation may be a result of a low signal-to-noise ratio near the core; the signal becomes weak because of a reduction in the reflected microwave inten-sity and the low fluctuation levels near the core, which will be shown later in the paper. However, the coherence obtained is still higher than the statistical noise level, and thus the phase profile could be investigated under the present conditions.
D. Multi-point detection using antenna switching
We performed the antenna switching tests for a series of plasma discharges, where the operating mode was an axial
two-point measurement while switching one of the antenna sets at 1 kHz throughout the duration of the discharge. The orientation was in O-mode, and the incident frequen-cies were fixed at 8.00 and 8.05 GHz. The phase difference obtained is shown in Fig.6. The switched antenna sets were at 0.52 m, 1.42, and 1.93 m, as described in Sec. II, and were continuously switched in this order. Therefore, the same antenna set appears every 3 ms. Ensemble averaging was performed to calculate the phase difference over six indepen-dent time windows of approximately 0.16 ms, which were not overlapping, during each antenna holding period of 1 ms. Figure 6 shows the phase difference in the AIC wave fre-quency range, like that shown in Fig.4, but the background that contains no significant frequency component is masked in this case with a gray color to show the AIC wave fre-quencies clearly. The phase difference is seen to change every 1 ms in response to the change of the antenna pair. By pick-ing up each of the periods for the same antenna pairs, the time evolution of each antenna pair can then be obtained as shown in Fig. 7, although the time resolution is inevitably reduced when compared with that of the fixed antenna case. Figure7shows that the 0–πphase difference changes in the
axial direction, which indicates the passing of the nodes of the standing wave structure; in this case, the nodes are stationary located betweenz= 1.12 and 1.42 m. We compared the phase differences that were obtained in Fig.7with those obtained without antenna switching and confirmed that they were almost identical. Therefore, antenna switching was successfully per-formed to evaluate the spatial structure at multiple points in a single discharge without the use of multiple reflectometers for each antenna set. The switching speed must be selected appropriately based on a balance among the time resolution, the characteristic variation time of the boundary conditions, and the duration of the time window used for the correlation analysis.
E. Spatial variations of the AIC waves
Radial scanning was performed in another experiment by varying the incident microwave frequency to obtain the radial profiles. In this experiment, we measured the density fluctuations at two points radially and switched the axial loca-tion by 5 kHz for the duraloca-tion of the discharge. The incident frequencies were changed from shot-to-shot for five identi-cal discharges; a total of 10 cutoff positions were measured, and the frequencies used were 8.0 to 12.5 GHz with steps of 0.5 GHz. We calculated the density fluctuation level using the density gradient scaleLn as ˜nene= λ4πLnφ˜, where
033504-8 Ikezoeet al. Rev. Sci. Instrum.88, 033504 (2017)
˜
φis the phase fluctuation andλis the effective wavelength of microwave; we used 1.7 longer than the vacuum wavelength. The cutoff positions and the density gradient scales were cal-culated from the density profile that was obtained using an interferometer with a movable chord. An example of the radial profiles of the density fluctuation level obtained for each AIC wave is shown in Fig.8, where each AIC wave is numbered in the same manner as in Figs.4and5. The corresponding cutoff frequency profile is shown in Fig.3. The comparison of radial profiles at the three axial positions shows that the fluctuation level reaches a maximum near the midplane and decreases towards the mirror throat, except for AIC1. This result indeed shows the different axial variation among the AIC waves, which should be related to unknown boundary conditions producing discrete peaks in the unstable frequency region.
IV. SUMMARY
A two-channel microwave reflectometer with a fast antenna switching capability was developed and applied to the hot plasma in the GAMMA 10 tandem mirror device to study high-frequency small-amplitude fluctuations associated with the AIC waves; the frequency range is 5.6–6.0 MHz and the density fluctuation level is in the order of 10☞3 to 10☞4. A correlation analysis applied to simultaneously mea-sured density fluctuations showed that the phase component that was included in a reflected microwave provided both the high coherence and a clear phase difference for the AIC waves, while the amplitude component showed neither significant co-herence nor clear phase difference. Antenna switching was per-formed successfully at the expense of the time resolution, allo-wing the evaluation of the spatial structure at multiple points without the use of multiple reflectometers for each antenna set. The axial variation of radial profiles of the AIC waves becomes possible to be evaluated, and a clear difference among the AIC waves has been obtained for the first time. Such a difference would be a key to clarify the unknown boundary conditions of the AIC waves which produces multi-discrete peaks in the unstable frequency range. We are planning similar experiments using additional antennas located at different axial positions to obtain a conclusive view of the wave profiles and the bound-ary conditions in the axial direction. The reflectometer system that is described here can easily be extended to a larger system capable of detection at more axial locations without the need to prepare another expensive digitizer or extra microwave compo-nents; the components required are simply the extra channels of the PIN switch and the microwave antennas.
ACKNOWLEDGMENTS
The authors would like to thank Professor A. Mase for useful discussions and would also like to thank the members of GAMMA 10 group for their efforts in supporting the exper-iments in GAMMA 10. This work is supported in part by Grants-in-Aid for Young Scientists (B) (Grant No. 15K17797) and Scientific Research (C) (Grant No. 25400531), and by the Bidirectional Collaborative Research Program of NIFS (Grant No. NIFS15KUGM101).
1M. Ichimura, M. Inutake, S. Adachi, D. Sato, F. Tsuboi, Y. Nakashima,
I. Katanuma, A. Itakura, A. Mase, and S. Miyoshi,Nucl. Fusion28, 799
(1988).
2R. Ikezoe, M. Ichimura, M. Hirata, T. Yokoyama, Y. Iwamoto, T. Okada,
S. Sumida, K. Takeyama, S. Jang, T. Oi, K. Ichimura, and Y. Nakashima,
Fusion Sci. Technol.68, 63 (2015).
3R. C. Davidson and J. M. Ogden,Phys. Fluids18, 1045 (1975).
4T. A. Casper and G. R. Smith,Phys. Rev. Lett.48, 1015 (1982). 5T. Tajima, K. Mima, and J. Dawson,Phys. Rev. Lett.39, 201 (1977). 6S. N. Golovato, K. Brau, J. Casey, M. J. Gerver, S. Horne, J. Irby, J. Kesner,
B. Lane, J. Machuzak, R. Myer, R. S. Post, E. Sevillano, and L. Wang,Phys. Fluids B1, 851 (1989).
7M. Ichimura, M. Inutake, R. Katsumata, N. Hino, H. Hojo, K. Ishii,
T. Tamano, and S. Miyoshi,Phys. Rev. Lett.70, 2734 (1993).
8T. Saito, M. Ichimura, Y. Kiwamoto, A. Mase, Y. Tatematsu, H. Abe,
K. Kajiwara, Y. Kogi, M. Nakamura, S. Umehara, Y. Yoshimura, and K. Yatsu,Phys. Rev. Lett.82, 1169 (1999).
9K. Ishii, T. Goto, Y. Goi, N. Kikuno, Y. Katsuki, M. Nagasaki, Y. Ono,
N. Ishibashi, M. Yamanashi, M. Nakamura, I. Katanuma, A. Mase, M. Ichimura, A. Itakura, T. Tamano, and K. Yatsu,Phys. Rev. Lett.83,
3438 (1999).
10H. Hojo, M. Nakamura, S. Tanaka, M. Ichimura, and A. Mase,J. Plasma
Fusion Res.75, 1089 (1999).
11R. Ikezoe, M. Ichimura, M. Hirata, T. Iwai, T. Yokoyama, Y. Ugajin, T. Sato,
T. Iimura, Y. Saito, M. Yoshikawa, J. Kohagura, Y. Shima, and T. Imai,Nucl. Fusion53, 073040 (2013).
12R. Ikezoe, M. Ichimura, T. Okada, M. Hirata, T. Yokoyama, Y. Iwamoto,
S. Sumida, S. Jang, K. Takeyama, M. Yoshikawa, J. Kohagura, Y. Shima, and X. Wang,Phys. Plasmas22, 090701 (2015).
13R. Ikezoe, M. Ichimura, T. Sato, M. Hirata, T. Yokoyama, Y. Ugajin,
T. Iimura, Y. Saito, Y. Annaka, A. Shiratani, Y. Shima, J. Kohagura, M. Yoshikawa, and T. Imai, Trans. Fusion Sci. Technol.63, 58 (2013),
available athttp://www.ans.org/pubs/journals/fst/a 16874.
14R. Ikezoe, M. Ichimura, T. Sato, Y. Imai, T. Murakami, T. Iwai, Y. Ugajin,
T. Yokoyama, Y. Shima, M. Yoshikawa, and T. Imai,Plasma Fusion Res.6,
2402047 (2011).
15A. Mase, M. Kobayashi, N. Oyama, T. Tokuzawa, H. Inutake, M. Yokoi,
A. Itakura, H. Hojo, L. Bruskin, M. Ichimura, and T. Tamano,Fusion Eng. Des.34–35, 371 (1997).
16J. H. Lee, W. A. Peebles, E. F. Jaeger, E. J. Doyle, N. C. Luhmann,
C. C. Petty, R. I. Pinsker, R. Prater, and T. L. Rhodes,Phys. Rev. Lett. 80, 2330 (1998).
17J. B. Wilgen, P. M. Ryan, G. R. Hanson, D. W. Swain, S. I. Bernabei,
N. Greenough, S. DePasquale, C. K. Phillips, J. C. Hosea, and J. R. Wilson,
Rev. Sci. Instrum.77, 10E933 (2006).
18T. Yamada, A. Ejiri, Y. Shimada, T. Oosako, J. Tsujimura, Y. Takase, and
H. Kasahara,Rev. Sci. Instrum.78, 083502 (2007).
19S. Shiraiwa, S. Baek, A. Dominguez, E. Marmar, R. Parker, and G. J. Kramer,
Rev. Sci. Instrum.81, 10D936 (2010).
20A. Ejiri, T. Tokuzawa, K. Saito, T. Seki, H. Kasahara, T. Mutoh,
R. Kumazawa, I. Yamada, and Y. Takase, JPS Conf. Proc.1, 015038
(2014).
21T. Yamada, A. Ejiri, S. Shiraiwa, and Y. Takase,Jpn. J. Appl. Phys., Part 1
40, 7083 (2001).
22E. Kawamori, Y.-H. Lin, A. Mase, Y. Nishida, and C. Z. Cheng,Rev. Sci.
Instrum.85, 023507 (2014).
23A. Mase, M. Ichimura, H. Satake, R. Katsumata, T. Tokuzawa, Y. Ito,
H. Hojo, E. J. Doyle, A. Itakura, M. Inutake, and T. Tamano,Phys. Fluids B5, 1677 (1993).
24M. Gilmore, W. A. Peebles, and X. V. Nguyen,Rev. Sci. Instrum.72, 293 (2001).
25M. Inutake, T. Cho, M. Ichimura, K. Ishii, A. Itakura, I. Katanuma,
Y. Kiwamoto, Y. Kusama, A. Mase, S. Miyoshi, Y. Nakashima, T. Saito, A. Sakasai, K. Sawada, I. Wakaida, N. Yamaguchi, and K. Yatsu,Phys. Rev. Lett.55, 939 (1985).
26M. Inutake, M. Ichimura, H. Hojo, Y. Kimura, R. Katsumata, S. Adachi,
Y. Nakashima, A. Itakura, A. Mase, and S. Miyoshi,Phys. Rev. Lett.65,
3397 (1990).
27T. L. Rhodes, W. A. Peebles, E. J. Doyle, P. Pribyl, M. Gilmore,
R. A. Moyer, and R. D. Lehmer,Plasma Phys. Controlled Fusion40, 493
(1998).
28M. Nakamura, M. Ichimura, Y. Ohta, M. Oikawa, S. Tanaka, Y. Kogi,