in the Japanese Trust and Banking Industry: A Note
1. Introduction
Evidence of economies of scale and scope is important if they determine competitive performance of banks since geographic and functional limitations may create disadvantages for scope-restricted banks. Moreover, the existence of economies of scale and scope could benefit society, for example, if it is passed along to the clientele in the form of lower prices. One could argue that growth in the banking industry should be driven by economies of scale during a boom economy and that economies of scope would become a relatively more important factor during periods of slow growth coupled with an increasingly competitive environment. As deregulation of financial markets progresses in Japan we expect to witness greater competition in the banking industry. It is often argued that in an increasingly competitive environment, banks will diversify their business to survive. This in turn should give rise to economies of scope [Kasuya (1986)]. Economies of scale and scope in the Japanese trust banking industry are empirically assessed by employing a translog cost function during the so called bubble period (1985-89) and the post-bubble period (1990-94) to test this conjecture.
2. The Translog Cost Function and Economies of Scale and Scope Through economies of scope, a bank can achieve cost savings by producing several outputs jointly rather than specializing in the production of a single product [Baumol, Panzar, and Willing (1988)]. In the context of the trust
The Journal of Social Science 53 [2004]
pp.121-128
Some Evidence on the Economies of Scale and Scope
in the Japanese Trust and Banking Industry: A Note
Nobuya Takezawa* Junichi Iwamoto**
in the Japanese Trust and Banking Industry: A Note
banking business, this can be expressed as C (B, T) < C (B, 0) + C (0, T), where C (..) denotes a cost function, B the output for the banking business, and T the output for the trust business.. One source of economies of scope is the use of common inputs in the production of different output allowing for transfer of additional input to the production of the other output without incurring substantial costs. Information is gained from the production of one output and is quickly disseminated, and can be applied in the production of the second output.
The present study focuses on output based on the trust business and output based on the banking business, as this provides for a natural division of output for the trust banking industry. Although there are different forms of trust, we abstract from such differences. We focus on two major inputs of production:
expense for raising funds and personnel expenses.
A multi-product translog cost function [Caves, Christensen, and Trentheway (1890)] is employed to empirically investigate economies of scale and scope.
This approach is rooted in earlier studies on the financial industry in North America [Gilligan, Smirlock, and Marshall (1984) among others]. Empirical studies on economies of scale and scope in the Japanese banking industry include Kasuya (1986), Tachibana, Mitsui, and Kitagawa(1991), and Yoshioka and Nakajima (1987) among others.
The translog cost function estimated in the present paper takes the following form
lnC = α0 + α1ln B +α2 lnT + ß1ln Pƒ + ß2 ln Pw + γ11 1
2 (ln B)2 + γ22 1 2(lnT )2 +γ12 ln B ln T +δ11 1
2 (ln Pƒ)2 +δ22 1
2 (lnPw)2 +δ12 ln Pƒ ln Pw
+θ11 ln B ln Pƒ +θ12 ln B lnPw +θ21 ln T ln Pƒ +θ22 ln T ln Pw + φD
where T denotes output for trust business, B output from the banking business, Pf
the unit price of raising funds (interest expense), Pw the unit price for labor, and C ordinary expense. A dummy variable, D, enters the specification to control for the effects of size and market power of the three leading Japanese trust banks. D
in the Japanese Trust and Banking Industry: A Note
takes on the value of one for Mitsubishi, Sumitomo, and Mitsui trust and banking and zero otherwise.
We apply several restrictions to obtain a well behaved cost function. The symmetry conditions γ12 =γ21 and δ12 =δ21 are imposed to satisfy second order derivative conditions. Homogeneity of degree one in factor prices requires that β1 +β2 = 1 and θ11 +θ22 +θ12 +θ21 =0. Finally, δ11 +δ22 +δ12 = 0 is imposed to ensure homogeneity of output to cost.
An estimate for economies of scale is obtained by (evaluating at the mean)
∂ln C
∂ ln B+ ∂ ln C
∂ ln T = α1+ α2 and an estimate for cost complementarity (scope) is obtained (at the mean) by ∂2ln C
∂ lnB∂ lnT + ∂lnC ∂lnB
∂lnC
∂lnT = γ12 + α1α2
3. The Data
Annual data from 1985 to 1994 is employed in this study for seven Japanese bank and trust companies: Mitsubishi, Sumitomo, Mitsui, Yasuda, Toyo, Chuo, and Nihon Trust and Banking. The data is obtained from Yukasyouken Houkokusyo (Official Security Report) and Zenkoku Ginkou Saimsyohyoubunseki (National Bank Financial Analysis Report). As Chuo Trust Banking was not listed on the Tokyo Stock Exchange before 1989, they kindly provide us with their financial data prior to 1989. The data series begins in 1985 and provides a convenient starting point for several reasons. Both Yukasyouken Houkokusyo Zenkoku Ginkou Saimsyohyoubunseki changed the account item classification scheme effective 1984 thus allowing us to employ data under a consistent classification scheme. Also, the Tochi Shintaku (Estate Trust) was launched in 1984 and the Fund Trust was launched three years earlier in 1981. Furthermore, the bubble period (boom economy) can be characterized as beginning in the mid 1980's. The time domain of our data set ends in 1994 for several reasons. In April 1993, financial reforms allowed for other financial intermediaries to enter the trust business and as result could give rise to a dramatic change in industry structure. As a consequence it is difficult to trace the performance of the same
in the Japanese Trust and Banking Industry: A Note
set of seven trust banks beyond 1995. For example, Yasuda Trust was acquired (subsidiary) by the former Fuji Bank in1998.
Output for the trust business is measured as trust fees obtained from the income statement. The banking business output is defined as interest income, fees and commissions received, and other operating income. The unit price of labor is obtained by dividing salaries and allowances by the number of employees. The unit price of interest expense (yield on fund raising) is calculated as interest expense (fund raising expense) divided by outstanding balance of raised funds. The balance of funds raised include deposits, CD, Call money, bills sold, and borrowed money. All data are normalized by dividing by the mean value in the sample.
4. Empirical Results and Discussion
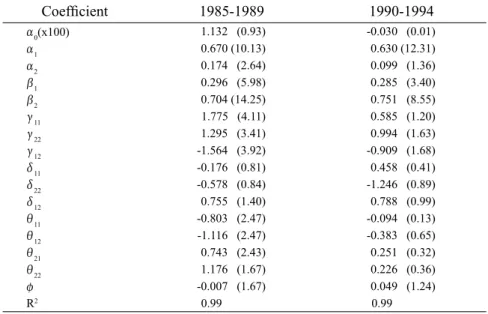
The sample is divided into two sub-samples with 35 observations each so that we could compare economies of scale and scope between the bubble and post-bubble periods. Two translog cost functions are estimated simultaneously as a pair of seemingly unrelated regressions under the regularity restrictions given in the previous section. The estimates of the coefficients are given in Table 1.
Economies of scale exist and are statistically significant both during and after bubble. The absolute magnitude of the scale factor (α1 +α2) decreased in the post- bubble period and is statistically significantly different from the scale factor during the bubble period. This contradicts our conjecture that scale effects are relatively stronger during an economic boom. One possible explanation is that the effects of deregulation and competition have actually lead to greater cost efficiency. As the restriction on the number of outlets is lifted for the trust and banking industry we could expect to see the industry increase the number of outlets and employing the scale effects to their advantage in the post-bubble period.
We find statistically significant scope factor (output complementarity) between the trust and banking business. Economies of scope (γ12 +α1 α2), however, decline in absolute magnitude during the post-bubble period. This
in the Japanese Trust and Banking Industry: A Note
could be attributed to a business cycle-bubble factor where the increase in output for both the trust and banking business were associated with little change in cost. Although, the scope factor is smaller in absolute magnitude in the post- bubble period, it is still statistically different from zero. Moreover, we find that the scope factor between the periods are not statistically significantly different from each other. It appears that even in times of slow economic growth, the trust banks do exhibit economies of scope.
Our findings are consistent with Kasuya (1986) who finds economies of scale and scope to exist for Japanese city and local banks using revenue data for output. Tachibanaki, Mitsui, and Kitagawa (1991) also provide evidence of economies of scale and scope for city banks, local banks, and trust banks using cross-sectional data in the mid 1980's. We have confirmed earlier findings that economies of scale and scope did exist in the 1980's and provide further evidence that such economies prevail in the post-bubble period for the Japanese trust banking industry.
in the Japanese Trust and Banking Industry: A Note
Table 1: Parameter Estimates of the Translog Cost Function lnC = α0 + α1ln B +α2 lnT + ß ln Pƒ + ß2 ln Pw + γ11 1
2 (ln B)2 + γ22 1 2(lnT )2 +γ12 ln B ln T +δ11 1
2 (ln Pƒ)2 +δ22 1
2 (lnPw)2 +δ12 ln Pƒ ln Pw
+θ11 ln B lnPƒ +θ12 ln B lnPw +θ21 ln T ln Pƒ +θ22 ln T ln Pw + φD
Coefficient 1985-1989 1990-1994
α0(x100) 1.132 (0.93) -0.030 (0.01)
α1 0.670 (10.13) 0.630 (12.31)
α2 0.174 (2.64) 0.099 (1.36)
β1 0.296 (5.98) 0.285 (3.40)
β2 0.704 (14.25) 0.751 (8.55)
γ11 1.775 (4.11) 0.585 (1.20)
γ22 1.295 (3.41) 0.994 (1.63)
γ12 -1.564 (3.92) -0.909 (1.68)
δ11 -0.176 (0.81) 0.458 (0.41)
δ22 -0.578 (0.84) -1.246 (0.89)
δ12 0.755 (1.40) 0.788 (0.99)
θ11 -0.803 (2.47) -0.094 (0.13)
θ12 -1.116 (2.47) -0.383 (0.65)
θ21 0.743 (2.43) 0.251 (0.32)
θ22 1.176 (1.67) 0.226 (0.36)
φ -0.007 (1.67) 0.049 (1.24)
R2 0.99 0.99
t-statistics are in parenthesis.
Table 2: Economies of Scale and Scope
1985-1989 1990-1994 85-89 vs.90-94a
α1+α2 0.8447 0.7298 1.84
scale (8.71)b (4.52)b
γ12+α1α2 -1.4474 -0.8460 0.60
scope (3.66)c (1.52)c
t-statistics in parenthesis. a: t-test statistic of whether the sum of the parameter estimates for both subperiods equal zero. b: test whether α1+α2 =1. c: test whether γ12+α1α2 = 0.
in the Japanese Trust and Banking Industry: A Note
* We would like to thank Mr. Morio Kagawa (Chuo Trust and Banking) and Mr. Tsuyoshi Kodaka (Mitsubishi Trust and Banking) for assistance in obtaining data. The authors would like to especially thank the late Prof. Toshiyuki Otsuki for his encouragement and support. An earlier version of this paper was circulated as an IUJ working paper.
References
Baumol, W.J., J.C.Panzar, and R.D. Willing (1988). Contestable Markets and the Theory of IndustrySstructure (revised edition). New York: Harcourt Brace Jovanovich, Inc.
Caves, D.W., L.R. Christensen, M.W. Tretheway (1980). Flexible cost functions for multi-product banking firm. Review of Economics and Statistics, 62, 477-481.
Gilligan, T., M. Smirlock, and W. Marshall (1984). Scale and scope economies in the multi-product banking firm. Journal of Monetary Economics, 13, 393-405.
Kasuya, M. (1986) Economies of scope: theory and application to banking. Bank of Japan Monetary and Economic Studies, 4, 59-104.
Tachibanaki, T., K.Mitsui, H. Kitagawa (1991). Economies of scope and shareholding of banks in Japan. Journal of the Japanese and International Economies, 5, 261-281.
Yoshioka, K., and T.Nakajima (1987). Economies of scale in Japan's banking industry. Bank of Japan Monetary and Economic Studies, 5, 35-70.