Title
Tomographic Resolution of URA Coded Aperture Imaging and
Its Enhancement
Author(s)
Kishimoto, Keisaku; Chen, Yen-Wei; Nakao, Zensho
Citation
琉球大学工学部紀要(54): 53-58
Issue Date
1997-09
URL
http://hdl.handle.net/20.500.12000/1971
&54-^. 1997^ 53
Tomographic Resolution of URA Coded Aperture Imaging
and Its Enhancement
Keisaku Kishimoto, Yen-Wei Chen, Zensho Nakao
Abstract
Tomographic resolution of URA ( uniformly redundant arrays) coded aperture imaging is studied quantitatively.
The performace of URA camera for three-dimansional imaging is investigated and it is shown also that the tomographic resolution can be improved by the use of small pinholes for URA aperture and fine sampling for decoding.
1. Introduction
A number of coded aperture imaging (CAI) techniques have been used or proposed for X-ray imagingtn. An advantage offered by the CAI lies in its large photon collection efficiency due to its large open area. Uniformly redundant arrays (URA)[2] is one of CAI techniques. In URA coded aperture imaging, a pinhole is replaced by multi-pinhole arrays arranged in m-sequence'5(3]. So the URA camera can provide a two-dimensional image with a high resolution and high SN ratio. Furthermore, since the URA camera can view the object with a large solid angle, it can also provide some tomographic resolution for a three-dimensional object!4'5!. In this paper, we make quantitative evaluationt6] of the tomographic resolution and propose a new method to enhance the tomographic resolution.
2. URA Coded Aperture Imaging
The basic concept of an URA coded aperture imaging is shown in Fig.l. The URA coded aperture imaging is a two-step technique. The first step is the coded image formation (encoding
Received : 26 May, 1997
Department of Electrical and Electronic Engineering, Faculty of Engineering
This paper has been presented in ITC-CSCC'97
URA camera
Object Aperture Coded image
Computer decoding
reconstructed image
Fig.l The basic concept of an URA coded aperture imaging.
process) and the second step is the reconstruction of the coded image with computer (decoding process). If the object is a planar (two-dimensional) object parallel to the aperture, the encoded image P is given by
P{k, l) = O*A
k, r\ mod[j
where O is an object distribution, A is the encoding operator describing the aperture function, and *
denotes the correlation operator. A reconstruction 0
can be obtained by correlating a encoded image with the decoding operator G as= X X p(k' 0
* + /, r], mod[l + ;, s]) (2) k I54 KISHI.MOTO, CHEN, NAKAO: Tomographic Resolulion of URA Coded Aperture Imaging and Its Enhancement
In order to obtain a perfect reconstruction (0=0),
A *G must be a deltafunction. The key point of
CAI is to find G, the correlational inverse of A. In URA, the auto-correlation p of m-sequences with an array of rXs is given by
((rx s +1) /2; mod (/» = 0 and mod(y ,.s) = 0 (3) [(r x s +1) /4; otherwise
The cyclic auto-correlation is a single value with a non-zero background. Furthermore, by defining a balanced operator by
if A(U)=
ifA(iJ) = (4)
we can get a perfect delta function of A * G as
((rxs +l)/2; mod(i,r) = Oandmod(;,s) =0 (5)
|
0
; otherwise
Thus we can obtain a perfect reconstruction with a (r X j+1)/2 times flax by using G as the decoding
operator as shown in Eq(6). It means that the URA camera can provide an image with a high resolution and high SN ratio.
O=O*(A*G) (rxs+l) O (6)
3. Performance of tomographic imaging
The basic concept of tomographic imaging with URA coded aperture is shown in Fig.2.
Sources distant to the detector cast smaller aperture shadows than closer sources. The size of the shadow depend on the distance to the point, while the location of the shadow depends on the lateral displacement of the point. By correlating the recorded image with decoding patterns of different sizes, images of the source distribution at different depths can be retrieved.
Detector
Cod8d Aperture
Naar-by Source
Fi g. 2. The basic concept of tomographic imaging using URA coded aperture imaging.
The concept of the tomographic imaging can be expressed in simple mathematical terms[4.5].Let P(x,y) be an encoded image at position (x,y) on the detector, Oz(x,y) be the distribution in a plane parallel to the aperture and a distance z from it, and let Az(x,y) be the appropriately magnified version of the aperture for the distance z. There we have
(7) that is, the recorded image is the sum of the correlation of each object plane with an aperture pattern of appropriate magnification.
To retrieve the z-th plane information from P(x,y), one correlates it with a properly magnified
-, 1997# 55
(8)
^ y)]
Only one of the planes, the z-th, will be in focus,
while all the others will be out of focus.Therefore, it is clear that if the second term of Eq (8) becomes
zero,we can obtain a perfect reconstruction of z-th
plane. Since usually AZ<*GZ is not a delta function,
the second term appears on the z-th plane as a
defocus artifact. The larger difference is between z and z \ the smaller is the defocus artifact.
We have carried out computer simulations to study the performance of tomographic imaging using URA camera. The simulated objects consist
two planar objects Oi and O'i, which are parallel to the aperture, as shown in Fig.3.
object O'i object Oi
Fig.3. An arrangement of URA camera for tomographic imaging
The aperture-object separations are z and z1. The magnifications for Oi and O'i are M=/lz=5 and M'=/7z'=4, respectively. The encoded image on the detector plane is the sum of the correlation of each object with an aperture pattern of appropriate
-* 2 X
ft
mi
ill
iiir
s X(M'+L)Iff
IIPi
m
ii
ii
ii
m
■ilW]
E X i >F ig. 4 (a) URA coded aperture image, (b) tomographic image of O^ (c) tomographic image of O'i.
magnification. The calculated encoded image is shown in Fig.4(a). The solid lines show the cyclic permutations of the basic aperture pattern with magnification M and M'. The URA coded aperture used in the simulation is of 15x17. By the use of the decoding patterns with the encoded images of different size r(M+l)Xs(M+l) for Oi, KM'+1)X5 (M'+l) for O'i, images of Oi and O'i at different depths are retrieved as shown in Fig.4(b) and 4(c). Though there are some defocus artifacts, the reconstructions of Oi and O\ are clear.
In order to make quantitative evaluation, the depth point spread function (DPSF) was studied with a point-source. The point-source was assumed to be on axis with a source-aperture distance Zq. The peak intensities of the reconstructed
point-56 KISHIMOTO, CHEN, NAKAO : Tomographic Resolution of URA Coded Aperture Imaging and Its Enhancement
source at different Z are shown in Fig.5. Figure 5 can be considered as the DPSF of the URA camera. The sharper is the DPSF, the higher is the tomographic (depth) resolution. The Tomographic resolution obtained is AZ=O. 136Z0 for 15x17 URA. If the source-aperture distanceis 1 cm, the depth resolution is approximately 1.36 mm. This solution can be improved by the use of fine sampling and delta decoding.
140 120 c/4 100 80 *. 60 40 20 0 --20 . . .
/
I
/
I [ URA" 15x1 T I 1^0=1\r |
N
I
0.6 0.8 1 1.2 1.4Z/Zo
Fig. 5 The depth point spread function.
4. Fine sampling and delta decoding
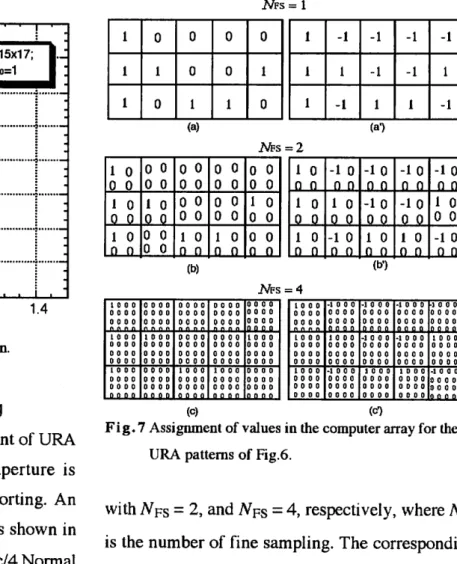
Let c be a size of one square element of URA pattern. Usually, a pinhole in URA aperture is
smaller than c in size to have self-supporting. An
example of the self-supporting pattern is shown in
Fig.6. The pinhole size is c/4 X c/4.Normal
sampling and decoding patterns are shown in Figs.7(a) and 7(a'), respectively. There is no
difference with that uses cxc holes on the same URA function. The self-supporting pattern can be
expressed with fine sampling^]. Figures 7(b) and 7(b') show the computer array for the pattern
SSI
Fig.6 URA pattern (3 x 5) with self-supporting
1 1 1 0 1 0 0 0 1 0 0 1 NFS 0 1 0 = 1 1 1 1 -1 1 -1 -1 -1 1 -1 -1 1 -1 1 -1 (a) (a') 1 0 1 Q 1 n 0 0 0 Q 0 n 0 0 i Q 0 U 0 0 0 Q 0 U 0 0 0 0 1 n 0 0 0 0 0 n 0 0 0 0 i n 0 0 0 0 0 0 0 l 0 0 Nbs 0 0 0 0 0 ft = 2 1 fl 1 Q 1 n 0 fl 0 Q 0 n -l n i Q -1 n 0 n 0 Q 0 n -l n -i 0 i 0 fl 0 p 0 n -l n -i 0 i ft 0 0 p 0 n -l l 0 -l n 0 n 0 0 0 n (b) (b1) 10 0 0 0 0 0 0 0 0 0 0 10 0 0 0 0 0 0 0 0 0 0 0 0 0 0 10 0 0 0 0 0 0 0 0 0 0 n o n o 0 0 0 0 0 0 0 0 0 0 0 0 10 0 0 0 0 0 0 0 0 0 0 0 0 0 0 0 0 0 0 0 0 0 0 0 0 0 0 n o n n 0 0 0 0 0 0 0 0 0 0 0 0 0 0 0 0 0 0 0 0 0 0 0 0 0 0 0 0 10 0 0 0 0 0 0 0 0 0 0 0 0 0 0 0 0 0 0 0 0 0 0 00 00 0 0 0 0 0 0 0 0 0 0 0 0 0 0 0 0 10 0 0 0 0 0 0 0 0 0 0 n o o n A'fs 0 0 0 0 0 0 0 0 0 0 0 0 n n o n 10 0 0 0 0 0 0 0 0 0 0 0 0 0 0 0 0 0 0 0 0 0 0 0 0 0 0 n n n n == 4 10 0 0 0 0 0 0 0 0 0 0 10 0 0 0 0 0 0 0 0 0 0 0 0 0 0 10 0 0 0 0 0 0 0 0 0 0 0 0 0 0 -10 0 0 0 0 0 0 0 0 0 0 fi fl n n 10 00 0 0 00 0 0 0 0 0 0 0 0 -10 0 0 0 0 0 0 0 0 0 0 0 0 0 0 -10 0 0 0 0 0 0 0 0 0 0 noon -10 0 0 0 0 0 0 0 0 0 0 0 0 0 0 10 0 0 0 0 0 0 0 0 0 0 0 0 0 0 -10 0 0 0 0 0 0 0 0 0 0 noon -10 0 0 0 0 0 0 0 0 0 0 0 0 0 0 1 D 0 0 0 0 0 0 0 0 0 0 0 0 0 0 10 0 0 0 0 0 0 0 0 0 0 o o o a 10 0 0 0 0 0 0 0 0 0 0 0 0 00 -10 0 0 0 0 0 0 0 0 0 0 0 0 0 D (c) (c0
Fig. 7 Assignment of values in the computer array for the URA patterns of Fig.6.
with JV>s = 2, and ATps = 4, respectively, where
is the number of fine sampling. The corresponding delta decoding patterns are shown Figs. 7(b') and 7(c'), respectively.
The results with different decoding patterns (Fig.7) are shown in Fig.8(a). The more is the number of fine sampling is increased, the sharper is the DPSF. Figure 8 shows that the tomographic resolution can be improved by the use of the fine
$54-'}-, 1997^ 57
sampling and delta decoding method.
Fig. 8. The depth poinl spread function; (a) pinhole size=c/4, (b) pinhole size=c/2.
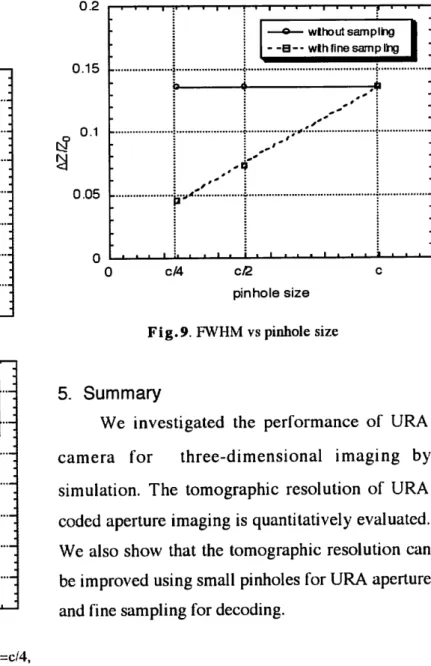
Furthermore, we show the results of URA aperture with pinhole of c/2 in Fig.8(b). As in Fig.8(a), the tomographic resolution is improved by the use of fine sampling (JVFs = 2 ), while there are
no improvements of resolution for JVps = 4. That
means the tomographic resolution is determined by the pinhole size of the aperture. The smaller is the pinhole size, the better is the tomographic resolution. The dependance of the tomographic resolution on the pinhole size and the fine sampling is illustrated in Fig.9. 0.2 0.15 0.1 0.05 -• n rf w ? • ■ ■ —o—wlhoutsamplhg 1 ■
--B--wth fine samp ling | '
..>.?!
i
■ ■ ■ ■
c/4 c/2
pinhole size
Fig.9. FWHM vs pinhole size
5. Summary
We investigated the performance of URA
camera for three-dimensional imaging by
simulation. The tomographic resolution of URA coded aperture imaging is quantitatively evaluated. We also show that the tomographic resolution can be improved using small pinholes for URA aperture and fine sampling for decoding.
References
[1] H.H Barrett and W.Swindell, Radiological Imaging, Academic Press, New York, 1981.
[2] E.E.Fenimore and T.M.Cannon, "Coded aperture imaging with uniformly redundant arrays", Appl. Opt., vol.17, no.3, pp.337-347, Feb. 1978.
[3] M.Harwit and N.J.A.Sloane, Hadamard Transform Optics, Academic Press, New York,
1979.
[4] E.E.Fenimore and T.M.Cannon,
"Tomographical imaging using uniformly redundant arrays", Appl. Opt., vol.18 no.7, pp. 1052-1057,
58 KISHIMOTO, CHEN, NAKAO: Tomographic Resolution of URA Coded Aperture Imaging and Its Enhancement
April 1979.
[5] Y.-W.Chen et al., "Three-dimensional reconstruction of laser-irradiated targets using URA coded aperture cameras", Opt. Comman., vol. 71, no. 5, pp.249-255, June 1989.
[6] K. Kishimoto, Y.-W. Chen et al., "A
quantitative evalution of URA coded aperture
imaging", Proc. ITC-CSCCV6, Vol.1,
pp.237-240, July 1996.
[7] E.E.Fenimore and T.M.Cannon, "Uniformly
redundant arrays: digital reconstruction methods", Appl. Opt., Vol.20 no. 10, pp. 1858-1864, May