Regional Cooperation of Small & Medium Firms in Japanese Industrial Clusters
著者 Arita Tomokazu, Fujita Masahisa, Kameyama Yoshihiro
権利 Copyrights 日本貿易振興機構(ジェトロ)アジア
経済研究所 / Institute of Developing
Economies, Japan External Trade Organization (IDE‑JETRO) http://www.ide.go.jp
journal or
publication title
IDE Discussion Paper
volume 18
year 2004‑12‑01
URL http://hdl.handle.net/2344/313
INSTITUTE OF DEVELOPING ECONOMIES
Discussion Papers are preliminary materials circulated to stimulate discussions and critical comments
DISCUSSION PAPER No. 18
Regional Cooperation of Small &
Medium Firms in Japanese Industrial Clusters*
Tomokazu Arita
(1, Masahisa Fujita
(2and Yoshihiro Kameyama
(3December 2004
Keywords: exports, information technology, FDI JEL classification: F15, O14, O30
* Director, East Asia Study Group, Area Studies Center, IDE ([email protected]) Abstract
This study examines the effects of intra-regional cooperation among firms and institutions on the growth of firms, using the unique data set of questionnaire survey collected in the three major industrial clusters in Japan. In contrast to the existing studies on regional innovations or agglomeration economies, this study explicitly focuses on the detailed contents of cooperative activities with two specific viewpoints: 1) the contents of regional cooperation in each of the three production stages of R&D, commercialization, and marketing, and 2) the detailed types of alliance partners. Our results demonstrate three points: 1) positive correlations are observed between the intensity of regional cooperation and the firm growth rate and R&D expenditure, 2) horizontal cooperation such as alliances with universities and cross-industry exchange organizations has positive significant effects on the growth rate of firms, which is in contrast with the previous studies that stressed only the role of vertically integrated inter-firm linkages in Japan, and 3) contents and partners of regional cooperation are different among the three clusters based on different dominant industries.
Keywords:Industrial clusters, industrial agglomeration, knowledge externalities, Japan
* This study is based on the data set from questionnaire survey conducted by “The Workshop of Industrial Cluster” organized by METI, in which the second author served as a member. We thank the workshop for the data set, and Shigehiro Yokoyama at the UFJ Research Institute for his help in processing the data.
(1 Institute of Policy and Planning Sciences, University of Tsukuba
(2 Institute of Economic Research, Kyoto University and Institute of Developing Economies, JETRO, Phone: (81-75) 753-7122, Fax (81-75) 753-7198, e-mail: [email protected]
(3 The International Centre for the Study of East Asian Development (ICSEAD)
The Institute of Developing Economies (IDE) is a semigovernmental, nonpartisan, nonprofit research institute, founded in 1958. The Institute merged with the Japan External Trade Organization (JETRO) on July 1, 1998.
The Institute conducts basic and comprehensive studies on economic and related affairs in all developing countries and regions, including Asia, Middle East, Africa, Latin America, Oceania, and East Europe.
The views expressed in this publication are those of the author(s). Publication does not imply endorsement by the Institute of Developing Economies of any of the views expressed.
INSTITUTE OF DEVELOPING ECONOMIES (IDE), JETRO 3-2-2, WAKABA,MIHAMA-KU,CHIBA-SHI
CHIBA 261-8545, JAPAN
©2004 by Institute of Developing Economies, JETRO
1. Introduction
In this paper, we present a novel attempt to show the effects of intra-regional horizontal cooperation among small and medium firms’ activities using unique data set from the questionnaire survey conducted in the three major industrial clusters in Japan.
The rise of importance of knowledge externalities suggests that the key of industrial agglomeration lies not only in the internal situation of a firm but also in the “external relation,” namely, the way of intra-regional cooperation in the industrial cluster.
According to Porter (1998, pp197.), an industrial cluster is defined as “geographic concentrations of interconnected companies, specialized suppliers, service providers, firms in related industries, and associated institutions (for example, universities, standards agencies, and trade associations) in particular fields that compete but also co-operate.” In this definition, there is a stipulation of an industrial cluster being “in particular fields.” However, it is assumed that an industrial cluster is not a sort of the industrial agglomeration observed in a company town or industrial complex where only localization economies work. In contrast, Porter’s cluster theory is formulated to stress on the role of innovation in industrial agglomeration, which is based on knowledge intensive activities, involving face-to-face communications among diverse knowledge workers. This paper attempts to explore directly the contents of knowledge externalities, and the way of intra-regional cooperation.
Historical speaking, almost all of the literature of industrial concentration originates in Marshall (1890), that pointed out the importance of geographic concentration of productive activities. More recently, Jacobs (1969) emphasized the importance of face-to-face communications in small and specialized districts within a city. Then, in the sense of Marshall, we could observe the effects of specialization in an industry. And, in the sense of Jacobs, we could observe the effects of diversity in the industries or the city. The studies about industrial externalities such as Glaeser, Kallal, Scheinkman and Shleifer (1992), and Henderson, Kuncoro and Turner (1995) have investigated which type of industrial externalities played an important role in the development of urban manufacturing industries. The new economic geography (Fujita, Krugman and Venables 1999) answers the reason of where the industrial concentration takes place and why in a general equilibrium model. However, these studies do not quest for the direct effects of innovation or knowledge externalities on industrial concentration.
The literature such as Audretsch and Feldman (1996), Varga (1998) and Acs (2002) investigated the geography of innovation focusing on university or R&D related institutions. Audretsch and Feldman (1996) found evidence that even if controlling the
degree of geographical concentration in production, the existence of industry R&D, university research and skilled labor in the neighborhood promote innovation through knowledge externalities. The results of estimation of Audretsch and Feldman (1996) also suggest that the propensity for innovative activities’ clustering is more attributable to the role of knowledge spillovers and not to mere geographical concentration of production. Varga (1998) also found evidence that expenditures of industry R&D and university research in neighborhood promote the innovation in the region concerned.
Acs (2002) revealed that university knowledge spillovers are not the only reason for high-technological clusters, and other forces for localization are quite strong. Then, following these studies, new detailed works investigated the effects of communication externalities (Charlot and Duranton (2003)) or human capital externalities (Moretti (2002), Ciccone and Peri (2002)) on the wage rate by handling micro level data set.
However, these previous studies have not considered explicitly the contents of communication externalities among institutions involved. There exist a few studies which have treated this topic. In fact, Saxenian (1994) suggested that in order to foster the sustainable development of industrial clusters, local, horizontal and flexible inter-firm networks among small and medium firms are generally more important than vertically integrated inter-firm relations mostly governed by large enterprises, and Porter (1990) also presented the similar arguments. In contrast, as Hashimoto (1997) insisted, vertically integrated inter-firm cooperation has been more commonly observed in industrial clusters than horizontal inter-firm networks in Japan. However, these studies are mainly descriptive and do not support their arguments with concrete statistical methods. We intend to examine the contents of regional cooperation with statistical methods.
In this paper, our unique data set of questionnaire survey, which handles individual firm-level data, enables us to identify the contents of vertical and horizontal cooperation in detail, including the styles and partners of cooperation, in each industrial cluster. This study examines the detailed contents of cooperative activities with two specific viewpoints: 1) the contents of regional cooperation based on the three production stages of R&D, commercialization and marketing, in which cooperation takes places, and 2) the detailed types of alliance partners. It has been commonly accepted that the intra-regional vertical cooperation has played an important role in Japanese regions. However, our identifying assumption is that practices of intra-regional cooperation in horizontal direction also promote firms’ growth through agglomeration economies based on knowledge externalities.
The reminder of the paper is organized as follows. The next section describes the
status of the three Japanese industrial clusters studied in this paper (i.e. Tama, Kinki and Hokkaido), and presents the descriptive statistics of questionnaire survey. Section 3 examines the significance of the intra-regional cooperation by using the results of correlation coefficients of questionnaire survey data. In Section 4 we study the effects of regional cooperation through the estimation of firms’ growth function. Section 5 concludes the paper.
2. The questionnaire survey on the three industrial clusters in Japan
In this paper, we investigate the effects of intra-regional cooperation on the activities of small and medium firms in Japanese industrial clusters by using the data set of questionnaire survey. Our data set of questionnaire survey comes from “Survey Questionnaires on Effects of Regional Networks on Corporate Activities and Management” conducted in 2002 by “The Workshop of Industrial Cluster,” which was organized by Ministry of Economy, Trade and Industry (METI). Recently, METI authorized nineteen regions of industrial clusters throughout Japan. Among the nineteen industrial clusters, the most matured three industrial clusters, Tama, Kinki and Hokkaido, were selected to investigate the actual conditions in details. Figure 1 shows the locations of the three clusters. This questionnaire survey was carried out in the last quarter in 2002 for the small and medium firms that voluntarily participate in the three regional organizations promoting the industrial clusters in Tama, Kinki and Hokkaido regions respectively1. To conduct the questionnaire survey, 1051 firms in Tama, 1025 firms in Kinki and 918 firms in Hokkaido were chosen somewhat randomly. The effective replies were 205 in Tama, 210 in Kinki and 194 in Hokkaido. Thus, the total number of samples in this study is 609. The geographical distribution of firms in each cluster that replied to the survey is shown in Figure 1. In this paper, the words of Tama, Kinki and Hokkaido represent the three industrial clusters designated by METI, not the entire regions.
[Insert Figure 1 around here]
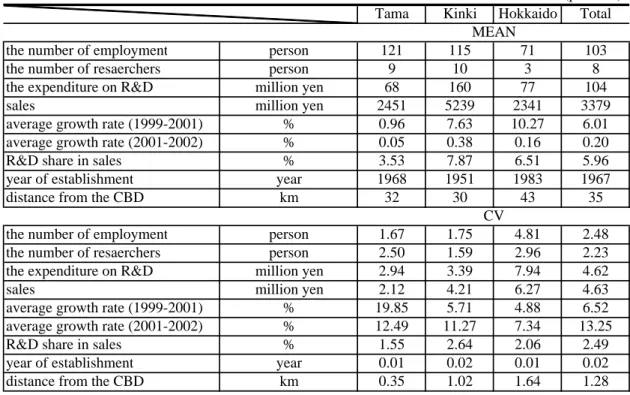
Appendix provides the detailed information on the most relevant part of questionnaire survey used in this paper. Besides qualitative data, the original data set contains the information on quantitative data about employment, researcher, sales, R&D share in sales, and year of establishment. Based on this questionnaire survey, the summary statistics of quantitative data are given in Table 1, which provides the relevant data per firm.
[Insert Table 1 around here]
The industrial cluster of Tama consists of firms in the cities in the west of Tokyo, Kanagawa and Saitama prefecture. The main industries of Tama are industrial machine (general machine) and machine of telecommunication2. The industrial cluster of Kinki is comprised of firms in the cities of Osaka, Kyoto, Hyogo, Nara, Wakayama and Fukui prefectures in the Osaka metropolitan area. The main industries of Kinki are biotechnological industries. The industrial cluster of Hokkaido is comprised of firms that belong to the cities of Hokkaido prefecture. The main industries of Hokkaido those industries related to information technology (IT).
As shown in Table 1, the mean firm size measured by employment in Tama is the largest among the three clusters, and the variation coefficient of firm size in Hokkaido is the largest. The mean R&D expenditure in sales in Kinki is the largest, and the variation coefficient of R&D expenditure in sales in Hokkaido is the largest. The mean annual growth rates in Kinki and Hokkaido are higher than that in Tama, but the variation coefficient of mean annual growth rate in Tama is the largest. Finally, the mean firm age measured by year of establishment in Kinki is in the early of 1950s, which is older than those of Tama (in the late of 1960s) and Hokkaido (in the early of 1980s).
We measure the distance from each firm to each city hall of the central business district in the three industrial clusters3. The maximum distance is about 63.0 km in Tama, about 166.9 km in Kinki and about 351.4 km in Hokkaido. The mean of distance indicates that many firms in Kinki show a tendency to locate at specific districts, for example, Chuo ward in the city of Osaka. In contrast, many firms in Hokkaido have tendencies to locate far from Chuo ward in the city of Sapporo. However, the coefficient of variation shows that the firms in Tama are more concentrated than those in the other regions, and the firms in Hokkaido are more spatially spread out than those in the other regions.
3. Significance of the intra-regional cooperation
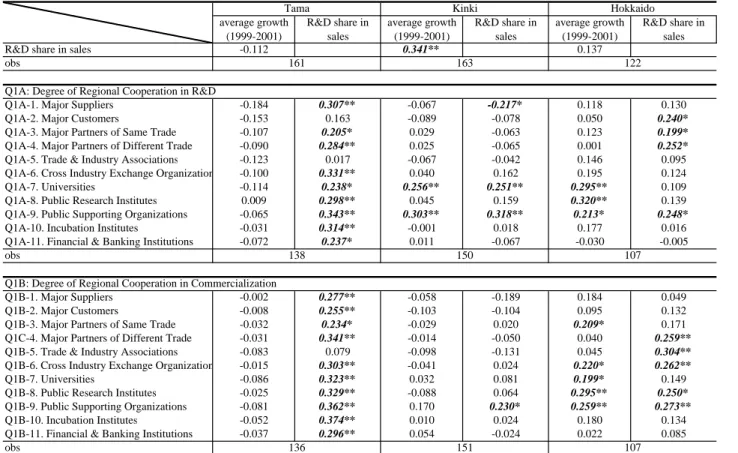
In this section, we examine the significance of intra-regional cooperation, by observing the correlations of the questionnaires data. Both Table 2 and 3 are the matrix of correlation coefficients between the growth rates of firms measured by the firm’s sales, R&D investment share in sales, and each qualitative data in three regions individually.
3.1. The degree of intra-regional cooperation in each production stage
In question 1(Q1), we have obtained the information about the degree of intra-regional cooperation with other firms and institutions in the three production stages of A (R&D), B (Commercialization) and C (Marketing). Table 2 presents correlation coefficients between the measures of firm performance and cooperative activities in Q1. Broadly speaking, we may observe the similar features regardless of the production stage of A, B and C. However, the results are different among the three regions.
[Insert Table 2 around here]
First, we observe Tama’s correlation coefficients. Concerning Tama’s growth rate, regardless of the production stage of A, B and C, no correlation is significant. With regard to Tama’s R&D investment of sales, the correlations for Suppliers, Partners of Same Trade, Partners of Different Trade, Cross Industry Exchanges, Universities, Public Research Institutes, Public Supporting Organizations, Incubation Institutions and Financial & Banking Institutions are significant, 0.307, 0.205, 0.284, 0.331, 0.238, 0.298, 0.343, 0.314 and 0.237 respectively on the production stage of A. On the production stage of B, the correlations for Suppliers, Customers, Partners of Same Trade, Partners of Different Trade, Cross Industry Exchanges, Universities, Public Research Institutes, Public Supporting Organizations, Incubation Institutions and Financial &
Banking Institutions are significant, 0.277, 0.255, 0.234, 0.341, 0.303, 0.323, 0.329, 0.362, 0.374 and 0.296 respectively. On the production stage of C, the correlations for Customers, Cross industry Exchanges, Universities, Public Research Institutes, Public Supporting Organizations and Incubation Institutions are significant, 0.252, 0.303, 0.439, 0.409, 0.351 and 0.310 respectively. To summarize the major characteristics of Tama, as to R&D investment of sales, there are positive significant correlations on almost all related institutions. These results hold true for the stage A or B, and means that firms with positive regional cooperation in Tama tend to carry out more investment on R&D, regardless of the production stage of A, B and C.
Second, we observe Kinki’s correlation coefficients. Concerning Kinki’s growth rate, the correlations for Universities and Public Supporting Organizations are significant, 0.256 and 0,303 on the production stage of A. On the production stage of B, no correlation is significant. And, on the production stage of C, the correlation for Public Supporting Organizations is significant, 0.310. With regard to Kinki’s R&D investment of sales, the correlations for Suppliers, Universities and Public Supporting
Organizations are significant are significant, -0.217, 0.251 and 0.318 on the production stage of A. On the production stage of B, the correlation for Public Supporting Organizations is significant, 0.230. On the production stage of C, no correlation is significant. To summarize the major characteristics of Kinki, as to growth rate, there are significant positive correlations on Universities and Public Supporting Organizations.
About R&D investment of sales, there is negative correlation on Suppliers, and are positive correlations on Universities and Public Supporting Organizations. These results hold true for stage A, and means that firms in Kinki are intent on practicing fundamental research with universities on the production stage of A (R&D).
Third, we observe Hokkaido’s correlation coefficients. Concerning Hokkaido’s growth rate, the correlations for Universities, Public Research Institutes and Public Supporting Organizations are significant, 0.295, 0.320 and 0.213 on the production stage of A. On the production stage of B, the correlations for Partners of Same Trade, Cross industry Exchanges, Universities, Public Research Institutes and Public Supporting Organizations are significant, 0.209, 0.220, 0.199, 0.295 and 0.259. On the production stage of C, the correlations for Partners of Different Trade, Cross Industry Exchanges, Universities and Public Research Institutes are significant, 0.214, 0.198, 0.202 and 0.209. With regard to Hokkaido’s R&D investment of sales, the correlations for Customers, Partners of Same Trade, Partners of Different Trade and Public Supporting Organizations are significant, 0.240, 0.199, 0.252 and 0.248 on the production stage of A. On the production stage of B, the correlations for Partners of Different Trade, Trade & Industry Associations, Cross Industry Exchanges, Public Research Institutes and Public Supporting Organizations are significant, 0.259, 0.304, 0.262, 0.250 and 0.273. On the production stage of C, the correlations for Cross Industry Exchanges, Universities, Public Research Institutes and Public Supporting Organizations are significant, 0.265, 0.248, 0.279 and 0.275. To summarize the major characteristics of Hokkaido, as to growth rate, there are significant positive correlations on Partners of Same Trade, Cross Industry Exchanges, Universities, Public Research Institutes and Public Supporting Organizations. About R&D investment of sales, there are also positive correlations on Partners of Same Trade, Partners of Different Trade, Cross Industry Exchanges and Public Supporting Organizations. These results hold true for the production stage of B and C, and means that firms in Hokkaido are intent on practicing applied research with alliance partners on the production stage of B and C.
In conclusion, we observe the different features in each region. Especially, the importance of the production stage is different for each region. Firms in Kinki have given high priority to the production stage of A. Tama attached great importance to the
production stages of A and B. Hokkaido has attached importance to the production stages of B and C. These results are derived from differences in development stages of each dominant industry in the three clusters, and those differences also have important influence on the styles and alliance partners of regional cooperation in industrial clusters.
3.2. Active exploration of new partners for intra-regional cooperation
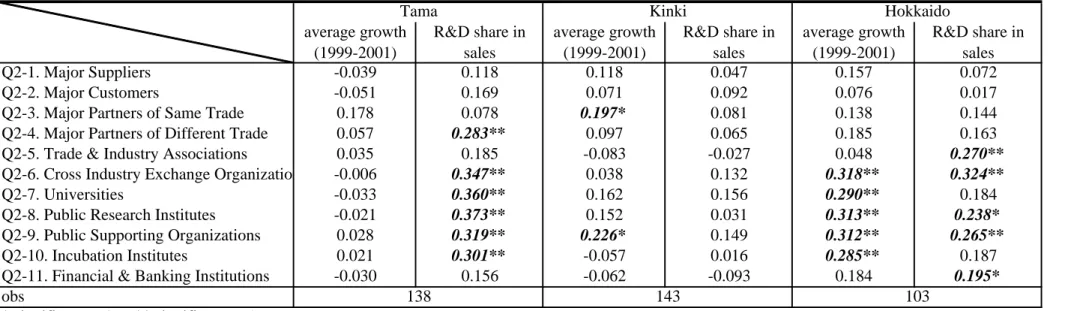
In question 2, we have got the information about the positive exploring new partners for intra-regional cooperation. Table 3 presents correlation coefficients about question 2 on the questionnaire survey.
[Insert Table 3 around here]
First, with regard to Tama’s growth rate, no correlation is significant. Concerning Tama’s R&D investment of sales, however, the correlations for Partners of Different Trade, Cross Industry Exchanges, Universities, Public Research Institutes, Public Supporting Organizations and Incubation Institutions are significant, 0.283, 0.347, 0.360, 0.373, 0.319 and 0.301. Second, with regard to Kinki’s growth rate, the correlation for Partners of Same Trade and Public Supporting Organizations are significant, 0.197 and 0.226. Concerning Kinki’s R&D investment of sales, no correlation is significant. Third, with regard to Hokkaido’s growth rate, the correlation for Cross Industry Exchanges, Universities, Public Research Institutes and Public Supporting Organizations, Incubation Institutions are significant, 0.318, 0.290, 0.313, 0.312 and 0.285. Concerning Hokkaido’s R&D investment of sales, the correlations for Trade & Industry Associations, Cross Industry Exchanges, Public Research Institutes, Public Supporting Organizations and Financial & Banking Institutions are significant, 0.270, 0.324, 0.238, 0.265 and 0.195.
In conclusion, our statistical work suggests that firms in each industrial cluster are likely to explore new partnership with Universities, Public Research Institutes and Public Supporting Organizations. Especially, the firms in the three clusters promote seeking new partners by cooperating with Public Supporting Organizations.
4. Effect of regional cooperation on firm’s growth of sales in industrial clusters In this section, we present the effect of regional cooperation on firm’s growth by estimating firm’s growth function. If productive factors such as labor and capital are the
“inside” factors of firm, we consider regional cooperation as the “outside” factors of
firm. Firm size and firm age are also among the inside factors of the firm. The stochastic model based on heuristics was supported by Jovanovic’s (1982) ‘learning model’.
Jovanovic’s model implies that firm growth is inversely related both with firm size and firm age. For example, we expect that smaller and younger firms tend to have higher growth rates. Some previous studies, such as McPherson (1996) and Audretsch, Klomp and Thurik (1999) investigated the effects of “inside” factors of firms on growth using the general model like this, G=g
[
Sizet,Aget]
+µt. After applying quantitative data of our questionnaire survey to the general model, we obtain the following basic model.2 4
2 3
2 1
0 ln ln (ln ) (ln )
) ln(
ln t t t t
t n
t Size Age Size Age
Sales Sales
G= + =α +α +α +α +α
t t
t Age
Size µ
α × +
+ 5(ln ln ) (1)
where G is a growth rate defined by firm’s annual sales, Sales. Size represents the firm size measured by the number of employees, Age is the firm age measured by establishment year, and t is time where t+1=2002, t=2001. We can obtain the information that the “term of firm size” has an influence on “term of firm age” by estimating the cross term, (lnSizet×lnAget). Using regression with robust standard error, we estimate equation (1)4.
[Insert Table 4 around here]
The top portion on the Table 4 shows the estimation results of the basic model using inside factors only. We see that the value of the R-square ranges from a low of 0.095 in Tama to a high of 0.431 in Kinki. We can observe that ‘inside’ factors of firm work stronger in Kinki than in Tama and Hokkaido. In addition to this basic model of the
‘inside’ factors of firm, McPherson (1996) highlighted the importance of agglomeration economies on firm’s growth. He argued that firm location determines firm’s growth rate, and that urban-based firms will grow faster than those located in rural area because of agglomeration externalities. We consider, however, that the evolution of transportation and telecommunication may help to overcome the difference between urban and rural area. In this sense, the statement argued by McPherson (1996) is not enough to explain the nature of agglomeration externalities in urban area. Consequently, it is important for our analysis to focus not only the “inside” factors of firm but also the “outside” factors as communication externalities among institutions involved. As mentioned in the previous sections, we use question 1 (See Appendix) as indices to measure the degree of
regional cooperation, and investigate the effects of regional cooperation on the growth of small and medium firms in our three industrial clusters by adding the terms of
nt
Cooperatio . Cooperationt is the dummy variables which represents the degree of regional cooperation given by each item of alliance partners in the questionnaire survey.
2 4
2 3
2 1
0 ln ln (ln ) (ln )
) ln(
ln t t t t
t n
t Size Age Size Age
Sales Sales
G= + =α +α +α +α +α
t t t
t Age Cooperation
Size α µ
α × + +
+ 5(ln ln ) 6( ) (2)
In addition, we suggest here an additive hypothesis; Agglomeration externalities imply that firms having positive motivation to cooperate with other institutions will grow stronger than firms without such motivation. If this hypothesis works well, the terms of
nt
Cooperatio reveal significantly positive sign to the firm’s growth. We use the answer of question 2 in Appendix as dummy variables in order to test this hypothesis. We want to know the effects of alliances with other institutions on the each production stage5.
The lower portion of top one on the Table 4 shows the estimation results of reformed specification with outside factors for alliances with other institutions6. We see that the value of the R-square ranges from 0.175 in Tama to 0.510 in Kinki. In comparison with using the basic model, the results of these estimations show much better fits.
First, we observe the estimation results of Tama. On the production stage of A, firms in Tama reveal positive significant sign on Cross Industry Exchange Organizations only. On the production stage of B, firms in Tama display positive significant signs on Cross Industry Exchange Organizations and Supporting &
Incubations (Public Supporting Organizations + Incubation Institutions). On the production stage of C, firms in Tama reveal positive significant signs on Customers and Cross Industry Exchange Organizations. As shown in Table 2, regarding the growth of sales, there is hardly any significance in correlation coefficients on the each production stage in Tama. In contrast, in these estimations, positive significant signs on Customers, Cross Industry Exchange Organizations and Supporting & Incubations (Public Supporting Organizations + Incubation Institutions) are noteworthy to stress the nature of cooperation style in the industries of Tama, which suggests the policies to foster the industrial cluster in Tama seem to be working well.
Second, we observe the estimation results of Kinki. On the production stage of A, firms in Kinki reveal positive significant sign on Universities & Institutes (Universities + Public Research Institutes) only. This result is reasonable since the main industries of
Kinki are biotechnological industries, and is generally consistent with the results of correlation coefficient analysis showed in Table 2. On the production stage of B, firms in Kinki also reveal positive significant sign on Universities & Institutes (Universities + Public Research Institutes) only. This result is reasonable because of the same grounds as mentioned on the production stage of A, but it is not consistent with the results of correlation coefficient analysis in Table.2. On the production stage of C, firms in Kinki reveal positive significant sign on Partners of Different Trade only. This result is not consistent with the results of correlation coefficient analysis showed in Table.2. This result may reflect well the nature of cooperation style in biotechnology industries, which vary according to the different production stages of A, B and C.
Finally, we observe the estimation results of Hokkaido. On the production stage of A, there is hardly any significance in coefficients variables on Cooperationt. This result is not consistent with the results of correlation coefficient analysis showed in Table 2. On the production stage of B, firms in Hokkaido reveal a positive significant sign on Customers only. This result, especially about negative signs, is consistent with the results of correlation coefficient analysis showed in Table 2. On the production stage of C, firms in Hokkaido reveal a positive significant sign on R&D Organizations (Universities + Public Research Institutes + Public Supporting Organizations + Incubation Institutions) only. This result, especially about positive signs, is generally consistent with the results of correlation coefficient analysis showed in Table 2.
In conclusion, the results indicate that the cooperative efforts have positive effects on the firm growth in each region with meeting specific demand of the each production stage. In particular, horizontal cooperation such as alliances with universities and cross-industry exchange organizations seem to be very important since they have positive significant effects on the firm growth. However, the styles of cooperative efforts corresponding to each production stage depend on the dominant industries of each region. Firms in Kinki are relatively affected by the “inside” situation on the each production stage, but still, are remarkably affected by Universities & Institutes (Universities + Public Research Institutes) as the “outside” factors in the more fundamental productive stage, for instance, on the productive stage of A and B. Firms in Tama and Kinki have important cooperation on the productive stage of B and C. Finally, It is seemed that the positive significant signs on Cross Industry Exchange Organizations, Universities & Institutes (Universities + Public Research Institutes) and R&D Organizations (Universities + Public Research Institutes + Public Supporting Organizations + Incubation Institutions) are notable since this result stress the policy role of promoting industrial clusters.
5. Concluding remarks
In this paper, we have investigated the regional cooperation of small and medium firms in three industrial clusters, Tama, Kinki and Hokkaido. We focus on what contents and channels of regional cooperation have affected the firm growth rate. To investigate the effect of such knowledge externalities, we use unique Japanese data set of questionnaire survey, including the qualitative data of the sorts of contents and channels on regional cooperation and some quantitative data around 600 firms in 2002.
Moreover, we have investigated the effects of alliances with other institutions on the each production stage of A (R&D), B (Commercialization) and C (Marketing). We also examined the effects of searching and developing intra-regional business partners or organizations for alliances.
Our results demonstrate three points: 1) positive correlations are observed between the intensity of regional cooperation and the firm growth rate and R&D expenditure, 2) horizontal cooperation such as alliances with universities and cross-industry exchange organizations has positive significant effects on the growth rate of firms, which is in contrast with the previous studies that stressed only the role of vertically integrated inter-firm linkages in Japan, and 3) contents and partners of regional cooperation are different among the three clusters based on to different dominant industries.
The differences on the production stage of industrial development have an important influence on the styles or partners of cooperation in industrial clusters. Firms are also willing to change the relationship of regional cooperation in order to keep the sustainable development. In either case, the results of estimation indicate that the cooperative efforts have positive effects on the firm growth.
Our conclusions give us two directions for future research. First, the most important problem is that the spatial unit of our data set of questionnaire survey is not defined by the same rule among the three regions, for example, MEA (Metropolitan Employment Area). Surely, the previous literature on the line of Porter’s cluster theory did not attach importance to the spatial units. If we deal with knowledge externalities further, we have to define the spatial unit of data set of questionnaire survey, in order to examine in detail the spatial extent of agglomeration externalities. Second, on the design of the questionnaire survey, we want to cut into the channels of trading the intermediate goods and final goods on knowledge externalities with a new theoretical framework estimating these topics.
Notes:
1. Some firms have taken place in the organization promoting the industrial cluster in each region; the other firms have not participated in.
2. These industries are the main industries in the Tama Industrial Cluster designated by the METI. The west region of Tokyo includes, of course, many other industries. The same note applies to Kinki and Hokkaido clusters.
3. In Tama, the most concentrated district of firms that replied on this questionnaire survey is the city of Sagamihara in Kanagawa prefecture. Tama is regarded as a part of Tokyo metropolitan area, and the central business district of Tokyo metropolitan area is considered to be the Chiyoda ward in Tokyo prefecture, judging from the highest density of the daytime population by municipality in Tokyo metropolitan area. The distance between the city of Sagamihara and the Chiyoda ward is about 45 km or 1 hour by local train. In Kinki, the most concentrated district of firms that replied to this questionnaire survey is the Chuo ward in the city of Osaka. The central business district of Osaka metropolitan area is considered to be the Chuo ward, city of Osaka on Osaka prefecture, judging based on the same criteria as the case of Tama. Then, Chuo ward in the city of Osaka is regarded as the same center for both Osaka metropolitan area and Kinki industrial cluster. In Hokkaido, the most concentrated district of firms that replied to this questionnaire survey is Chuo ward in the city of Sapporo in Hokkaido prefecture.
The central business district of Sapporo metropolitan area is the Chuo ward in the city of Sapporo in Hokkaido prefecture. Then, like Kinki we may regard Chuo ward in the city of Sapporo as the same center for both Sapporo metropolitan area and Hokkaido industrial cluster.
4. The estimators estimated by regression with robust estimator are independent of the assumption that heteroscedasticity on error term, and no correlation between error term and parameters. Under the conditions that these assumptions are not satisfied, using regression with robust estimator allows us to estimate unbiased estimator.
5. And, the item of “often” on question 1 is selected to do.
6. We face higher correlations between parameters as the dummy variables and thus we use Universities & Institutes (Universities + Public Research Institutes) and Supporting
& Incubations (Public Supporting Organizations + Incubation Institutions) as the new aggregated dummy variables.
References:
Acs, Z.J. (2002) Innovation and the Growth of Cities, Edward Elgar Publishing.
Audretsch, D.B. and Feldman, M.P. (1996) “R&D Spillovers and the Geography of Innovation and Production,” American Economic Review, 86(3), 630-640.
Audretsch, D.B., Klomp, L. and Thurik, A.R. (1999) “Do Services Differ from Manufacturing? The Post-entry Performance of Firms in Dutch Services,” in Audretsch, D. and Thurik, A.R. (ed.), Innovation, Industry Evolution, and Employment, Cambridge University Press, 230-252.
Charlot, S. and Duranton, G. (2003) “Communication Externalities in Cities,” CEPR discussion paper, 4048.
Ciccone, A. and Peri, G. (2002) “Identifying Human Capital and Externalities: Theory with an Application to US Cities,” CEPR discussion paper, 3350.
Fujita, Masahisa, Krugman, P., and Venables, A.J., (1999) The Spatial Economy, The MIT Press.
Glaeser, E. L., Kallal, H. D., Scheinkman, J. A. and Shleifer, A. (1992) “Growth in Cities,” Journal of Political Economy, 100, 1126-1152.
Hashimoto, T. (1997) “Nihon-gata Sangyou-Shuseki Saisei no Houkou,” in Kiyonari, T. and Hashimoto, T. (ed.), Nihon-gata Sangyou-Shuseki Saisei no Miraizou, Nihon Keizai Shinbunsha, Tokyo (in Japanese).
Henderson, J. V., Kuncoro, A. and Turner, M. (1995) “Industrial Development in Cities,” Journal of Political Economy, 103, 1067-1090.
Jacobs, J. (1969) The Economy of Cities, Random House, New York.
Japan Small and Medium Enterprise Agency (ed.), (2002) Chushou Kigyo Hakusho, Gyosei, Tokyo (in Japanese), White Paper on Small and Medium Enterprises in Japan: The Age of the Local Entrepreneur-Birth, Growth and Revitalization of the National Economy, English translated by Japan Small Business Research Institute,
(http://www.chusho.meti.go.jp/hakusyo/h14/download/2002english_WP.pdf)
Jovanovic, B. (1982) “Selection and Evolution of Industry,” Econometrica, 50, 649-670.
Marshall, A. (1890) Principles of Economics, Macmillan (8th ed. Published in 1920).
Mcpherson, M. A. (1996) “Growth of Micro and Small Enterprises in Southern Africa,” Journal of Development Economics, 48, 253-277.
Moretti, E. (2002) “Estimating the Social Return to Higher Education: Evidence from Longitudinal and Repeated Cross-Sectional Data” NBER working paper, No. W9108.
Porter, M. (1990) The Competitive Advantage of Nations, Free Press, New York.
Porter, M. (1998) On Competition, Harvard Business School Press.
Saxenian, A. (1994) Regional Advantage: Culture and Competition in Silicon Valley and Route 128, Harvard University Press, Cambridge, MA.
Varga, A. (1998) University Research and Regional Innovation: A Spatial Econometric Analysis of Academic Technology Transfers, Kluwer Academic Publishers, Boston.
Table 1. Summary Statistics of Questionnaire Data (Per firm )by Cluster
(per firm) Tama Kinki Hokkaido Total
the number of employment person 121 115 71 103
the number of resaerchers person 9 10 3 8
the expenditure on R&D million yen 68 160 77 104
sales million yen 2451 5239 2341 3379
average growth rate (1999-2001) % 0.96 7.63 10.27 6.01
average growth rate (2001-2002) % 0.05 0.38 0.16 0.20
R&D share in sales % 3.53 7.87 6.51 5.96
year of establishment year 1968 1951 1983 1967
distance from the CBD km 32 30 43 35
the number of employment person 1.67 1.75 4.81 2.48
the number of resaerchers person 2.50 1.59 2.96 2.23
the expenditure on R&D million yen 2.94 3.39 7.94 4.62
sales million yen 2.12 4.21 6.27 4.63
average growth rate (1999-2001) % 19.85 5.71 4.88 6.52
average growth rate (2001-2002) % 12.49 11.27 7.34 13.25
R&D share in sales % 1.55 2.64 2.06 2.49
year of establishment year 0.01 0.02 0.01 0.02
distance from the CBD km 0.35 1.02 1.64 1.28
MEAN
CV
Table 2. Correlation Matrix between Firm performances and Cooperative Acticities in Q1
R&D share in sales -0.112 0.341** 0.137
obs
Q1A: Degree of Regional Cooperation in R&D
Q1A-1. Major Suppliers -0.184 0.307** -0.067 -0.217* 0.118 0.130
Q1A-2. Major Customers -0.153 0.163 -0.089 -0.078 0.050 0.240*
Q1A-3. Major Partners of Same Trade -0.107 0.205* 0.029 -0.063 0.123 0.199*
Q1A-4. Major Partners of Different Trade -0.090 0.284** 0.025 -0.065 0.001 0.252*
Q1A-5. Trade & Industry Associations -0.123 0.017 -0.067 -0.042 0.146 0.095
Q1A-6. Cross Industry Exchange Organization -0.100 0.331** 0.040 0.162 0.195 0.124
Q1A-7. Universities -0.114 0.238* 0.256** 0.251** 0.295** 0.109
Q1A-8. Public Research Institutes 0.009 0.298** 0.045 0.159 0.320** 0.139
Q1A-9. Public Supporting Organizations -0.065 0.343** 0.303** 0.318** 0.213* 0.248*
Q1A-10. Incubation Institutes -0.031 0.314** -0.001 0.018 0.177 0.016
Q1A-11. Financial & Banking Institutions -0.072 0.237* 0.011 -0.067 -0.030 -0.005
obs
Q1B: Degree of Regional Cooperation in Commercialization
Q1B-1. Major Suppliers -0.002 0.277** -0.058 -0.189 0.184 0.049
Q1B-2. Major Customers -0.008 0.255** -0.103 -0.104 0.095 0.132
Q1B-3. Major Partners of Same Trade -0.032 0.234* -0.029 0.020 0.209* 0.171
Q1C-4. Major Partners of Different Trade -0.031 0.341** -0.014 -0.050 0.040 0.259**
Q1B-5. Trade & Industry Associations -0.083 0.079 -0.098 -0.131 0.045 0.304**
Q1B-6. Cross Industry Exchange Organization -0.015 0.303** -0.041 0.024 0.220* 0.262**
Q1B-7. Universities -0.086 0.323** 0.032 0.081 0.199* 0.149
Q1B-8. Public Research Institutes -0.025 0.329** -0.088 0.064 0.295** 0.250*
Q1B-9. Public Supporting Organizations -0.081 0.362** 0.170 0.230* 0.259** 0.273**
Q1B-10. Incubation Institutes -0.052 0.374** 0.010 0.024 0.180 0.134
Q1B-11. Financial & Banking Institutions -0.037 0.296** 0.054 -0.024 0.022 0.085
obs
Q1C: Degree of Regional Cooperation in Marketing
Q1C-1. Major Suppliers 0.110 0.140 -0.079 -0.050 0.106 -0.024
Q1C-2. Major Customers -0.056 0.252* -0.103 -0.085 0.111 0.147
Q1C-3. Major Partners of Same Trade 0.097 0.096 -0.046 -0.062 0.169 0.187
Q1C-4. Major Partners of Different Trade 0.062 0.196 -0.031 0.064 0.214* 0.073
Q1C-5. Trade & Industry Associations -0.066 0.071 -0.106 -0.022 0.065 0.127
Q1C-6. Cross Industry Exchange Organization -0.086 0.303** -0.060 0.065 0.198* 0.265**
Q1C-7. Universities 0.009 0.439** 0.118 -0.006 0.202* 0.248*
Q1C-8. Public Research Institutes 0.019 0.409** -0.047 -0.053 0.209* 0.279**
Q1C-9. Public Supporting Organizations 0.034 0.351** 0.310** 0.171 0.178 0.275**
Q1C-10. Incubation Institutes -0.100 0.310** 0.008 0.034 0.183 0.102
Q1C-11. Financial & Banking Institutions -0.034 0.139 -0.079 -0.073 0.136 0.086
obs
* significant at 1%, ** significant at 5%
138 149 110
Tama Kinki Hokkaido
average growth (1999-2001)
average growth (1999-2001)
average growth (1999-2001) R&D share in
sales
R&D share in sales
R&D share in sales
138 150 107
136 151 107
161 163 122
Table 3. Correlation Matrix between the Measures of Exploring New Networks in Q1 and Q2
Q2-1. Major Suppliers -0.039 0.118 0.118 0.047 0.157 0.072
Q2-2. Major Customers -0.051 0.169 0.071 0.092 0.076 0.017
Q2-3. Major Partners of Same Trade 0.178 0.078 0.197* 0.081 0.138 0.144
Q2-4. Major Partners of Different Trade 0.057 0.283** 0.097 0.065 0.185 0.163
Q2-5. Trade & Industry Associations 0.035 0.185 -0.083 -0.027 0.048 0.270**
Q2-6. Cross Industry Exchange Organization -0.006 0.347** 0.038 0.132 0.318** 0.324**
Q2-7. Universities -0.033 0.360** 0.162 0.156 0.290** 0.184
Q2-8. Public Research Institutes -0.021 0.373** 0.152 0.031 0.313** 0.238*
Q2-9. Public Supporting Organizations 0.028 0.319** 0.226* 0.149 0.312** 0.265**
Q2-10. Incubation Institutes 0.021 0.301** -0.057 0.016 0.285** 0.187
Q2-11. Financial & Banking Institutions -0.030 0.156 -0.062 -0.093 0.184 0.195*
obs
* significant at 1%, ** significant at 5%
R&D share in sales
average growth (1999-2001)
R&D share in sales
138 143 103
Tama Kinki Hokkaido
average growth (1999-2001)
R&D share in sales
average growth (1999-2001)
Table 4. The Influence of Cooperative Activities on Firm's Growth Dependent Variable: ln(Growth)
coef. t-value coef. t-value coef. t-value
lnSize 0.416 (1.640) -0.058 (0.520) -0.034 (0.420)
lnAge 0.026 (0.110) -1.403 (3.180)* -0.441 (2.300)*
lnSize2 -0.009 (0.400) -0.062 (2.500)* -0.005 (0.500)
lnAge2 0.052 (1.950)* 0.084 (2.100)* 0.042 (1.190)
lnCross -0.098 (2.810)* 0.167 (2.980)* 0.030 (1.590)
const. -0.877 (1.310) 2.736 (3.390)* 0.788 (3.250)*
R2 F statistics Prob > F
Q1A: Degree of Regional Cooperation in R&D
lnSize 0.471 (1.860) -0.039 (0.390) -0.033 (0.390)
lnAge -0.029 (0.120) -1.372 (2.990)** -0.485 (2.570)**
lnSize2 -0.019 (0.770) -0.066 (2.480)** -0.005 (0.480)
lnAge2 0.050 (1.730) 0.075 (1.670) 0.049 (1.440)
lnCross -0.085 (2.350)** 0.177 (2.950)** 0.032 (1.680)
Q1A-1. DM-Major Suppliers 0.076 (0.950) 0.033 (0.220) -0.147 (1.730)
Q1A-2. DM-Major Customers 0.092 (1.360) -0.017 (0.190) 0.145 (1.700)
Q1A-3. DM-Major Partners of Same Trade -0.063 (0.600) 0.111 (1.050) 0.104 (0.830) Q1A-4. DM-Major Partners of Different Trade -0.115 (1.040) -0.002 (0.020) 0.065 (0.470) Q1A-6. DM-Cross Industry Exchange Organizations 0.256 (2.280)** 0.190 (1.290) -0.263 (1.640) Q1A-7+8. DM-Universities & Institutes -0.079 (0.860) 0.204 (2.860)** 0.207 (0.920) Q1A-9+10. DM-Supporting & Incubations 0.209 (1.830) -0.224 (1.090) -0.001 (0.010) Q1A-11. DM-Financial & Banking Institutions -0.108 (1.210) -0.223 (1.470) -0.116 (0.940)
const. -0.939 (1.450) 2.549 (3.12)** 0.831 (3.600)**
R2 F statistics Prob > F
Q1B: Degree of Regional Cooperation in Commercialization
lnSize 0.524 (2.600)** 0.022 (0.250) -0.028 (0.310)
lnAge 0.326 (1.580) -1.393 (3.660)** -0.465 (2.410)**
lnSize2 -0.012 (0.660) -0.081 (2.920)** 0.000 (0.040)
lnAge2 0.027 (1.180) 0.067 (1.710) 0.056 (1.690)
lnCross -0.126 (3.510)** 0.195 (3.160)** 0.018 (1.070)
Q1B-1. DM-Major Suppliers 0.009 (0.200) -0.017 (0.120) -0.191 (1.850)
Q1AB. DM-Major Customers 0.039 (0.740) 0.018 (0.200) 0.215 (2.070)*
Q1B-3. DM-Major Partners of Same Trade 0.174 (1.520) -0.112 (0.860) 0.009 (0.060) Q1B-4. DM-Major Partners of Different Trade -0.222 (1.460) 0.124 (0.700) 0.040 (0.260) Q1B-6. DM-Cross Industry Exchange Organizations 0.299 (2.670)** -0.161 (0.600) -0.227 (0.460) Q1B-7+8. DM-Universities & Institutes -0.277 (1.460) 0.525 (2.260)** 0.389 (0.920) Q1B-9+10. DM-Supporting & Incubations 0.552 (2.640)** 0.420 (1.810) 0.198 (0.630) Q1B-11. DM-Financial & Banking Institutions 0.114 (1.240) -0.204 (1.020) -0.234 (1.090)
const. -1.614 (2.520)** 2.492 (3.890)** 0.755 (3.030)**
R2 F statistics Prob > F
Q1C: Degree of Regional Cooperation in Marketing
lnSize 0.517 (2.460)** -0.068 (0.630) -0.010 (0.120)
lnAge 0.047 (0.240) -1.417 (2.890)** -0.485 (2.450)**
lnSize2 -0.021 (1.160) -0.064 (2.610)** -0.003 (0.340)
lnAge2 0.046 (2.000)* 0.079 (1.650) 0.057 (1.650)
lnCross -0.092 (2.700)** 0.179 (3.120)* 0.023 (1.320)
Q1C-1. DM-Major Suppliers -0.112 (1.230) -0.109 (1.830) -0.119 (1.250)
Q1C-2. DM-Major Customers 0.215 (2.020)* 0.063 (1.230) 0.135 (1.240)
Q1C-3. DM-Major Partners of Same Trade 0.145 (0.710) 0.130 (1.550) -0.029 (0.290) Q1C-4. DM-Major Partners of Different Trade 0.020 (0.180) 0.213 (2.580)** -0.074 (0.900) Q1C-6. DM-Cross Industry Exchange Organizations 0.309 (2.740)** 0.064 (0.290) -0.333 (1.320) Q1C-7+8+9+10. DM-R&D Organizations 0.287 (1.650) 0.161 (0.930) 0.620 (2.960)**
Q1C-11. DM-Financial & Banking Institutions -0.096 (1.120) -0.238 (1.760) -0.051 (0.370)
const. -1.215 (1.910) 2.753 (3.040)** 0.740 (2.840)**
R2 F statistics Prob > F
Tama Kinki Hokkaido
0.095 0.431 0.149
F (5, 168) = 4.12 F (5, 178) = 3.08 F (5, 154) = 3.54
0.002 0.011 0.005
0.175 0.472 0.193
F (13, 160) = 2.52 F (13, 170) = 3.43 F (13, 146) = 2.85
0.004 0.000 0.001
0.192 0.510 0.231
F (13, 160) = 2.93 F (13, 170) = 2.69 F (13, 146) = 2.75
0.001 0.002 0.002
0.226 0.457 0.247
F (12, 161) = 3.39 F (12, 171) = 5.90 F (12, 147) = 2.58
0.000 0.000 0.004
Appendix
Survey Questionnaires on “Effects of Regional Networks on Corporate Activities and Management”
<1.Present State (Alliance / Utilization) of Regional Network>
Q1. To what extent do you ally with or utilize the intra-regional companies or organizations? In the following categories, please circle one appropriate option respectively.
If you have some experience of alliance or utilization (if you circle 1. or 2.), please also answer Q1-A, B and C.
*Please answer only on intra-regional cases. Do not include alliance with / utilization of out-of-regional companies / organizations.
A. Alliance or utilization for R&D.
(Circle one option among 1, 2 and 3 respectively.)
B. Alliance or utilization for Commercialization. (Circle one option among 1, 2 and 3 respectively.)
C. Alliance or utilization for Marketing. (Circle one option among 1, 2 and 3 respectively.) (note1)
Intra-Regional
1 Never
2 Some-
times
3 Often
1 Never
2 Some-
times
3 Often
1 Never
2 Some-
times
3
Often
1. Major Suppliers 1 2 3 1 2 3 1 2 3
2. Major Customers 1 2 3 1 2 3 1 2 3
3. Major Partners of Same Trade (excluding
suppliers and purchasers) 1 2 3 1 2 3 1 2 3
4. Major Partners of Different Trade(excluding
suppliers and customers) 1 2 3 1 2 3 1 2 3
5. Trade & Industry Organizations / Associations
1 2 3 1 2 3 1 2 3
6. Cross Industry Exchange Organizations (note
2) 1 2 3 1 2 3 1 2 3
7. Universities and Colleges 1 2 3 1 2 3 1 2 3
8. Public Research Institutes(note 3) 1 2 3 1 2 3 1 2 3 9. Public Supporting Organizations other than
Research Purposes (note 4) 1 2 3 1 2 3 1 2 3
10. Incubation Facilities(note 5) 1 2 3 1 2 3 1 2 3 11. Financial & Banking Institutions 1 2 3 1 2 3 1 2 3
(Note 2) Cross Industry Exchange / Industry Academia Government Collaboration Organizations:Such as Cross Industry Exchange Meets, Industrial Cluster Initiative Organizations and so on. (As for the specific names, see the attached.)
(Note 3) Public Research Institutes: Such as Prefectural Institute of Technology and so on.(As for the specific names, see the attached.)
(Note 4) Public Supporting Organizations other than Research Purposes: Prefectural and Municipal Supporting Organizations,General Supporting Organization for Small & Medium Enterprises and Ventures. (As for the specific names, see the attached.)
(Note 5) Incubation Facilities: Organizations which foster entrepreneurs. For entrepreneurs and for still young companies, the organizations lender various assistances, for instance, research laboratories and office rooms at a lower rent, necessary advices and information for business operation, and introducing human resources.(As for the specific names, see the attached.)
<2.Present State of Searching & Developing New Networks (Partners for Alliance and Utilization) >
Q2. Are you searching and developing intra-regional business partners or organizations for alliance or utilization in the following categories?
Please circle one appropriate option respectively.
*Please answer only on intra-regional cases. Do not include alliance with / utilization of out-of-regional companies / organizations.
Intra-Regional
1 None
2 Little
3 A Little
4 Much
1. Major Suppliers 1 2 3 4
2. Major Customers 1 2 3 4
3. Major Partners of Same Trade (excluding suppliers
and purchasers) 1 2 3 4
4. Major Partners of Different Trade(excluding
suppliers and customers) 1 2 3 4
5. Trade & Industry Organizations / Associations
1 2 3 4 6. Cross Industry Exchange Organizations 1 2 3 4
7. Universities and Colleges 1 2 3 4
8. Public Research Institutes 1 2 3 4
9. Public Supporting Organizations other than
Research Purposes 1 2 3 4
10. Incubation Facilities 1 2 3 4