Firm‑level trade creation and diversion of regional trade agreements in Thailand
著者 Hayakawa Kazunobu, Kimura Fukunari, Laksanapanyakul Nuttawut
権利 Copyrights 日本貿易振興機構(ジェトロ)アジア
経済研究所 / Institute of Developing
Economies, Japan External Trade Organization (IDE‑JETRO) http://www.ide.go.jp
journal or
publication title
IDE Discussion Paper
volume 621
year 2016‑11
URL http://hdl.handle.net/2344/1590
INSTITUTE OF DEVELOPING ECONOMIES
IDE Discussion Papers are preliminary materials circulated to stimulate discussions and critical comments
Keywords: RTA; Trade creation; Trade diversion; Thailand JEL classification: F15, F53
* Overseas Research Fellow, IDE ([email protected])
IDE DISCUSSION PAPER No. 621
Firm-Level Trade Creation and Diversion of Regional Trade Agreements in Thailand
Kazunobu HAYAKAWA*, Fukunari KIMURA, and Nuttawut LAKSANAPANYAKUL
November 2016
Abstract: Using highly detailed import data for Thailand, this paper examines firm-level trade creation and diversion of regional trade agreements (RTAs). Specifically, by focusing on firm-product pairs in which firms import a particular product from non-members but not from RTA members in the initial year of our sample, we empirically investigate the start of imports from RTA members under RTA schemes and the cessation of imports from non-members at the firm-level. We find that firms are more likely to stop importing products with low RTA tariff rates or high most-favored-nation tariff rates from non-members and to start importing such products from RTA member countries. However, from the quantitative point of view, there are very few firms that switch import sources from non-members to RTA members when facing the introduction of RTA schemes.
The Institute of Developing Economies (IDE) is a semigovernmental, nonpartisan, nonprofit research institute, founded in 1958. The Institute merged with the Japan External Trade Organization (JETRO) on July 1, 1998.
The Institute conducts basic and comprehensive studies on economic and related affairs in all developing countries and regions, including Asia, the Middle East, Africa, Latin America, Oceania, and Eastern Europe.
The views expressed in this publication are those of the author(s). Publication does not imply endorsement by the Institute of Developing Economies of any of the views expressed within.
INSTITUTE OF DEVELOPING ECONOMIES (IDE), JETRO 3-2-2, WAKABA,MIHAMA-KU,CHIBA-SHI
CHIBA 261-8545, JAPAN
©2016 by Institute of Developing Economies, JETRO
No part of this publication may be reproduced without the prior permission of the IDE-JETRO.
1
Firm-Level Trade Creation and Diversion of Regional Trade Agreements in Thailand
Kazunobu HAYAKAWA#§
Inter-disciplinary Studies Center, Institute of Developing Economies, Japan
Fukunari KIMURA
Faculty of Economics, Keio University, Japan
Nuttawut LAKSANAPANYAKUL
Science and Technology Development Program, Thailand Development Research Institute, Thailand
Abstract: Using highly detailed import data for Thailand, this paper examines firm-level trade
creation and diversion of regional trade agreements (RTAs). Specifically, by focusing on firm-product pairs in which firms import a particular product from non-members but not from RTA members in the initial year of our sample, we empirically investigate the start of imports from RTA members under RTA schemes and the cessation of imports from non-members at the firm-level. We find that firms are more likely to stop importing products with low RTA tariff rates or high most-favored-nation tariff rates from non-members and to start importing such products from RTA member countries. However, from the quantitative point of view, there are very few firms that switch import sources from non-members to RTA members when facing the introduction of RTA schemes.
Keywords: RTA; Trade creation; Trade diversion; Thailand JEL Classification: F15; F53
# Corresponding author: Kazunobu Hayakawa; Address: Wakaba 3-2-2, Mihama-ku, Chiba-shi, Chiba, 261-8545, Japan. Tel: 81-43-299-9500; Fax: 81-43-299-9724; E-mail:
§ We would like to thank Richard Baldwin, Kozo Kiyota, Taiji Furusawa, and participants at the Hitotsubashi Conference on International Trade and FDI and the Japan Society of International Economics for their invaluable comments. This work was supported by JSPS KAKENHI Grant Numbers 26220503 and 26705002. All remaining errors are ours.
2
1. Introduction
Trade creation and diversion have been key concepts in considering the economic effects of regional trade agreements (RTAs). Viner (1950) performed a pioneering study of these concepts, although they were discussed in the context of customs unions.
Originally, the trade creation effects refer to the start of product imports, which were previously not imported, from an RTA member country. Trade diversion means the stoppage of product imports from an RTA non-member country by starting to import these products from a member country instead. Such a switch may happen, even if the before-tax prices from the RTA non-members are cheaper than those from RTA members, because RTA members enjoy lower RTA preferential tariff rates than the general tariff rates (e.g., most-favored-nation (MFN) rates). Trade diversion has long been regarded as one of the consequences of the notorious “evils” associated with RTAs.
Researchers have tried to quantify these effects, since they play a crucial role in evaluating the total impact of RTAs.
There are several ex–post empirical studies on trade creation and diversion.1 These studies mostly estimate the gravity equation by employing aggregated trade data at the country level (or country-sector level). Recent examples include Soloaga and Winters (2001), Magee (2008), Carrere (2006), Dai et al. (2014), and Yang and Martinez-Zarzoso (2014). These studies differ, particularly by estimation techniques.
For example, while Carrere (2006) employs the Hausman–Taylor estimation technique, the multinomial Poisson maximum likelihood estimation is used in Yang and Martinez-Zarzoso (2014). These studies introduce various RTA dummy variables into gravity equations to differentiate the trade creation and trade diversion effects. In particular, Magee (2008) carefully defines these effects and quantifies their absolute values.2 As a result, Magee finds that the trade creation effect led to an increase in intra-bloc trade by 89% after RTAs were in place for 18 years and there was little evidence of trade diversion. Also, Cipollina and Salvatici (2010) conduct a meta-analysis of 85 such studies and conclude that trade creation effects exist and they
1 As summarized by Magee (2008), another strand is the ex-ante studies. A typical approach is a computable general equilibrium (CGE) model simulation. In particular, many studies based on CGE models use variations of the Global Trade Analysis Project (GTAP) model. Examples of this approach include Brown et al. (1995), Cox (1995), Sobarzo (1995), and the studies surveyed by Baldwin and Venables (1995). There are also some studies that employ a simpler approach, which is based on the partial equilibrium model. Those studies include Karemera and Ojah (1998), Wylie (1995), and Kreinin and Plummer (1992). Although the estimates in these studies are severely affected by the assumption of exogenous parameters such as demand elasticity, all papers show certain amounts of the absolute values derived from trade diversion.
2 Clausing (2001) directly examines the effects of tariff reduction through RTAs on trade.
3
are significant.
Against this backdrop, our paper is the first to examine trade creation and diversion at the firm level. A firm-level analysis provides microeconomic insights on trade creation and diversion. The Vinerian version is derived basically from a simplistic international trade model for a homogenous good under perfect competition. Thus, in the Viner model, we do not need to introduce any firm-level perspectives. However, a firm-level analysis clarifies the detailed effects of RTAs on firm-level imports that have never been investigated. This paper focuses on an interesting case from the viewpoint of trade creation and diversion, specifically on firm-product pairs, in which firms import a particular product from non-members but not from RTA members. In such firm-product pairs, we define firm-level trade creation as the start of imports from RTA members under RTA schemes. The firm-level trade diversion is simply defined as the termination of imports from RTA non-members.3 As mentioned above, this definition is slightly different from the Vinerian version’s definition of trade creation and diversion. For example, the original definition of trade creation refers to the start of product imports, which were formerly not imported at all. On the other hand, the target of our firm-level trade creation study is firms that used to import from non-members. In short, our interest lies in firm-level switching from the imports of a particular product from non-members to those from members under RTA schemes.
Specifically, using shipment-level import data for Thailand during the period 2007–2011, we quantitatively and qualitatively investigate such firm-(product-)level switching of import sources. Our quantitative analysis examines how much switching is observed in Thailand’s imports and presents some important findings, which cannot be obtained from country-level analyses of trade creation/diversion. For example, we can investigate whether new importers simply started their importing activities per se or switched their import sources from non-members to RTA members. Similarly, it is possible to examine whether the termination of imports from non-members was the result of simply stopping their importing activity per se or switching their import sources to RTA members. On the other hand, one objective of our qualitative analysis is to investigate the determinants of firm-level trade creation and diversion. In particular, we shed light on the roles of MFN rates and RTA rates in the importing country, i.e., Thailand. We present unique empirical evidence that these tariff rates have symmetric effects on firm-level trade creation and diversion, as defined above. In addition to such
3 More specifically, we define these firm-level trade creations and diversions at the firm-product level, but we use the terms firm-level trade creation and diversion for brevity.
4
“extensive margins” of imports from RTA members and non-members, we further investigate the role of “intensive margins,” i.e., the magnitude of imports from RTA members and non-members.
Our dataset enables us to identify the tariff schemes used for each import shipment.4 It covers all commodity imports for Thailand and includes information not only on firms, source countries, and commodities, but also on the tariff schemes (e.g., an RTA or MFN scheme) applied to these imports. Namely, as is consistent with the above definition on firm-level trade creation, we can identify whether a particular import from RTA members is under an RTA or MFN scheme. Regardless of either the Vinerian country-level version or our firm-level version, the reduction of tariff rates by introducing RTA preferential rates is a major source of “trade creation” for RTAs. Our dataset enables us not to include the start of imports from RTA members under MFN schemes as trade creation, which is not motivated by such tariff reductions. To the best of our knowledge, none of the above-mentioned country-level studies examine trade creation/diversion under different tariff schemes.
Our paper is related not only to the above-mentioned traditional literature on trade creation/diversion but also to some other types of literature. First, several papers have recently examined the mechanisms for the survival of international transactions (e.g., Besedes and Prusa, 2006a, 2006b; Gorg et al., 2012; Nitsch, 2009; Esteve-Perez et al., 2013; Gullstrand and Persson, 2015). These studies find, for example, that international transactions are likely to survive when they are related to exports by more productive firms, countries with larger GDPs, or geographically closer countries. In terms of analyzing the survival of imports from RTA non-members (i.e., firm-level trade diversion), our paper is related to this literature, but it is different in terms of analyzing the roles of RTA rates and MFN rates separately. Such differentiation is important because they have different effects on the survival of imports from non-members, as shown in this paper.
Second, our paper is also related to some firm-level studies on the choice of tariff schemes when exporting. These studies employ the data that can identify tariff schemes,
4 The aggregated version of trade data according to tariff schemes has been employed in several papers, including studies on the determinants of the utilization rates of preferential trade and the effects of preferential utilization on prices. The former kind of studies include Bureau et al. (2007), Cadot et al. (2006), Francois et al. (2006), Manchin (2006), and Hakobyan (2015). Those studies find that the utilization of preferential schemes is higher in the products with larger tariff margins, larger volumes, and less restrictive rules of origin. Examples of the latter kind are Cadot et al. (2005), Olarreaga and Ozden (2005), and Ozden and Sharma (2006), which find the rise of export prices after RTA schemes are utilized.
5
such as preferential schemes or MFN schemes. Employing these unique survey data, for example, Takahashi and Urata (2010) and Hayakawa (2015) examine the role of firm size in terms of the number of employees. By employing the firm-level data on the Generalized System of Preferences (GSP) utilization for exporting apparel products to Europe from Bangladesh, Cherkashin et al. (2015) structurally estimate their model on the firms’ choice of tariff schemes. However, these studies only focus on trade with partner countries in terms of preferential schemes and thus do not shed light on trade diversion. Also, although the datasets used in these studies do not include trade for all firms and industries, our dataset covers all commodity trade in Thailand.
Third, there are some studies on the effects of tariff reductions on extensive and intensive margins. For example, employing product-level import data in the United States, Debaere and Mostashari (2010) examine changes in the effect of tariff reductions on the extensive margin (positive exports or zero) and find that tariff reductions have a small effect on the extensive margin relative to the overall growth in international trade.
Buono and Lalanne (2012) show the significant role of tariff rates on the number of exporters (extensive margin) and exports per firm (intensive margin) in France. On the other hand, we investigate the role of tariff rates on the firm-(product/country)level probability of importing (extensive margin) and firm-(product/country)level imports (intensive margin). Furthermore, we differentiate between the roles of RTA rates and MFN rates, particularly for the extensive margins. As mentioned above, we will show that these tariff rates have different effects on the start of imports from RTA members and the termination of imports from non-members.
The rest of the paper is organized as follows. The next section provides our conceptual framework on firm-level trade creation and diversion. Section 3 introduces our dataset and then provides an overview of firm-level trade creation and diversion in Thailand. Indeed, we believe that Thailand is a suitable importing country in which to examine the effects of RTAs on imports. As stated in Section 3, Thailand and the Association of Southeast Asian Nations (ASEAN), of which Thailand is a member, have actively terminated RTAs with countries outside ASEAN since the latter half of the 2000s, which represents our sample period. As a result, Thailand’s imports from RTA partner countries under RTA schemes grew rapidly during that period. In Section 4, we report the results for our econometric analyses. Section 5 concludes.
2. Conceptual Framework
This section discusses how MFN rates and RTA preferential rates affect the start
6
and exit of imports from RTA members and non-members. To simplify our discussion, we examine a firm’s imports of a homogenous product, in which the market structure represents perfect competition. That product is imported from two groups of countries:
RTA non-member countries and future RTA member countries. We consider the imports at two time points. RTA is not available at the initial time, but RTA schemes are available at the later time.
The possible unit import prices of product i at time t are given by 𝑃𝑛𝑛𝑛𝑀𝑀𝑀= (1 +𝑀𝑀𝑀𝑛𝑛)𝑝𝑛𝑛,
𝑃𝑚𝑛𝑛𝑀𝑀𝑀= (1 +𝑀𝑀𝑀𝑛𝑛)𝑝𝑚𝑛,
𝑃𝑚𝑛𝑛𝑅𝑅𝑅= (1 +𝑅𝑅𝑅𝑛𝑛+𝐶𝐶𝐶𝑝𝐶𝐶𝐶𝐶𝐶𝐶)𝑝𝑚𝑛.
PS indicates the import price under tariff scheme S (i.e., an RTA scheme or an MFN scheme). MFN and RTA are MFN rates and RTA preferential rates, respectively.
Subscripts n and m refer to non-member countries and member countries, respectively. p indicates c.i.f. prices (prices inclusive of costs, insurance, and freight), which are assumed to be time-invariant. For simplicity, we assume that the compliance costs of the rules of origin (Compliance) enter in an ad valorem fashion against c.i.f. prices.
To consider the effects of tariffs, we categorize the import structure of firms into four cases, based on the import status at the initial time, as shown in Table 1. The first case is that a firm does not import a product from either member or non-member countries at the initial time. We do not discuss this case, since it is unfeasible to empirically examine all of the possible import patterns. Namely, since this case requires us to investigate non-importers at the initial time, we cannot investigate a particular set of firms. Similarly, sets of products and export countries cannot be restricted either. As a result, even if some firms to be examined can be specified, we need to examine whether or not such firms start importing each of all products from each of all countries through changes in the tariff rates. Such an analysis is empirically unfeasible.5
=== Table 1 ===
The second case is that a firm imports a product from member countries but not
5 This difficulty may be the reason why there are few empirical studies on the determinants of the start of firm/country/product-level trade. In contrast, as listed in the introductory section, there are several studies on the determinants of exit because we can only restrict the estimation sample to the firm/country/product pairs that existed at the initial time. When examining the start of firm/country/product-level trade, some restrictions are necessary. For example, Fontagné et al.
(2015) examine the firm/destination/product-level export probability by restricting the sets of firms and destination countries, and analyzing at the HS four-digit level rather than at the tariff line–level.
7
from any non-member countries. This case emerges when, even under the initial level of MFN rates, production costs and thus c.i.f. prices are lower for the product from member countries than those from non-member countries, i.e., pni > pmi. In this case, the introduction of RTA preferential rates only encourages firms to continue importing that product from member countries. If MFN rates are sufficiently high or RTA rates are sufficiently low, the applied tariff scheme for imports from RTA members changes from MFN to RTA. However, it does not generate imports from non-member countries, because pni > pmi. The same is true for any change or level of the MFN rates. In short, the firms’ import patterns do not change in this case.
The interesting case is the third one, in which a firm does not import a product from any member countries, but it does import a product from non-member countries.
This case becomes dominant if c.i.f. prices are lower in the product from non-member countries than those from member countries, i.e., pni < pmi. In this case, the firm imports that product from either non-member countries under an MFN scheme or member countries under an RTA scheme, depending on the level of MFN and RTA rates. In particular, if the RTA rates are sufficiently low compared with the MFN rates (including the compliance costs), the firm will start importing that product from member countries under an RTA scheme and stop importing from non-member countries. Namely, firm-level trade creation and diversion emerge. On the other hand, lower MFN rates will discourage such firms from switching the origin of their imports.
The last case is that a firm imports a product from both member and non-member countries. Under the above setting, this case simply emerges if the c.i.f. prices are the same between products from member and non-member countries, i.e., pni = pmi. While the reduction of MFN rates does not change the initial import pattern, low RTA rates would encourage firms to stop importing from non-member countries and to switch their applied tariff schemes for imports from member countries from MFN to RTA.6
Our empirical analysis basically focuses on the interesting case, i.e., the third case.
Indeed, as mentioned above, it is unfeasible to empirically examine the first case.
Furthermore, in the second case, tariff rates play a role of only strengthening the initial import pattern. On the other hand, in the third case, we will see firm-level trade creation and diversion at the same time through changes in the tariff rates. In particular, as
6 Furthermore, when assuming that this product is differentiated, this case will emerge if import prices from both types of countries are not sufficiently high and not very different. Also, if the product is not sufficiently differentiated, lower RTA rates may discourage the importing firms to continue their imports from non-member countries. On the other hand, low MFN rates may encourage the continuation of not only imports from non-member countries but also imports from member countries under MFN schemes.
8
mentioned above, symmetric patterns of tariff effects will emerge. Low RTA rates have positive and negative effects on the start of imports from member countries and the continuation of imports from non-member countries, respectively. In contrast, low MFN rates have the opposite effects. Also, it is feasible to empirically examine this case because we can restrict importers to those who imported from non-members but not from any RTA members, in the initial year. The products to be examined can also be restricted to those that were imported from non-members in the initial year. Lastly, the fourth case is also investigated, to some extent, in our empirical analysis.
3. Data Overview
This section provides an overview of firm-level trade creation and diversion in Thailand. After introducing our dataset, we will show that very few firms switch their import source countries from RTA non-members to RTA members.
3.1. Data Source
Our dataset is obtained from the Customs Office, Kingdom of Thailand. It represents transaction-level import data from 2007 to 2011 and covers all commodity imports in Thailand. In our sample period, we retain the consistency of the Harmonized Commodity Description and Coding System (HS) version for the product classification, i.e., HS2007. Our dataset includes the customs clearing date, HS eight-digit code, export country, firm identification code, tariff scheme (e.g., RTA, MFN, etc.), and import values in Thai baht (THB). We use the import data aggregated by years, in addition to the source countries, HS eight-digit codes, firms, and tariff schemes. We classify the tariff schemes into three categories, including the MFN and RTA schemes, as well as other schemes. The tariff payment for imports under “other schemes” is exempted on the basis of five categories: bonded warehouses, free zones, investment promotion, duty drawback for raw materials imported for the production of exports, and duty drawback for re-exportation.7
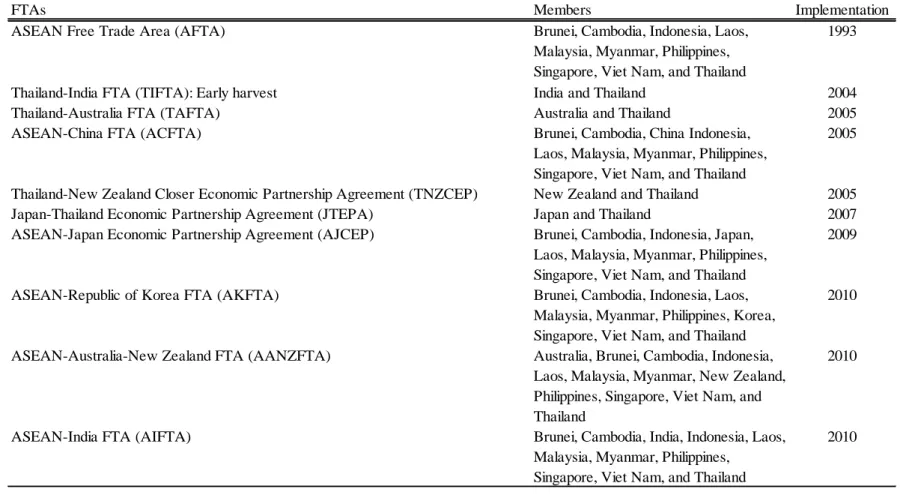
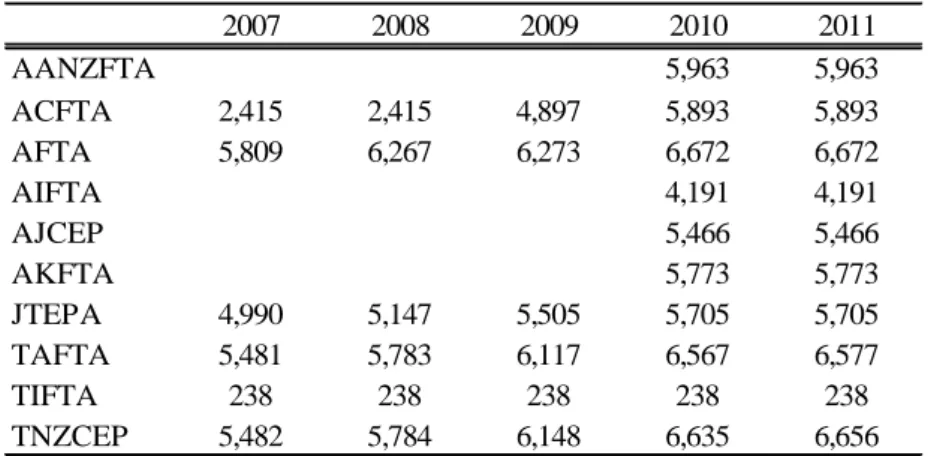
As listed in Table 2, Thailand has ten RTAs in our sample period, most of which overlap in terms of their country coverages. Thailand has not only bilateral but also plurilateral RTAs with Japan, Australia, New Zealand, and India. With the members of ASEAN, of which Thailand is also a member, Thailand has at least five RTA schemes.
In this paper, we call the following 15 countries “RTA member countries”: Korea, China,
7 See Appendix A for these five categories within “other schemes.”
9
Japan, India, Philippines, Vietnam, Cambodia, Laos, Myanmar, Malaysia, Indonesia, Brunei, Singapore, New Zealand, and Australia. Except for Korea, where Thailand concluded an RTA in 2010, all of these countries have been RTA partner countries with Thailand at least since the beginning of our sample period, i.e., 2007. The other countries are called “RTA non-member countries.”8
=== Table 2 ===
Although Thailand has had RTAs earlier than our sample period, the significant use of RTA schemes for Thailand’s imports only started during our sample period.
Figure 1 reports the imports under RTA schemes, in addition to their share of total imports. In this figure, the samples are restricted to observations in which any RTA rates are lower than MFN rates in 2007. In 2007, imports under RTA schemes remained at a small magnitude. The share of total imports was less than 1%. However, both the magnitude and share of imports under RTA schemes dramatically increased since 2008.
The share rises to 16% in 2008 and to 31% in 2011. In sum, our sample period is the period when Thailand started to increase its imports under RTA schemes.
=== Figure 1 ===
3.2. Overview: Quantitative Analysis
We start from an overview of firm-level trade creation. Table 3 decomposes Thailand’s imports in 2011. For example, total imports are disaggregated into imports from non-members (i) and imports from members (ii). The latter imports represent approximately 60% of total imports in 2011. The case of (iv) shows that, among the imports from members, those in “eligible products” are larger. In this table, the eligible products are defined as products in which the RTA rates are lower than the MFN rates in
8 More precisely, all products do not necessarily have lower RTA rates than MFN rates in any RTAs.
Furthermore, it depends on the RTAs and thus on the export countries which products can be exported to Thailand under lower RTA rates than MFN rates. Also, RTA preferential rates for some products become available many years after the RTAs have been in force. In this sense, “RTA member countries” should be classified by not only country but also by product and year. However, such a classification is too complicated from which to examine trade creation/diversion. Thus, we simply classify imports according only to the country of origin. However, in our econometric analysis, we impose some restrictions on exporter-product pairs based on RTA eligibility. The number of products with RTA rates lower than MFN rates, i.e., the number of eligible products, is reported in Appendix B. In this appendix, we also provide the product-level distributions of MFN rates, the lowest RTA rates, and their differences, i.e., the preference margin in 2009.
10
2011. Otherwise, the products are categorized as “ineligible products.” If multiple preference schemes are available (e.g., ASEAN-Japan Comprehensive Economic Partnership (AJCEP) and Japan-Thailand Economic Partnership Agreement (JTEPA) when importing from Japan), the lower preferential rates are used in this categorization.
The imports of eligible products from RTA members under RTA schemes only represent about 10% of total imports.
=== Table 3 ===
We further decompose the imports of eligible products from RTA members under RTA schemes in 2011. In the cases of (viii) and (ix), we identify whether or not such imports existed in 2007 (the start year of our dataset). We find that almost all of such imports did not exist in 2007. On the other hand, as shown in the case of (x), most of the RTA users that did not import from members also did not import from non-members in 2007. In other words, such firms are new importers during this period rather than switchers of import source countries from non-members to members. The switching importers can be found in the case of (xiii), which represents only 1% of all imports in Thailand. In sum, at least during our sample period, there are few firms that started to import a product from RTA members under RTA schemes by stopping their imports of that product from non-members, i.e., there was little firm-level trade creation. Almost all (future) RTA users were new importers (x).
Next, we provide an overview of firm-level trade diversion in Table 4. As in Table 3, we decompose imports in 2007 and find that the share of imports from non-members was 40% (ii), which is the same as in 2011. Among these imports, 15% are in eligible products (iv). In this table, the eligible products are defined as those in which the preferential tariffs under at least one of the RTAs are lower than the MFN rates in any year during the period 2007–2011. For such imports of eligible products from non-members, we focus on those under MFN schemes (vi). Such imports from non-members under MFN schemes represent approximately 10% of total imports.
About 40% of these imports (i.e., 4% of the 10%) are by firms that did not import the same products from members in 2007 (viii). And in this case, approximately 60% of these imports disappeared in 2011 (x). Almost all transactions categorized in (x) are by firms that also did not import from members in 2011 (xi). Namely, most of the firms that stopped importing from non-members did not start importing from members.
Rather, they stopped their importing activity per se rather than switching their import sources.
11
=== Table 4 ===
4. Econometric Analysis: Qualitative Analysis
This section conducts econometric analyses of firm-level trade creation and diversion. As mentioned in Section 2, we focus on firm-product pairs, in which firms import a particular product from non-members but not from RTA members in the initial year, i.e., case (iii) in Section 2. In particular, we examine the roles of RTA rates and MFN rates on the start of imports from RTA members under RTA schemes and the exit of imports from non-members.
4.1. Trade Creation
Setting the initial year as 2007, we examine the existence of imports from RTA members during the period 2008–2011. Specifically, we restrict the sample firm-product pairs to those that imported from any non-members, but did not import from RTA members, in 2007. Then, we examine whether a firm engages in importing a particular product from each member in each year under RTA schemes. We exclude the import transactions under the other schemes. The products are restricted to those in which the available RTA rates are lower than the MFN rates when importing from a certain member country in a certain year.9
Our empirical model of firm choice for imports and utilizing RTA schemes is specified as follows. To take into consideration the fact that RTA users are always importers, we employ the Heckman probit model, whose framework is provided in Van de Ven and Van Praag (1981). The selection equation describes the firms’ decisions on whether or not to import a product from a member country in a particular year:
𝑦𝐼𝑀∗ ≡max{𝜋𝑀𝑀𝑀,𝜋𝑅𝑅𝑅} = 𝐳𝐳+𝑢𝐼𝑀, 𝑦𝐼𝑀 = �1 if 𝑦𝐼𝑀∗ > 0
0 if 𝑦𝐼𝑀∗ ≤0. (1) For simplicity, we omit firm, product, export country, and year subscripts. πMFN and πRTA are gross profits from importing under MFN and RTA schemes, respectively. A vector z includes various elements that affect gross import profits. A vector γ indicates the coefficients to be estimated. Namely, this equation indicates that firms choose to import if the gross profits from importing under either an MFN scheme or an RTA
9 If a firm imports from members under multiple schemes, we only use the observations for the scheme with the largest import values.
12
scheme become positive. uIM is a disturbance term.
The elements in a vector z are selected on the basis of the simple conceptual framework in Section 2. The profits from importing from a particular member country will not be independent from the profits from importing from other member and non-member countries. In other words, it depends on the characteristics of all export countries. However, we simply assume that a vector z mainly includes MFN and RTA rates. These two kinds of tariff rates may have a more direct association with the imports from non-members and members, respectively, although the import profits from each country are simultaneously determined.10 As discussed in Section 2, we expect that higher MFN rates or lower RTA rates encourage firms to import from RTA members.
We also introduce a log of export costs per container for the export country in order to control for the fixed costs of exporting on the export side.11
Then, the resulting equation describes the firms’ decision on whether to use an MFN scheme or an RTA scheme:
𝑦𝑅𝑅𝑅∗ ≡ 𝜋𝑅𝑅𝑅− 𝜋𝑀𝑀𝑀 =𝐱𝐱+𝑢𝑀𝑅𝑅, 𝑦𝑀𝑅𝑅 =�1 if𝑦𝑅𝑅𝑅∗ > 0,𝑦𝐼𝑀∗ > 0 0 if𝑦𝑅𝑅𝑅∗ ≤0,𝑦𝐼𝑀∗ > 0. (2) A vector x includes the various elements that affect the difference between gross import profits under RTA and MFN schemes, and it is assumed to mainly include the preference margin. The larger margin will encourage firms to import under RTA schemes rather than under MFN schemes, as found in previous studies on the determinants of RTA utilization rates.12 We also introduce a log of the fees for the issuance of certificates of origin (CoOs) in the export country in order to control for the fixed costs of utilizing an RTA on the export side.13 A vector β indicates the coefficients to be estimated. uFTA is a disturbance term. This equation indicates that firms choose to import under RTA schemes if the associated gross profits are greater than those under MFN schemes. The disturbances in these two equations are assumed to be as follows:
𝑢𝐼𝑀~𝑀(0,1), 𝑢𝑅𝑅𝑅~𝑀(0,1), corr(𝑢𝐼𝑀,𝑢𝑅𝑅𝑅) =𝜌. (3) In addition, as the control variables in both of the z and x vectors, we include a log of total global imports at the firm-product level (ln total imports), a firm-level
10 If multiple preference schemes are available, the lower preferential rates are used for the import observations under an MFN scheme. For the import observations under RTA schemes, we use preferential rates in the corresponding RTA schemes.
11 Fixed export costs will have a significant effect on importers’ profits if we take into consideration the matching between exporters and importers. See, for example, Sugita et al. (2015).
12 See footnote 4.
13 We do not introduce this variable into the selection equation, because of its high correlation with the export costs per container. Also see footnote 11.
13
dummy variable taking the value one if a firm becomes engaged in exporting (export dummy), a log of GDP, and a log of the geographical distance between the export country and Thailand. The former two firm-level variables are one-year lagged.14 Also, we include year fixed effects to control for the import country’s specific time-variant elements, such as demand size, for both vectors. Since our variable for CoOs fees is a time-invariant export country–specific variable, we do not include fixed effects for the exporting countries. Also, the export costs per container do not change much over time.
Similarly, the reason for not including product fixed effects is because MFN rates, which are one of our main variables, do not change for almost all products (99%) during our sample period. The nature of this variable also implies that our estimation results for MFN rates come from the variations across products, not over time.15
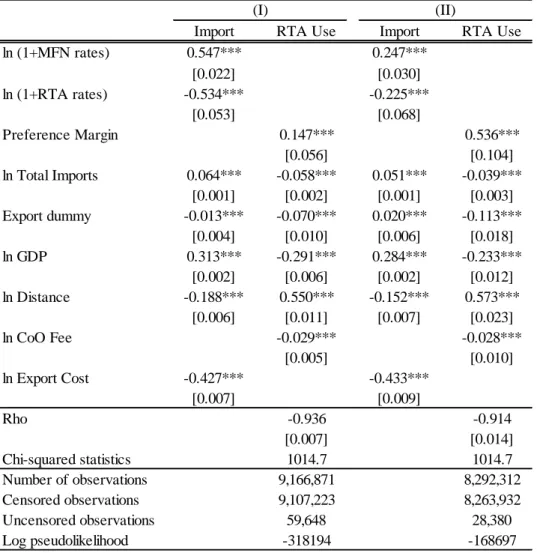
The results are reported in column (I) in Table 5. We can find the significant results in “Rho,” indicating the existence of selection bias in the estimates of the RTA use equation when estimating this equation using a simple probit model rather than a Heckman probit model. In the equation for imports, the coefficients for RTA and MFN rates are significantly negative and positive, respectively, which is consistent with our prior expectations. Namely, lower RTA rates or higher MFN rates encourage firms to start importing from RTA members. In the equation of RTA use, the coefficient for the preference margin is estimated to be significantly positive, as is also consistent with our expectations. Namely, when starting to import products with a larger preference margin for RTA members, firms are more likely to use RTA schemes than MFN schemes.
=== Table 5 ===
The results for the other variables are as follows. First, firms are more likely to import from RTA members with lower export costs and then to utilize RTA schemes when importing from RTA members with the lower CoO fees. Second, larger-sized firms in terms of total imports are more likely to import from RTA members, but they are less likely to utilize RTA schemes when importing. Although we did not consider the
14 When specifying firm-level characteristics, we must rely on customs data-based measures, since we do not have information on turnovers, employment, or capital for the universe of Thai importers.
15 All firm-level data, in addition to the data of MFN rates, are obtained from Customs, Kingdom of Thailand, as used in the previous section. The data on GDP, which is deflated by the GDP deflator, are drawn from the World Development Indicator. We obtain the data on geographical distance from the CEPII website. The data on export costs per container and CoOs fees are drawn from the Doing Business Database at the World Bank and Table 1 in Hayakawa et al. (2015). The basic statistics for our sample are provided in Appendix D.
14
existence of fixed costs for switching import sources in Section 2, larger-sized firms may be more likely to afford paying such costs. However, the result for RTA utilization is puzzling. When using RTA schemes when importing, firms only need to submit the CoOs prepared by the exporting firms to customs. Namely, importers always prefer to use an RTA if the exporters can afford to use an RTA scheme. Nevertheless, it is unclear why smaller-sized firms are more likely to utilize RTA schemes when importing. Third, another puzzling result is that non-exporters are more likely to import from RTA members and then to utilize RTA schemes. Fourth, firms are more likely to import from RTA members that are larger economically (i.e., in terms of GDP) or from the less distant members, but they are less likely to utilize RTA schemes when importing from such RTA members.
We present one kind of robustness check on the above results. In the above analysis, we employ balanced panel data on imports from each RTA member by year.
For example, the dataset includes observations for all years (i.e., 2008–2011) for each firm/product-RTA member country pair, even if the positive imports in the corresponding pair appear in the middle year (e.g., 2009) and disappear in a later year (e.g., 2010).16 However, the decision process by firms may be different before and after the first imports from members (at least in our sample period) begin. Therefore, in this robustness check, we drop the firm-product pairs from the estimation sample after those pairs record the first positive imports from any RTA member. The results are reported in column (II) in Table 5 and show the qualitatively same results as those in column (I).17
4.2. Trade Diversion
Next, we examine the cessation of imports from non-members. Specifically, we examine whether the import transactions from non-members by firms importing a product from a non-member country, but not from any member countries in 2007, continue to exist during the period 2008–2011. The products are restricted to those in which the preferential rates of at least one RTA are lower than the MFN rates, as of 2008. We estimate a simple probit model on the above-mentioned existence of import transactions from non-member countries. As in the above case for trade creation, the import profits from non-members are not independent from the import profits from RTA members.18 Again, we simply assume that the explanatory variables in this probit model
16 See Appendix C1, which introduces the structure of our dataset for trade creation.
17 Appendix E reports the results of examining the start of imports from RTA members for the fourth case in Section 2. The results are similar to those reported in this subsection.
18 In this sense, the disturbance in the model specified in (1) may be correlated with that in this
15
are the same as the z vector, except for the log of the export costs that was used as one of the excluded variables in the analysis on trade creation. Another noteworthy difference is that the lowest RTA rates among all of the available RTAs in Thailand are used as the variable for RTA rates.
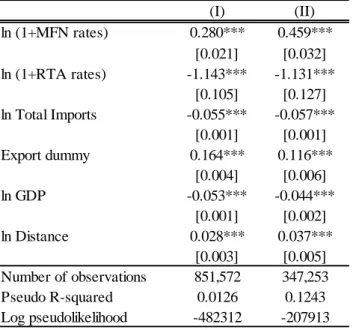
The results are reported in column (I) of Table 6. As is consistent with our discussion in Section 2, the coefficient for MFN rates is estimated to be significantly positive, indicating that firms are more likely to stop importing products with higher MFN rates from non-members. In contrast, RTA rates have a significantly negative coefficient. Namely, firms are more likely to stop importing products with lower RTA rates. In Table 6, we find that firms are more likely to start importing from RTA members in the case of products with higher MFN rates or lower RTA rates. In particular, the larger difference between MFN rates and RTA rates encourages firms to import from RTA members under RTA schemes. Combining these results with those for imports from members, we could say that firms are more likely to switch import sources from non-members to members under RTA schemes when importing products with higher MFN rates or lower RTA rates.
=== Table 6 ===
The other results are as follows. First, the significantly negative coefficient for
“Total Imports” indicates that the larger-sized importers are better able to cope with various kinds of idiosyncratic shocks (e.g., demand shocks on the import countries) and thus they will continue importing from non-members. Second, the coefficient for the
“Export dummy” is significantly positive. In the analysis for trade creation, we find a significantly negative coefficient for this variable. Therefore, we can say that exporters are more likely to exit from the import market per se rather than to switch import sources. Third, as found by Besedes and Prusa (2006b), the coefficient for the exporter’s GDP is significantly negative. A larger GDP in the export countries leads to the lower uncertainty of demand in their home countries and thus enables the exporters to continue devoting their productive resources to export activities. Last, the coefficient for distance is significantly positive, which is consistent with the result by Nitsch (2009).
Trading with more distant countries obviously increases the uncertainty of the fixed trade costs and may discourage firms from continuing to trade.
probit model, according to the firm-product pairs. However, we simply make separate estimates of these two models on trade creation and diversion.
16
As in the case of trade creation, we present one kind of robustness check on the above results. Namely, we drop the firm-product pairs after they record their first import exit from any non-members because the decision-making process by firms may be different before and after the first such exit (at least in our sample period).19 The results are reported in column (II) in Table 6 and they show the same qualitative results as those in column (I). In particular, the coefficients for the MFN and RTA rates are estimated to be significantly positive and negative, respectively.20
4.3. Intensive Margin
In this subsection, we examine the magnitude of imports from RTA members under RTA schemes and those from RTA non-members.21 The former magnitude is explored by estimating the Heckman model. The selection equation is formalized, as in the outcome equation for the analysis of trade creation in Section 4.1. Namely, imports from an RTA member under RTA schemes can only be observed if the gross profits from importing under RTA schemes are greater than those from importing under MFN schemes. As in Section 4.1, this relationship is specified as follows.
𝐱𝐱+𝑢𝐸𝐸𝑛𝐸𝑛𝐸𝑛𝐸𝐸 > 0. (4) Again, we omit firm, product, export country, and year subscripts for simplicity. The outcome equation is a simple linear equation:
ln Imports =𝐳𝐳+𝑢𝐼𝑛𝑛𝐸𝑛𝐸𝑛𝐸𝐸. (5) The dependent variable is the natural log of imports from an RTA member under RTA schemes. Here we do not include the log of export costs per container in the z vector, because the fixed costs for exports are not expected to affect the intensive margin (Helpman et al., 2008). Also, the MFN rates are not included in this analysis of the imports under RTA schemes in order to focus on the effect of corresponding tariff rates on the intensive margin.22
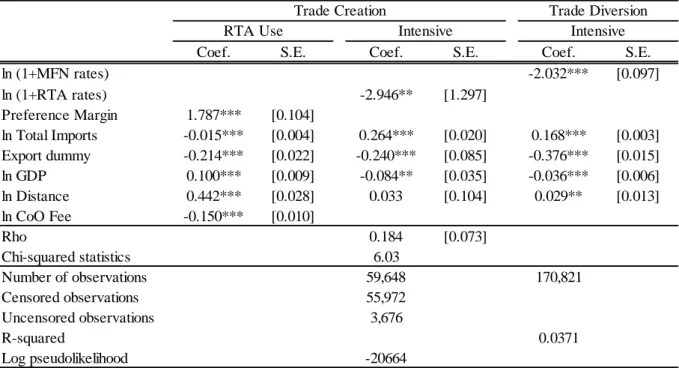
The results are shown in the “Trade Creation” column in Table 7. The most important result in the outcome equation (i.e., “Intensive”) is that the RTA rates have a significantly negative coefficient. Namely, the imports of products with lower RTA rates
19 See Appendix C2, which introduces the structure of our dataset for trade diversion.
20 Appendix E reports the results of examining the exit of imports from RTA non-members for the fourth case in Section 2. The results are similar to those reported in this subsection.
21 We again focus on firms that import a particular product from non-members but do not import from RTA members, i.e., case (iii) in Section 2.
22 Furthermore, for simplicity, we do not take into account the selection on whether or not to import in the estimation (i.e., the model specified in (1)) and the existence and magnitude of imports from non-members. The same is also true for the model that examines the intensive margin when importing from non-members.
17
are larger. The noteworthy results for the other variables are as follows. First, in the selection equation (i.e., “RTA Use”), GDP has a significantly positive coefficient, unlike the case of the outcome equation in Table 5, which takes into account the selection of importing. Namely, our results for the export country’s GDP in RTA utilization are not robust and they are unclear. Furthermore, the coefficient for GDP is significantly negative in the outcome equation. This result is not consistent with the typical results for gravity studies, though the dimension of analysis is different (i.e., firm-product level versus national level). Second, the significantly positive coefficient for “Total Imports”
under “Intensive” will be a natural result.
=== Table 7 ===
Next, the magnitude of imports from non-members is examined by estimating the above outcome equation by the ordinary least squares (OLS) method. However, in contrast to the above analysis, RTA rates are not included in this analysis on the imports from non-members. Instead, we introduce MFN rates into the z vector. The results are reported in the “Trade Diversion” column of Table 7. Naturally, the coefficient for MFN rates is estimated to be significantly negative, indicating that the imports of products with lower MFN rates are larger. The other variables have coefficients similar to the case of “Trade Creation” in terms of signs.
5. Concluding Remarks
Using highly detailed import data for Thailand, this paper examined firm-level trade creation and diversion of RTAs. Specifically, by focusing on firms that imported a particular product from non-members but not from RTA members in the initial year, we empirically investigated the start of imports from RTA members under RTA schemes and the cessation of imports from non-members at the firm level. Our findings can be summarized as follows. Economic mechanisms work in the firm-level trade creation and diversion of RTAs. Namely, firms are more likely to stop importing products from non-member RTA countries with lower RTA rates or higher MFN rates and to start importing such products from RTA member countries. The magnitude of firm-level imports from RTA members and non-members is larger when importing products with lower RTA rates and lower MFN rates, respectively.
However, from the quantitative point of view, there are very few firms that switch import sources from non-members to RTA members. Most future RTA users are new
18
importers, i.e., firms that had never imported from either RTA members or non-members. Also, most of the firms that stopped importing from non-members do not start importing from members; instead, they stop their importing activity per se. In sum, firm-level switching of import sources rarely happens. Switching from non-members to members directly reduces the imports from non-members, whereas a rise in imports from members by new importers (at least directly) does not occur, though it may discourage existing importers to continue importing from non-members. Therefore, our result denoting only a few “switching importers” may be one of the reasons why existing studies at a country level do not find significant trade diversion, though it is unclear as to how far the results for Thailand can be generalized.
19
References
Baldwin, R.E. and Venables, A. J., 1995, Regional Economic Integration, in Grossman G.M. and K. Rogoff eds., Handbook of International Economics, Volume 3, North-Holland, 1597-1644.
Besedes, T. and Prusa, T., 2006a, Ins, Outs, and the Duration of Trade, Canadian Journal of Economics, 39(1), 266-295.
Besedes, T. and Prusa, T., 2006b, Product Differentiation and Duration of US Import Trade, Journal of International Economics, 70(2), 339-358.
Brown, D.K., Deardorff, A.V., and Stern, R.M., 1995, Estimates of a North American Free Trade Agreement, in Kehoe P.J. and Kehoe T.J. (eds.), Modeling North American Integration, Kluwer Academic Publishers, Dordrecht.
Buono, I. and Lalanne, G., 2012, The Effect of the Uruguay Round on the Intensive and Extensive Margins of Trade, Journal of International Economics, 86(2), 269-283.
Bureau, J., Chakir, R., and Gallezot, J., 2007, The Utilisation of Trade Preferences for Developing Countries in the Agri-food Sector, Journal of Agricultural Economics, 58(2): 175-198.
Cadot, O., Carrere, C., de Melo, J., Portugal-Perez, A., 2005, Market Access and Welfare under Free Trade Agreements: Textiles under NAFTA, World Bank Economic Review, 19(3), 379-405.
Cadot, O., Carrere, C., d Melo, J., and Tumurchudur, B., 2006, Product-specific Rules of Origin in EU and US Preferential Trading Arrangements: An Assessment, World Trade Review, 5(2): 199-224.
Carrere, C., 2006, Revisiting the Effects of Regional Trade Agreements on Trade Flows with Proper Specification of the Gravity Model, European Economic Review, 50(2), 223-247.
Cherkashin, I., Demidova, S., Kee, H., and Krishna, K., 2015, Firm Heterogeneity and Costly Trade: A New Estimation Strategy and Policy Experiments, Journal of International Economics, 96(1), 18-36.
Cipollina, M. and Salvatici, L., 2010, Reciprocal Trade Agreements in Gravity Models:
A Meta-Analysis, Review of International Economics, 18, 63-80.
Clausing, K., 2001. Trade Creation and Trade Diversion in the Canada–United States Free Trade Agreement, Canadian Journal of Economics, 34, 677–696.
Cox, D.J., 1995, An Applied General Equilibrium Analysis of NAFTA’s Impact on Canada, in Kehoe P.J. and Kehoe T.J. (eds.), Modeling North American Integration, Kluwer Academic Publishers, Dordrecht.
20
Dai, M., Yotov, V.Y., and Zylkin, T., 2014, On the Trade-diversion Effects of Free Trade Agreements, Economics Letters, 122, 321-325.
Debaere, P. and Mostashari, S., 2010, Do Tariffs Matter for the Extensive Margin of International Trade? An Empirical Analysis, Journal of International Economics, 81, 163-169.
Esteve-Perez, S., Requena-Silvente, F., Pallardo-Lopez, V. J., 2013, The Duration of Firm-Destination Export Relationships: Evidence from Spain, 1997-2006, Economic Inquiry, 51(1): 159-180.
Francois, J., Hoekman, B., and Manchin, M., 2006, Preference Erosion and Multilateral Trade Liberalization, World Bank Economic Review, 20(2), 197–216.
Gorg, H., Kneller, R., and Murakozy, B., 2012, What Makes a Successful Export?
Evidence from Firm-product-level data, Canadian Journal of Economics, 45(4), 1332–1368.
Gullstrand, J. and Persson, M., 2015, How to Combine High Sunk Costs of Exporting and Low Export Survival, Review of World Economics, 151(1): 23-51.
Hakobyan, S., 2015, Accounting for Underutilization of Trade Preference Programs:
U.S. Generalized System of Preferences, Canadian Journal of Economics, 48(2).
Hayakawa, K., 2015, Does Firm Size Matter in Exporting and Using FTA Schemes?, Journal of International Trade and Economic Development, 24(7), 883-905.
Hayakawa, K., Laksanapanyakul, N., and Urata, S., 2015, Measuring the Costs of FTA Utilization: Evidence from Transaction-level Import Data of Thailand, ERIA Working Papers DP-2015-38, Economic Research Institute for ASEAN and East Asia.
Helpman, E., Melitz, M., Rubinstein, Y., 2008, Estimating Trade Flows: Trading Partners and Trading Volumes, Quarterly Journal of Economics, 123(2), 441-487.
Karemera, D. and Ojah, K., 1998, An Industrial Analysis of Trade Creation and Diversion Effects of NAFTA, Journal of Economic Integration, 13, 400–425.
Kreinin, M. and Plummer, M., 1992, Effects of Economic Integration in Industrial Countries on ASEAN and the Asian NIEs, World Development, 20(9), 1345-1366.
Fontagné, L., Orefice, G., Piermartini, R., and Rocha, N., 2015, Product Standards and Margins of Trade: Firm-level Evidence, Journal of International Economics, 97(1), 29-44.
Magee, C., 2008, New Measures of Trade Creation and Trade Diversion, Journal of International Economics, 75, 349-362.
Manchin, M., 2006, Preference Utilisation and Tariff Reduction in EU Imports from ACP Countries, The World Economy, 29(9): 1243-1266.
21
Nitsch, V., 2009, Die Another Day: Duration in German Import Trade, Review of World Economics, 145(1), 133-154.
Olarreaga, M. and Ozden, C., 2005, AGOA and Apparel: Who Captures the Tariff Rent in the Presence of Preferential Market Access?, The World Economy, 28(1), 63-77.
Ozden, C. and Sharma, G., 2006, Price Effects of Preferential Market Access: Caribbean Basin Initiative and the Apparel Sector, World Bank Economic Review, 20(2), 241-259.
Sobarzo, H.E., 1995, A General Equilibrium Analysis of the Gains from NAFTA for the Mexican Economy, in Kehoe P.J. and Kehoe T.J. (eds.), Modeling North American Integration, Kluwer Academic Publishers, Dordrecht.
Soloaga, I. and Winters, L., 2001, Regionalism in the Nineties: What Effect on Trade?, North American Journal of Economics and Finance, 12, 1-29.
Sugita, Y., Teshima, K., and Seira, E., 2015, Assortative Matching of Exporters and Importers, Mimeo.
Van de Ven, W.P.M.M. and Van Praag, B.M.S., 1981. The Demand for Deductibles in Private Health Insurance: A Probit Model with Sample Selection, Journal of Econometrics 17, 229-252.
Viner, J., 1950, The Customs Union Issues, Carnegie Endowment for International Peace, New York.
Wylie, P., 1995, Partial Equilibrium Estimates of Manufacturing Trade Creation and Diversion due to NAFTA, North American Journal of Economics & Finance, 6, 65–84.
Yang, S. and Martinez-Zarzoso, I., 2014, A Panel Data Analysis of Trade Creation and Trade Diversion Effects: The Case of ASEAN–China Free Trade Area, China Economic Review, 29, 138-151.
22
Table 1. Import Pattern
From RTA Members From Non-members
(i) NO NO
(ii) YES NO
(iii) NO YES
(iv) YES YES
Import Status in the Initial Time
23
Table 2. RTAs for Thailand during Our Sample Period
FTAs Members Implementation
ASEAN Free Trade Area (AFTA) Brunei, Cambodia, Indonesia, Laos,
Malaysia, Myanmar, Philippines, Singapore, Viet Nam, and Thailand
1993
Thailand-India FTA (TIFTA): Early harvest India and Thailand 2004
Thailand-Australia FTA (TAFTA) Australia and Thailand 2005
ASEAN-China FTA (ACFTA) Brunei, Cambodia, China Indonesia,
Laos, Malaysia, Myanmar, Philippines, Singapore, Viet Nam, and Thailand
2005
Thailand-New Zealand Closer Economic Partnership Agreement (TNZCEP) New Zealand and Thailand 2005
Japan-Thailand Economic Partnership Agreement (JTEPA) Japan and Thailand 2007
ASEAN-Japan Economic Partnership Agreement (AJCEP) Brunei, Cambodia, Indonesia, Japan, Laos, Malaysia, Myanmar, Philippines, Singapore, Viet Nam, and Thailand
2009
ASEAN-Republic of Korea FTA (AKFTA) Brunei, Cambodia, Indonesia, Laos,
Malaysia, Myanmar, Philippines, Korea, Singapore, Viet Nam, and Thailand
2010
ASEAN-Australia-New Zealand FTA (AANZFTA) Australia, Brunei, Cambodia, Indonesia, Laos, Malaysia, Myanmar, New Zealand, Philippines, Singapore, Viet Nam, and Thailand
2010
ASEAN-India FTA (AIFTA) Brunei, Cambodia, India, Indonesia, Laos,
Malaysia, Myanmar, Philippines, Singapore, Viet Nam, and Thailand
2010
Source: Legal texts of RTAs
24
Table 3. Decomposition of Imports in 2011: Trade Creation (Million THB)
Value Share
(i) Imports from non-members in 2011 2,798,638 0.42
(ii) Imports from members in 2011 3,873,102 0.58
(iii) of an ineligible product as of 2011 1,486,225 0.22
(iv) of an eligible product as of 2011 2,386,877 0.36
(v) Scheme of imports from members in 2011 = MFN 946,411 0.14
(vi) Scheme of imports from members in 2011 = Others 825,607 0.12
(vii) Scheme of imports from members in 2011 = RTA 614,860 0.09
(viii) Existence of import of that product from that member in 2007 = YES 59,741 0.01 (ix) Existence of import of that product from that member in 2007 = NO 555,118 0.08 (x) Existence of import of that product from non-members in 2007 = NO 395,772 0.06 (xi) Existence of import of that product from non-members in 2007 = YES 159,347 0.02 (xii) Existence of import of that product from non-members in 2011 = YES 115,684 0.02 (xiii) Existence of import of that product from non-members in 2011 = NO 43,662 0.01
(xiv) Total 6,671,740 1.00
Source: Authors’ computation.
25
Table 4. Decomposition of Imports in 2007: Trade Diversion (Million THB)
Value Share
(i) Imports from members in 2007 2,898,477 0.60
(ii) Imports from non-members in 2007 1,969,455 0.40
(iii) of an ineligible product as of any year during 2007-2011 1,237,313 0.25
(iv) of an eligible product as of any year during 2007-2011 732,142 0.15
(v) under Others 278,611 0.06
(vi) under MFN 453,531 0.09
(vii) Existence of import of that product from any members in 2007 = YES 259,421 0.05 (viii) Existence of import of that product from any members in 2007 = NO 194,110 0.04
(ix) Existence of that import from that non-member in 2011 = YES 84,233 0.02
(x) Existence of that import from that non-member in 2011 = NO 109,878 0.02
(xi) Existence of import of that product from any members in 2011 = NO 109,878 0.02 (xii) Existence of import of that product from any members in 2011 = YES 0.001 0.00
(xiii) Scheme of that import from members in 2011 = MFN 0.001 0.00
(xvi) Total 4,867,932 1.00
Source: Authors’ computation.
26
Table 5. Trade Creation: Extensive Margin
Import RTA Use Import RTA Use
ln (1+MFN rates) 0.547*** 0.247***
[0.022] [0.030]
ln (1+RTA rates) -0.534*** -0.225***
[0.053] [0.068]
Preference Margin 0.147*** 0.536***
[0.056] [0.104]
ln Total Imports 0.064*** -0.058*** 0.051*** -0.039***
[0.001] [0.002] [0.001] [0.003]
Export dummy -0.013*** -0.070*** 0.020*** -0.113***
[0.004] [0.010] [0.006] [0.018]
ln GDP 0.313*** -0.291*** 0.284*** -0.233***
[0.002] [0.006] [0.002] [0.012]
ln Distance -0.188*** 0.550*** -0.152*** 0.573***
[0.006] [0.011] [0.007] [0.023]
ln CoO Fee -0.029*** -0.028***
[0.005] [0.010]
ln Export Cost -0.427*** -0.433***
[0.007] [0.009]
Rho -0.936 -0.914
[0.007] [0.014]
Chi-squared statistics 1014.7 1014.7
Number of observations 9,166,871 8,292,312
Censored observations 9,107,223 8,263,932
Uncensored observations 59,648 28,380
Log pseudolikelihood -318194 -168697
(I) (II)
Notes: Robust standard errors are in parentheses. ***, **, and * indicate 1%, 5%, and 10%
significance, respectively. In all specifications, we include year dummy variables.
27
Table 6. Trade Diversion: Extensive Margin
(I) (II)
ln (1+MFN rates) 0.280*** 0.459***
[0.021] [0.032]
ln (1+RTA rates) -1.143*** -1.131***
[0.105] [0.127]
ln Total Imports -0.055*** -0.057***
[0.001] [0.001]
Export dummy 0.164*** 0.116***
[0.004] [0.006]
ln GDP -0.053*** -0.044***
[0.001] [0.002]
ln Distance 0.028*** 0.037***
[0.003] [0.005]
Number of observations 851,572 347,253
Pseudo R-squared 0.0126 0.1243
Log pseudolikelihood -482312 -207913
Notes: Robust standard errors are in parentheses. ***, **, and * indicate 1%, 5%, and 10%
significance, respectively. In all specifications, we include year dummy variables.