Observation of the Simultaneous Amplification of the Space Charge and the Fast Cyclotron Waves in a Spiral Beam‑Plasma System
journal or
publication title
福井大学工学部研究報告
volume 28
number 2
page range 175‑179
year 1980‑09
URL http://hdl.handle.net/10098/4390
MEMOIRS OF THE FACULTY OF ENGINEERING FUKUI UNIVERSITY VOL.28 No. 1 1980
Fundamental Optical Transitions in the Single Crystal of Cadmium Iodide
Shin-ichi KONDO,* Tsuguhiro MITSUNARI**
and
Hiroaki MATSUMOTO*
(Received Jan. 31, 1980)
The fundamental reflectivity spectrum of the cleaved surface was measured at room and liquid heliun tempera- tures in the region 3-12 eV for CdI2 single crystal~ The polarized reflectivity spectra of the polished surface perpendicular to the easy-cleavage face were also mea- sured at liquid nitrogen temperature in the region 3-7 e~
In the £2 spectrum of the cleaved surface analyzed through the Kramers-Kronig procedure, three very sharp exciton lines with half-widths 20-30 meV are embedded in the deep interband scattering continuum. The low energy parts of the spectral behaviors are interpreted in terms of dichroic optical transitions occuring at high symmetry critical points in the Brillouin zone. The upper valence bands are of predominant iodine p-like character with a possibility of a certain admixture of cadmium d-like wave functions.
1. Introduction
Cadmium iodide crystallizes in a typical layer structure with high- ly ionic properties. Basic unit of the layer consists,?f one cadmilirn- ion-sheet and two iodine-ion-sheets; the cadm1u~1~ri-sheet is sand- wiched by the two iodine-ion-sheets. The CdI 2 crystal belongs to the D3d 3 space group with one molecule per unit cell, and has easy-cleavage face parallel to the layer.
Since the cadmium iodide is highly anisotropic, an evaporated film is j,nadequate for studying its fundamental optical spectra. Optical reflectance spectra of the cadmium iodide single crystal were reported
* Dept. of Electronics' ** 'Daiwa Sangyo
by Greenaway and Nitsche l ) (1965), and Greenaway and Harbeke 2 ) (1966).
They measured the spectra of the cleaved surface at liquid nitrogen temperature in the photon energy region of 5.0 - 7.5 eV and found two very sharp lines at deep interband energy region more than 2 eV above the optical gap. Wright and Tubbs3 ) (1970) ascribed these two sharp lines to exciton formations on ~he basis of their measurements on the photoconductivity spectrum.
In the present work the reflectance spectra of the cleaved surface of the cadmium iodide single crystal are measured at room and liquid helium temperatures in the photon energy region of 3-12 eV. From th~se
spectrum, important optical constants are determined through the Kramers-Kronig analysis. The reflectance spectra of the crystal sur- face polished perpendicularly to the layer are also measured at liquid nitrogen temperature in the region 3-7 eV by using linearly polarized light.
2. Experimental
The reflectance spectra of nearly normal incidence ("" 5° ) were mea- sured for cleaved surface perpendicular to the crystllographic c axis and for polished surface parallel to the c axis of the CdI2 single crystal. The measurements for the cleaved surface were carried out at room temperature (RT) and liquid helium temperature (LHeT) in the photon energy region of 3-12 eV by using a hydrogen discharge tube as a light source. The measurements for the polished surface were car- ried out at liquid nitrogen temperature (LNT) by using a 200W deute- rium lamp as a light source; the light from the source was linearly polarized by a Rochon polarizer placed in front of th light source.
All the measurements were carried out by means of a double beam meth- od with the use of a Seya-Namioka vacuum ultraviolet monochromator.
Details of the double detection system are reported in ref.4.
Single crystals of CdI 2 were grown from the melt by the Sto.ckbarger technique. The sample surface parallel to the c axis was polished with carborundum of #8000 and was etched by using ethyl-alcohl.
3. Results
Figure 1 shows the reflectivity spectra of normal incidence of the freshly cleaved surface measured at LHeT (solid line) and RT (bro- ken line) in the region 2-12 eV. The reflectivities at photon energiffi near the ah.s_o~ptJ:Qn edge ( 3.6 eV at LHeT and 3.4 eV at RT) agree well
with those determined from the values of the refractive index n5 ) by using the relation R = (n - 1)2/ (n + 1)2. In the transparent region, correction is made for the spectra by subtracting the additional re- flection from the back surface of the sample and only the contribution
60 A
B CdI2 R
_50
LHeT
~ 0
B -AT
>40
~
-
>
-
tJ30..J
w
lL.
W
ex: 20
10
0
2
35 6
7 89
PHOTON ENERGY
Fig.l. Normal incidence optical reflectivity spectra of the freshly cleaved surface of CdI2 single crystal measured at liquid helium temperature (solid line) and room temperature (broken line).
from the front surface is shown in the figure. The LHeT spectrum shows well resolved structures in comparison with the reflectivity spectra reported in refs.1-2, which were measured at LNT in the region 4.7-7.6
eV. Several structures are also observed in the lower energy than 4.7
eV.
The real and imaginary parts of the complex refractive·index
n
= n- ik~ which are suitable for the description of optical properties of the medium, are determined with the application of the Kramers-Kronig relation to the R spectra of Fig.l. In the analysis, the reflect iv- ity R supplemented in the lower energy region (w< 2eV) is assumed to have no reststrahlen band and is approximated by R(w) = R( 2eV). Above 12 eV, the curve R is extrapolated in the form R(w) = R(12eV) x (12/W)P, where the exponent p is so adjusted that the extinction coefficient k
is zero at 3.6 eV at LHeT and 3.4 eV at RT. (The values of p were 1.125 and 2.174 for the LHeT and RT spectra respectively.) The quan- tity £2 the absorptive or imaginary part of the complex dielectric function, which is an important quantity in studying the optical prop- erties of solids from theoretical point of view, is also computed using the relation £2 = 2 n k.
The spectra of the optical constants n, k and ~2 obtained in this way are shown in Figs.2-3. The LHeT spectrum of £2 shows well re- solved structures compared to that of R of Fig. 1. In particular, the
x
W3
o zW >
t=2
u0::
«
l.L..
0::,
W~
z
~3 u ti: l.L..
W o U2
z
o~ u
z
~, X Wo 2
4
3 4
5 6 7
Cdl2 n - - LHeT - - - RT
8 9 10 11
Cdl2 k - - LHeT - - - RT
5 6 7 8 9
PHOT9J':·L
ENERGY10 11
(eV)
12
12
Fig.2. The real and imaginary parts of the complex refractive index
n
= n - ik of CdI2 for ordinary ray determined from the reflectivity spectra of Fig.l through the Kramers-Kronig procedure.structures Yl and Yz observed in the low energy part appear as clear peak§ in the E 2 spectrum. The two characteristic sharp lines A and B observed in the deep interband energy region sharpen further in the Ez spectrum with the half-widths of about 20 and 50 meV respectively.
Furthermore the additional structure B' of the low energy part of the
~
Z
~
o~15
u
>
a::
4 Z~
~ 5
o 2
3 45 A B
s'
'lo6 7
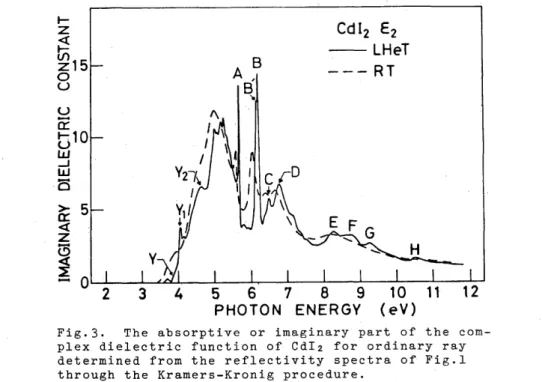
Cd 12 E2 - - LHeT - - - RT
8 9 10
PHOTON ENERGY (eV)
11 Fig.3. The absorptive or imaginary part of the com- plex dielectric function of Cdlz for ordinary ray determined from the reflectivity spectra of Fig.l through the Kramers-Kronig procedure.line B is more prominent in the Ez spectrum than in the R spectrum. It is also noted that the E2 spectrum reveals satellite peaks just above the line A. The energy positions of the main structures marked with the letters in Figs.l and Fig.3 are summarized in Table I.
Table I. The energy positions of the main structures ob- served at liquid helium temperature in the reflectivity spectrum and theEz spectrum of Cdl2 shown in Fig.l and Fig.3 respectivelT.
(in eV\
Structure Y Yl Y2 A B' B
R 3.8 4.035 4.58 5.693 6.15 6.224 E2 3.90 4.070 4.64 5.677 6.166 6.200
Structure C D E F G H
R 6.505 6.90 8.34 8.90 9.38 10.58 Ez 6.480 6.78 8.26 8.80 9.28 10.5
Figure 4 shows the E~c and EYc reflectance spectra measured atLNT of the polished surface perpendicular to the easy-cleavage face ,of CdI2 • The curve R~(polished) is the reflectivity spectrum for ELc run the curve RII (polished) for Ell c. For comparison is also shown the re- flectivity spectrum of the cleaved surface R~(cleaved) measured at the same temperature, which shows the same outline as that reported in refs.1-2 in the duplicated energy region. The spectra of the polished surface were so adjusted that the value of R~(polished) coincides with that of RL(cleaved) at the absorption edge ( 3.6 eV). The ratios of the measured reflecti vi ties for Ell c to those for E.L c agree well with the corresponding ones determined from the dichroic refractive index
60
CdI2
LNT
B
,...50
~ 0
>
~40 >
.- -
U W
...J
30
lL..
a::
WI I
~RII{potished)
I10 4 5 6
PHOTON ENERGY
(eV)Fig.4. Normal incidence optical reflectivity spec- tra of the polished surface of Cdlz perpendicular to the crystallographic c axis measured at liquid ni- trogen temperature by using linearly polarized light with the electric vector E perpendicular or parallel to the c axis: R.L(polished) for E1. c and RtI(polished) for Enc. The reflectivity spectrum of the cleaved surface RL(cleaved) measured at the same temperature is also shown for comparison.
data 5 ) in the transparent region. No missing and no extra structure is observed in the curve R~(po1ished) as compared with the curve RL
(cleaved) and the correspondence of the spectral structures between the two curves is fairly good. The slight discrepancy of the energy positions of the spectral structures between the two curves, and the relatively large variation of the R~(po1ished) minus R~(c1eaved)
against the photon energy are due to the difference in quality between the reflecting surfaces (cleaved and polished).
The spectral structures observed for the curve RH(po1ished) are largely different from those observed for the curve RL(polished). In the curve R,,(po1ished) are observed two prominent peaks at the photon energies-of 3.88 and 4.11 eV.~where the optical transitions for E~c
are very week (see structures Y and Z). On the other hand, no struc- ture is observed for the curve Ru(po1ished) at 4.00 eV where the strong
E L C transition responsible for the structure Y 1 occurs. In the higher energy region up to about 5.6 eV, the structures due to interbandtran- sitions are about equally visible in both polarizations. However the structures for E~c lie on the intense continuum. Above 5.6 eV, no- ticeable difference are observed between the two curves. No structure is found for the curve R~(polished) at 5.7 eV where the characteristic sharp line A is observed for E~c. This is contrary to the measure- ments by Greenaway and Harbeke,2) though they did not show the figure of the spectrum for Ell c in their paper. The optical transitions around 6.2 eV are commonly observed for both polarizations. It is noted however that the reflectivity maximum for Ellc is located at slightly lower energy than that for E~c. The energy difference be- tween the two maxima is about 40 meV and is comparable to that between the structures Band B' (34 meV) observed at LHeT (Fig.3). No struc- ture is again observed for Ellc around 6.5 eV where the structure C appears as a small peak for E~c.
4. Discussion
Since no electron energy band calculation is available for CdI2, it is difficult to fully interprete the data of the preceding section in terms of allowed optical interband transitions ocuring at particular critical points in the Brillouin zone. However, some important fea- tures of the fundamental spectral :behaviors can be explained after a zero order band scheme.
In a zero order band model, the upper valence bands of CdI2 would be constructed mainly from iodine 5p-state wave functions, while the
lowest conduction band would have its main origin in the cadmium &s-
§tate wave function. The origin of ·the low lying spectral structures of CdI 2 are therefore of predominant character of the allowed interband opti- cal transitions from the iodine p-like valence bands to the cationic s-like conduction band. In analogy with the cases of the other layer cadmium halides CdCl2 and CdBr2, 6-8) it is plausible to assume that the two structures Yl and Y 2 shown in Fig.3 come from the spin-orbit interactioh of the iodine p-lik€ valence band at a high symmetrycrit-
.~~~~
1-5p ,/
- "
, ,
\ , j = 1/2 __ - atomic spin-orbit
orbital
I
..l II JJ.
1
I IY
.
IYl I
I
Y2
I
•
spin-orbit crystal field
+
crystal field
atomic orbital
Fig.5. The schematic diagram of the alloweo direct optical transitions from the iodine 5p- like valence bands (y, Yl and h) to the cad- mium 5s-like conduction band (Yo) at high sym- metry critical points of the Brillouin zone of CdI2, i.e., the r (D.3d), A (D.3d), K (D.3), H (D.3) and b, (C.3'V) points.
ical point in the Brillouin zone and the additional structure Y from the critical field perturbation at the same critical point. This as- sumption is effective to understand the anisotropic behavior of the low energy part of the reflectance spectra shown in Fig.4 as is dis- cussed in the following paragraph.
In Fig.5 is shown the schematic diagram of the allowed direct op- tical transitions from the iodine p-like valence bands (y, Yl and Y2) to the cadmium s-like conduction band (Yo) at high symmetry critical points of the Brillouin zone containing in their symmetry groups the operation of the three-fold rotation, that is, the r (D.3d), A (D.3d), K (D.3), H (D3) and b, (C.3v) points. (At the r and A points only the valence bands having the odd-parity wave functions are taken into ac- count, since the cadmium s-like conduction state is of even-parity at
these critical points.) The wave functions of the valence band y have a predominant pz-like character with a small admixture of Px- and Py- like wave functions due to the spino-orbit interaction. The direct in- terband optical transition from the valence band y to the conduction band Yo (y-+y 0) is more active for E 1/ c than for. E.L c and is therefore believed to gives rise to the strongly anisotropic behavior of the 3.88 eV absorption band shown in Fig.4. Inversely, the wave functions for y 2 have predominant Px- and py-like characters wi th a certain admix- ture of the pz-like wave function; the optical transition Y2~YO has a large probability for E.Lc compared with that for Ell c ; this seems to correspond to the anisotropic character of the 4.6 eV band. On the other hand the optical transition Yl~YO is active only for E.Lc since no hybridization between the Px- and py-like and the pz-like wave func- tions occurs in the valence wave functions for Yl even if the spin- orbit interaction is taken into account. This accounts for the two dimensional character of the electric dipole transition Qbserved at 4.00 eV in Fig. 4. As to the 4.11 eV band, no good explanation for the strong anisotropic behavior is found at present.
The energy differences between these iodine p-like valence bands can be estimated by a simple calculation. If the contribution from the other constituent atomic orbitals of CdI2 such as cadmium 4d- orbitals to these valence bands are ignored, the energy difference between the valence bands y and Y2' i.e., w(y) -W(Y2)' is easily shown to be more tnan 18/9 A = 0.889 eV by usi.ng eq. (2) of ref. 8, where A = 0.942 eV is the atomic spin-orbit splitting energy of the iodine p- electron. (We note that, though the quantity 18/9 A is accidentally equal in magnitude to the well-known minimum splitting of Knox and Inchauspe,9) it is,of course, different in its character from the lat- ter.) The energy difference between the valence bands Yl and Y2 ,La, W(Yl) -.w(Y2)' which is equal to,A for zero crystal field, decreases with increasing crystal fie}d and converges to (2/3) A
=
.0.628eV for infinite crystal field. On the ~her hand the observed energy differ- ences are 0.74 eV for w(y) -W(Y2) and 0.57 eV for W(Yl) -W(Y2). Both of these values are somewhat smaller even than the corresponding min- ima predicted theoretically. These discrepancies suggest a possibil- ity of a certain admixture of the cadmium d-electrons to the upper va- lence bands due to their relatively shallow atomic energy levels. In fact, such admixture is known to reduce the spin-orbit splittings of the halogen p-like valence bands in the cases of the silver and cuprous halides;O-ll) whose constituent atoms have isoelectrdnic configurationsto those of the cadmium halides. It is also noted that the cadmium iodide shows some covalent properties in the dispersion behaviors of the refractive indices 5 ) in favor of the possibility of this type of admixture. It is therefore plausible to relate the three transitions discussed above to one of high symmetry critical po ins other than r and A points. (At r and A points the p-d mixing is parity-forbidden owing to inversion symmetry.)
The two characteristic sharp lines A and B (and the structure B') observed in the E2 spectrum at LHeT (Fig.3) suggest strong exciton ef- fects in spite of their peak energies more than 2 eV above the opti- cal gap. The peak energies agree well with the dip energies of the photoconductivity spectrum. 3 ) The two satllite peaks observed just above the line A suggest a possible evidence for the second and third members of the well-known Wannier exciton series. However, the peak energies of the satllites (5.797 eV, 5.926 eV) do not satisfy the three dimensional hydrogen model, and the intensity ratio of the first satel- lite to the line A is very small compared with the 1/8 predicted from the model. The small peak C and the weak shoulder observed just be- low this peak C might be explained as the second comnonents of the exciton lines Band B' respectively.
As to the 5.7 eV exciton, the associated critical point should be located at the high symmetry critical point in the Brillouin zone since its optical transition vanishs completely for Enc as is shown in Fig.4. In fact, group theoretical arguments show that at any critical point with lower symmtry properties than the r, A, K, H and ~ points, no 'completely anisotropic' interband optical coupling is allowed due to star degeneracies. (Of course, no 'completely isotropic' interband optical coupling is also allowed.) Therefore the symmetry properties of the optical transition responsible for the exciton line A have a certain analogy with the Yl~YO transition mentioned above (see Fig.5).
The slight difference in the peak energies between the 6.2 eV exciton band observed for E.J. c and that observed for Ell c , which is comparable to the energy difference between the structures Band B' of Fig.3 as mentioned in the preceding section, suggests that the high energy com- ponent appearing as a peak B in the LHeT E2 spectrum of Fig.3 is more active for E.l. c than for Ell c whereas the low ene.rgy component appear- ing as a structure B' in the LHeT spectrum has about equal transition proberbilities for both polarizations. This is in favor of the as- sumption that the 6.52 eV peak C is the second component of the exci- ton line B, since no structure is observed for EIIC at this photon
energy.
Stress experiments on these exciton lines are in progress to clear up the locations of their associated critical points and the origin of their strong exciton effects.
Acknowledgments
The authors are indebted to Prof.Y.Nakai, Kyoto University, for making the vacuum ultraviolet monochromator available to them. They also wish to thank Prof.H.Yagi and members of Experimental Institute for Low Temperature Physics, Fukui University, for supplying them liq- uid helium. We would like to thank Mr. H. Ar>ima for his experimental assistance.
References
1) D. L. Greenaway and R. Nitsche: J. Phys. Chern. Solids 26 (1965) 1445.
2) D. L. Greenaway and G. Harbeke: J. Phys. Soc. Japan 21 supplement (1966) 151.
3) D. K. Wright and M. R. Tubbs: Phys. Status Solidi 37 (1970) 551.
4) S. Kondo and H. Matsumoto: Mem. Fac. Engng. Fukui Univ. 26 (1978) 9.
5) S. Kondo T. Mitsunari and H. Matsumoto: Mem. Fac. Engng. Fukui Univ. 27 (1979) 205.
6) S. Kondo and H. Matsumoto: Mem. Fac. Engng. Fukui Univ. 25 (1977) 4l.
7) S. Kondo and H. Matsumoto: Solid State Commun. 24 (1977) 695.
8) S. Kondo, T. Mitsunari, H. Matsumoto and H. Arima: Mem. Fac. Engng.
9) 10) 11)
Fukui Univ. 26 (1978) 359.
R. S. Knox M. Cardona:
F. Bassani, A1217.
and N.
Phys.
R. S.
Inchauspe: Phys. Rev. 116 (1959) 1093.
Rev. 129 (1963) 69.
Knox and W. B. Fowler: Phys. Rev. 137 (1965)