LETTER
Detection of Range-Spread Target in Spatially Correlated Weibull Clutter Based on AR Spectral Estimation
Jian BAI†a),Member andLu MA†,Nonmember
SUMMARY In high range resolution radar systems, the detection of range-spread target under correlated non-Gaussian clutter faces many prob- lems. In this paper, a novel detector employing an autoregressive (AR) model is proposed to improve the detection performance. The algorithm is elaborately designed and analyzed considering the clutter characteristics.
Numerical simulations and measurement data verify the effectiveness and advantages of the proposed detector for the range-spread target in spatially correlated non-Gaussian clutter.
key words:high range resolution, range-spread target, spatially correlated non-Gaussian, AR model, CFAR
1. Introduction
Due to the superior detecting capability of high range reso- lution (HRR) radar, the observed target would spread over several range cells which is regarded as a range-spread tar- get[1],[2]. The statistics of such clutter detected by a HRR have been observed to deviate from Rayleigh distribution which is spikier than Gaussian. The false-alarm rate (FAR) would be increased if processing the spikes as targets[3].
In many practical situations, the ground clutter also exhibits significant spatial correlation[4], resulting in non- negligible effects on detection performance. Obviously, un- der correlated non-Gaussian clutter, the detection of range- spread target faces many problems that are difficult to solve with existing methods which is applied to the point target under uncorrelated Gaussian clutter.
Previous work in the field of radar signal processing employing an autoregressive (AR) model concerns mainly about spectrum estimation, clutter-whitening processing and so on[5],[6]. Inspired by the idea of previous work, in this paper, high range resolution profile (HRRP) based on AR algorithm is used to detect range-spread target rather than inverse Fourier transform approach. The AR model can not only keep high range resolution but also whiten and sup- press correlated and uncorrelated clutter, therefore, improv- ing the detection performance for the range-spread target in spatially correlated and uncorrelated non-Gaussian clutter.
The remainder of this letter is organized as follows. In Sect. 2, the proposed AR-OS detection algorithm and clutter characteristic are derived and illustrated, together with the
Manuscript received March 12, 2020.
Manuscript revised June 25, 2020.
Manuscript publicized July 27, 2020.
†The authors are with Science and Technology on Millimeter- wave Laboratory, Beijing Institute of Remote Sensing Equipment, Beijing, 100039, P. R. China.
a) E-mail: [email protected] DOI: 10.1587/transfun.2020EAL2026
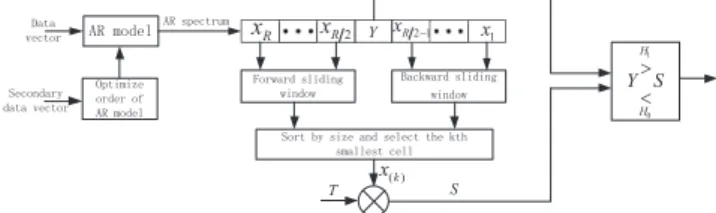
Fig. 1 Flowchart of AR-OS detector.
performance evaluations. Then, the effectiveness of the pro- posed detector is verified by simulations and the measured data in Sect. 3. Finally, Sect. 4 presents our conclusions.
2. Proposed Detecting Algorithm
The detection problem can be described as the following bi- nary hypothesis,
( H0:Z=w
H1:Z=x+w (1)
where H0 is the clutter-only hypothesis, H1 is the signal- plus-clutter hypothesis, x = {xi|i=0,1, . . . ,N−1}is aN dimensional vector that represents the target’s HRRP,N is the number of range cells, andw={wi|i=0,1, . . . ,N−1} is the clutter which is assumed to be uncorrelated or spa- tially correlated Weibull clutter. In Fig. 1, the proposed de- tection is conducted in a two-step scheme: 1) establishment of HRRP based on AR model using secondary data; and 2) detection using the ordered statistics (OS) method on HRRP of AR spectrum.
2.1 HRRP Based on AR Algorthm
Non-parametric fourier transform technique is not the only method for estimating the target locations with high reso- lution. Parametric approaches, such as AR algorithm, can also be extensively employed in the filed of HRRP estima- tion. The AR model of ordermis defined as[7]:
x[n]=−
m
X
k=1
akx[n−k]+e[n] (2) where ak(k = 1,2, . . . ,m) are AR coefficients and e[n]
is forward prediction error. From Eq. (2) the information contained in HRRP is split into two parts: 1) the global frequency-evolving information represented by ak, reflect- ing the HRRP structure and can be utilized for detection;
Copyright c2021 The Institute of Electronics, Information and Communication Engineers
There are several issues employing AR model for HRRP should be addressed. For instance, it is a vital prob- lem of determining a proper order. If the order of the model is too low, the resolution would be lost; if it is too high, the spurious peaks would be observed. In this paper, the order is optimized fromN/3 toN/2 to satisfy the minimum order cri- terion[12]. The order meeting the requirement of range res- olution is obtained from secondary data. Moreover, there are many methods available for AR model parameters estima- tion including Yule-Walker method, Burg method, covari- ance approach and modified covariance approach. Among these, the modified covariance (MCOV) approach, that is minimizing the sum of squares of the forward and backward prediction errors, which is also called forward-backward or least square method is adopted in this parer. It has the advan- tages of higher spectrum resolution with short data length and gives less dependence on sine signal’s initial phase.
Notably, the coefficientsakin the MCOV method could be solved from a set of linear equations as in equation[8],
rxx[1,1], rxx[2,1],
... rxx[m,1],
rxx[1,2], . . . rxx[2,2], . . .
... rxx[m,2], . . .
rxx[1,m]
rxx[2,m]
... rxx[m,m]
a1
a2
... am
=−
rxx[1,0]
rxx[2,0]
... rxx[m,1]
(3)
whererxx[l,k] is as follow:
rxx[l,k]= 1 2(N−m)
N−1
X
n=m
x∗[n−l]x[n−k]
+x∗
n−p+k x
n−p+l
!
(4) The resulting residual least-squares errorεpis
εp=rxx[0,0]+
m
X
k=1
akrxx[0,k] (5)
2.2 Clutter Characteristics
Since Weibull distribution can fit the experimental data of the ground clutter well in a wide range, it is used as the as- sumption of amplitude model of the clutter[3]. The Weibull Probability Density Function (PDF)f(x) is given by
f(x)= q p(x
p)q−1exp(−(x
p)q),x≥0 (6) wherepis scale parameter andqis shape parameter.
Based on the survey of the experimental data of the ground clutter[9], it is considered that the spatial correla- tion function includes two components: fast fluctuation and
Range cell number 2880
range resolution 0.15 m Target lorry and corner reflector
Pf a 10−4
p 1
a 0.054 m
b 0.52 m
c 20.69 m
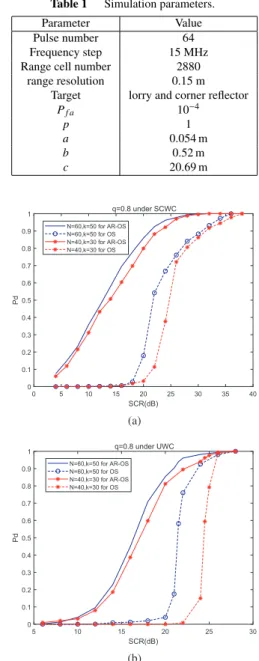
Fig. 2 Detection performances of AR-OS detector and OS detector with shape parameterq=0.8. (a)Pd versus SCR usingR =60,k=50 and R=40,k=30 under SCWC. (b)Pdversus SCR usingR=60,k=50 and R=40,k=30 under UWC.
slow fluctuation. The expression of the normalized spatial correlation functionR(d) is
R(d)=ae−d2/b2+(1−a)e−d/c (7) where 0 ≤ a ≤ 1 represents the proportion of fast fluctu- ation component in the total energy, and b and c are the decorrelation distances of fast fluctuation and slow fluctu- ation components respectively,dis space distance between clutter units.
2.3 Detection Algorthm
Due to the fact that OS method has good resolution in the
Fig. 3 Detection performances of AR-OS detector and OS detector with shape parameterq=1.3. (a)Pdversus SCR usingR=60,k =50 and R=40,k=30 under SCWC. (b)Pdversus SCR usingR=60,k=50 and R=40,k=30 under UWC.
case of range-spread target detection, it is adopted here for target detection. In AR-OS method, the reference unitsRof AR spectrum are sorted according to their magnitude. The k-th samplex(k)in order is selected as the estimation of clut- ter power level, and the detection thresholdS is obtained by multiplyingx(k) with the threshold factorT which is deter- mined by the designed false alarm probabilityPf a. By com- paring the detection unitY with the thresholdS, the target could be observed if the threshold is exceeded.
WithH1hypothesis, the false alarm probability under Weibull distribution[11]is
Pf a= R!Γ(R−k+1+Tq)
(R−k)!Γ(R+1+Tq) (8)
whereΓis gamma function.
The averaging decision threshold (ADT) and its stan- dard deviation (S DADT), compared with OS algorithm, are used here to evaluate the AR-OS algorithm[10],[11], which can be expressed by
ADT = E(S)
p (9)
S DADT =[var(S)]1/2
p (10)
Performance analysis reveals that the detection proba-
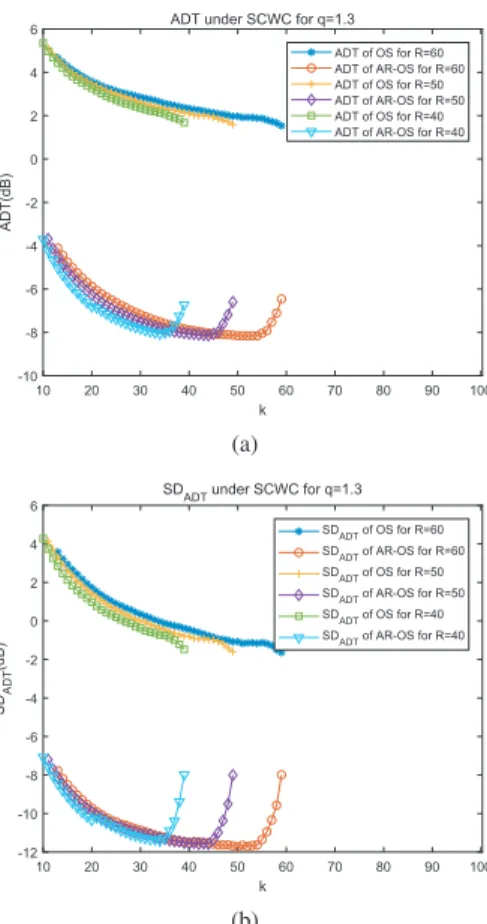
Fig. 4 ADTandS DADTunder SCWC (q=1.3) for AR-OS detector and OS detector. (a)ADT under SCWC (q = 1.3) for AR-OS detector and OS detector with different reference uintsR(60, 50 and 40). (b)S DADT under SCWC (q=1.3) for AR-OS detector and OS detector with different reference uintsR(60, 50 and 40).
bility depends not only onADT, but also onS DADTwith the fixed parametersk,Rand signal clutter power ratio (SCR).
In other words, for parameterk, a smallerADT value does not always correspond to a higher detection probabilityPd. ThresholdS estimation is optimal only when theADTand S DADTvalues reach the minimum at the same time, and the parameterkof minimum value is the optimal for fixed clut- ter parameter. This feature does not depend either on the shape parameterqof clutter background distribution or the predetermined false alarm ratePf a. Moreover, another ad- vantage of the ADT and SADT is that they avoids the com- plicated evaluations with density functions that are usually required in the situation of nonlinear clutter processing.
3. Performance Evaluation
Here, simulation data and measured data are provided to evaluate the performances of the proposed AR-OS algo- rithm under spatially correlated weibull clutter (SCWC) and uncorrelated weibull clutter (UWC). It would be compared with the OS detector using fourier transform technique, in terms of different clutter parameters, reference uintsRand parameterk.
In the experiments,Pf ais assumed to be 10−4and the
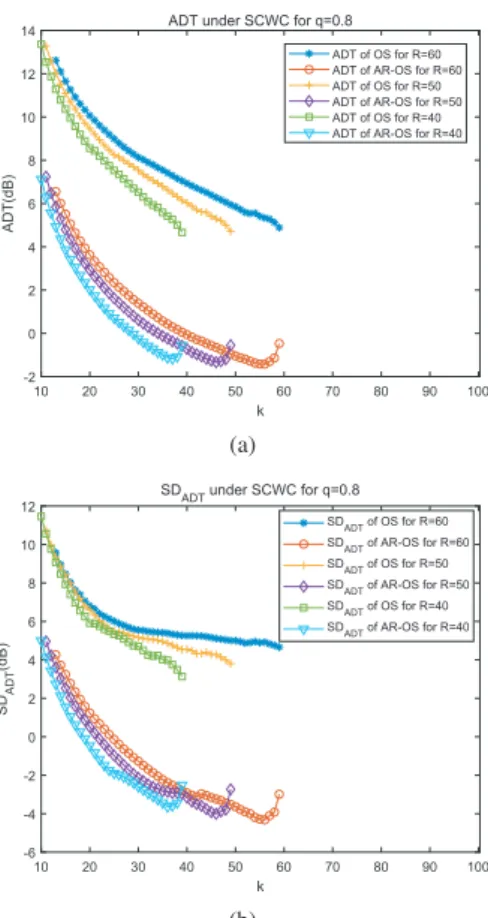
Fig. 5 ADTandS DADTunder SCWC (q=0.8) for AR-OS detector and OS detector. (a)ADT under SCWC (q =0.8) for AR-OS detector and OS detector with different reference uintsR(60, 50 and 40). (b)S DADT under SCWC (q=0.8) for AR-OS detector and OS detector with different reference uintsR(60, 50 and 40).
detection performances of AR-OS and OS are obtained from Monte Carlo simulation where 1000 independent trials are conducted at each SCR level. In this way, the performance of AR-OS and OS algorithms is compared by ADT and S DADT. Thereafter, the results of measured data obtained by stepped-frequency synthetic broadband radar are used to demonstrate the availability of the proposed detector. The simulation parameters required for generating SCWC [9]
and other experimental parameters are given in Table 1.
In Fig. 2 and Fig. 3, performances of AR-OS detector and OS detector using different reference uintsR(60 and 40) and differentk(50 and 30) with SCWC and UWC (q=0.8 and 1.3) are compared. Whatever SCWC and UWC is, AR- OS detector shows superiority to OS detector. This means that the SCR required to achieve the samePdis smaller. For UWC, the performance superiority owes to the fact that the filtering effect of AR model greatly reduces the influence of clutter fluctuation on detection while maintaining high range resolution. For SCWC, due to the ability of spatial decorrelation of AR model, it achieves better detection per- formance than OS detector. The AR model combines decor- relation with spectrum estimation to decrease the influence of spatial correlation on detection and obtain the HRRP of the range-spread target. Furthermore, because of the model
Fig. 6 The result of AR-OS detector and OS detector withR=60,k= 50 for lorry. (a) OS detector with fourier transform technique. (b) AR-OS detector with AR model.
stability of parametric approaches, Pd obtained by AR-OS detector varying from 50% to 80% doesn’t change dramati- cally with SCR fluctuated.
The performance of AR-OS and OS for normalized HRRP with different reference unitsR(40, 50 and 60) under SCWC (q = 0.8 and 1.3) assumptions are evaluated based on ADT and S DADT in Fig. 4 and Fig. 5. The ADT and S DADT of AR-OS detector reach the minimum at the same time under different reference units. And the value ofADT andS DADT obtained by AR-OS detector is also smaller than those of OS detector. In other words, compared with OS de- tector, the estimatedkin the AR-OS detector is closer to the optimal value under SCWC assumption.Therefore, with the same clutter parameters, the threshold estimation of AR-OS detector is better and more accurate than that of OS detector.
Furthermore, Because the minimum values of ADT andS DADTin OS detector curve are all obtained when opti- malkis equal toR, these curves are monotonically decreas- ing. And in AR-OS detector the optimalkare all less thanR, those curves of AR-OS detector are parabola. It is notable that the type of these curves, i.e., monotonous or parabolic, is determined by the selected parameters (q andR) in this paper, as is revealed in[10],[11].
Further, measured data is used for comparison, and the performance of AR-OS detector and OS detector with R=60,k=50 in terms of range-spread target are compared
in Fig. 6. The range-spread targets are two adjacent points of lorry and one point of corner reflector. The weaker scat- tering point of lorry and corner reflector are missed for OS detector as depicted in Fig. 6(a), while the AR-OS detector has detected all these points of the range-spread target as de- picted in Fig. 6(b). Therefore, the AR-OS detector, to some extent, can reduce the influence where the range-spread tar- get will be shielded by strong scattering point.
4. Conclusion
In this paper, the AR-OS detector has been proposed and demonstrated to be effective for detecting the range-spread target under SCWC and UWC assumptions. The AR model employed in the detector combines spectrum estimation with spatial decorrelation to improve the detection perfor- mance, obtaining more accurate optimal estimation ofkand reducing the shielding effect in terms of range-spread target.
The performance of the AR-OS detector has been analyzed in terms of probability of detection using Monte Carlo sim- ulations. Results of simulations and measured data reveal that compared with OS detector, the AR-OS detector is more adaptable for range-spread target under SCWC assumption while guaranteeing the CFAR property.
References
[1] A. Farina and F.A. Studer, “Detection with high-resolution radar:
Great promise, big challenge,” Microw. J., vol.34, pp.263273, May 1991.
[2] E. Conte, A. De. Maio, and G. Ricci, “CFAR detection of distributed targets in non-Gaussian disturbance,” IEEE Trans. Aerosp. Electron.
Syst., vol.38, no.2, pp.612–621, April 2002.
[3] M. Al-Fawzan, Methods for Estimating the Parameters of Weibull Distribution, King Abdulaziz City for Science and Technology, Saudi Arabia, 2000.
[4] A. Kurz and H. Schimpf, “The problem of parameter estimation for spatially correlated polarimetric ground clutter at millimeter- wave frequencies,” 2007 IEEE international Geoscience and Remote Sensing Symposium, pp.4179–4182, Barcelona, Spain, July 2007.
[5] S. Chakrabarti, P. Kannagaratnam, and P. Gogineni, “Model-based technique for super resolution and enhanced target characterization using a step-frequency radar: A simulation study,” 1996 interna- tional Geoscience and Remote Sensing Symposium, pp.1867–1869, LINCOLN, 1996.
[6] G. Liu, N. Jiang, and J. Li, “Moving target detection via airborne HRR phased array radar,” IEEE Trans. Aerosp. Electron. Syst., vol.37, no.3, pp.914–924.
[7] P. Wang, F. Dai, M. Pan, L. Du, and H. Liu, “Radar HRRP target recognition in frequency domain based on autoregressive model,”
IEEE Radar Conference, pp.714–717, 2011.
[8] D. Chakraborty and S.K. Sanyal, “Performance analysis of different autoregressive methods for spectrum estimation along with their real time implementations,” 2nd IEEE International Conference on Re- search in Computational and Intelligence and Communication Net- works, pp.141–146, 2016
[9] H. Qiao, F. Yin, J. Yu, C. Wang, and W. Chen, “Measurement and analysis for spatial correlation characteristic of land radar clutter,”
Chinese Journal of Radio Science, vol.10, no.3, Sept. 1995.
[10] R. Rifkin, “Analysis of CFAR performance in Weibull clutter,” IEEE Trans. Aerosp. Electron. Syst., vol.30, no.2, pp.315–329, April 1994.
[11] H. You and H. Rohling, “Performance analysis of order statistics CFAR in Weibull clutter background,” ACTA Electronica SINCA, vol.23, no.1, pp.79–84, 1995.
[12] S.M. Kay, Modern Spectral Estimation Theory and Application, Prentice Hall, Englewood Cliffs, N.J., 1988.