INTRODUCTION
It is widely reported that negative emotional changes and conditions affect the visual faculties of humans at the neural level. Numerous reports have shown that the contrast gain of pattern electroretino-grams was impaired in patients with major depres-sion (1-3). It has also been suggested that negative emotional states, such as depression and anxiety, af-fect visual evoked potentials (VEPs) (4, 5) and visual
event-related potentials (6, 7). Fitzgerald described this phenomenon as such individuals having “gray-colored glasses” (8). On the other hand, emotional effects on color perception are largely unknown. Trichromatic primates including humans have 3 types of cone photoreceptors, which are classed into L (long), M (middle), and S (short) categories be-cause of the wavelength band they are sensitive to in the visible spectrum. Excitation of these photore-ceptors is responsible for color vision of red, green, and blue respectively (9, 10). It is possible that the emotional effects on the visual functions have color-specificity because the color information from these photoreceptors project to primary visual cortex (V1) selectively (9). At the behavioral level, Wu et al. re-ported that depressive tendencies correlated with
ORIGINAL
Anxiety affects the amplitudes of red and green
color-elicited flash visual evoked potentials in humans
´
Yuki Hosono
1, 2, Kazuyoshi Kitaoka
3, Ryo Urushihara
4, Hiroyoshi Sei
1, and
Yohsuke Kinouchi
5 1Department of Integrative Physiology, Institute of Health Biosciences, the University of Tokushima Graduate School, Tokushima, Japan, 2
Ritsumeikan University Institute for General Education, Kyoto, Japan,3
Department of Physiology, Institute of Health Biosciences, the University of Tokushima Gradu-ate School, Tokushima, Japan,4
Ritsumeikan University College of Social Sciences, Kyoto, Japan,5
De-partment of Electrical and Electronic Engineering, Institute of Technology and Science, the University of Tokushima Graduate School, Tokushima, Japan
Abstract : It has been reported that negative emotional changes and conditions affect the visual faculties of humans at the neural level. On the other hand, the effects of emotion on color perception in particular, which are based on evoked potentials, are unknown. In the present study, we investigated whether different anxiety levels affect the color in-formation processing for each of 3 wavelengths by using flash visual evoked potentials (FVEPs) and State-Trait Anxiety Inventory. In results, significant positive correlations were observed between FVEP amplitudes and state or trait anxiety scores in the long (sensed as red) and middle (sensed as green) wavelengths. On the other hand, short-wave-length-evoked FVEPs were not correlated with anxiety level. Our results suggest that negative emotional conditions may affect color sense processing in humans. J. Med. Invest. 61 : 79-83, February, 2014
Keywords :flash visual evoked potentials, light emission diodes, color perception, State-Trait Anxiety Inventory
Received for publication November 5, 2013 ; accepted November 30, 2013.
Address correspondence and reprint requests to Kazuyoshi Kitaoka, Ph.D., Department of Physiology, Institute of Health Biosciences, the University of Tokushima Graduate School, 3 18 15, Kuramoto cho, Tokushima 770 8503, Japan and Fax : +81 -88 - 633 - 9443.
the color preference used on self-portraits (11). However, the study was not, to the best of our knowledge, based on any neural activity. In the pre-sent study, we investigated whether the difference in anxiety levels affects the visual information proc-essing for each of the 3 wavelengths by using flash visual evoked potentials (FVEPs) and State-Trait Anxiety Inventory (STAI).
METHODS
Seventeen male individuals with normal vision participated in this study (mean age!SD : 20.7! 2.3 years). All subjects participated in the study were free from neurological and psychiatric diseases with no known abnormalities of the visual system. All participants signed informed consent prior to par-ticipating in the study. This study was approved by the ethics committee of Tokushima University Hos-pital (No. 1142) and conformed to the principles out-lined in the latest revision of the Declaration of Hel-sinki.
Before FVEP recording, Participants completed the Japanese version of the STAI (Jitsumukyoiku-shuppan, Tokyo, Japan) to estimate their anxiety lev-els. The results of the STAI were a state and trait anxiety score. After this, the participants were pre-pared for electroencephalograph (EEG) recording and seated comfortably in an electrically shielded and darkened room. They were instructed to fixate on the center of a light emitting diode (LED) stimu-lator that was placed on 100 cm before them. The stimulator was capable of producing 3 wavelengths : (470 nm (blue), 527 nm (green), and 635 nm (red) ; NSSM065, Nichia Corp., Tokushima, Japan). Flash-lights in each wavelength from the LED (intensity : 2 cd/m2, duration : 300 ms, interstimulus interval : 1200-1600 ms, in a pseudorandom order) were pre-sented separately in each wavelength condition. The order of stimulus conditions was randomized for each participant. The EEGs were recorded on an apparatus that consisted of silver chloride disk sur-face electrodes at Fz, Cz, Pz, and Oz, in accordance with the International 10-20 system. Electrode im-pedance was kept below 3 kΩ. An electrooculogram (EOG) was also recorded with a pair of silver chlo-ride disk electrodes at 2 cm above and 2 cm below the right outer canthus. The linked earlobe was used for reference. The ground electrode was placed at Fpz. The EEG and EOG signals were amplified and acquired at a sampling rate of 10 kHz and filtered
at 1-5000 and 0.5-1000 Hz, respectively by SCAN 4.1 software (Neuro Scan Labs, Charlotte, NC). The FVEPs were averaged from 100 stimuli in each wavelength condition from 30 ms before to 300 ms after the LED stimulus onset in offline analysis. The artifacts were eliminated by referring to the EOG data. Analyzed components which were detected in all participates consisted of negative peaks with a la-tency of 65-95 ms (N2) and about 130 ms (N3), and positive peaks with a latency of about 120 ms (P2) and 140-160 ms (P3). The waveform components of FVEPs were identified in accordance with the stan-dards of the International Society for Clinical Elec-trophysiology of Vision (ISCEV) (12). The baseline-to-peak amplitudes of these components were meas-ured. The baseline was defined as the segment be-tween 2 and 6 ms after stimulation.
Comparison between the values of each compo-nent of the waveform in each stimulus conditions were analyzed by an ANOVA and Scheffe’s post-hoc test. Correlations between state and trait anxiety scores and FVEP components were evaluated by analysis of their Pearson correlation coefficients. All data were analyzed with SPSS version 11.01 J for Windows (SPSS Japan Institute Inc., Tokyo). P!
0.05 was considered statistically significant.
RESULTS
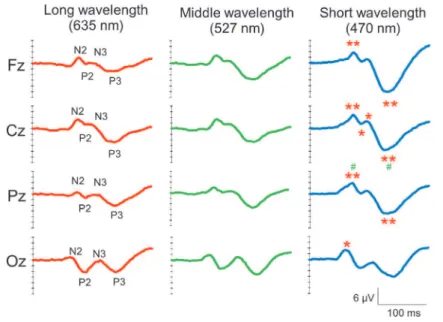
Grand average FVEP waveforms for each elec-trode and wavelengths are shown in Figure 1. The latency of each peak was not significantly differ-ent. On the other hand, a one-way ANOVA demon-strated a significant difference in the amplitudes of FVEPs in Fz [N2 : F(2, 48)=4.329, P!0.05, P3 : F (2, 48)=8.220, P!0.01], Cz [N2 : F(2.48)=7.866, P! 0.01, P2 : F(2, 48)=4.118, P!0.05, N3 : F(2, 48)= 4.985, P!0.05, P3 : F(2, 48)=8.385, P!0.01], Pz [N2 : F(2.48)=8.968, P!0.01, P2 : F(2, 48)=3.453, P!0.05, P3 : F(2, 48)=7.147, P!0.01], and Oz [N2 : F(2.48)=4.985, P!0.05]. The post hoc test clarified that the short-wavelength (blue)-evoked FVEPs showed larger amplitudes than long (red)- or middle (green)-wavelength-evoked FVEPs (Figure 1). Cor-relation coefficients between the amplitudes of FVEP obtained at each wavelength and state and trait anxi-ety scores estimated by the STAI are indicated in Table 1. In state anxiety, a significant positive cor-relation was observed with the amplitude of the P3 component of FVEPs evoked in green light from the Fz region (R=0.482, P!0.05). In trait anxiety, a
significant correlation was observed with the ampli-tude of the N3 component of FVEPs evoked in red light-evoked from the Cz region (R=0.495, P!0.05).
Other peaks and region were not significantly cor-related. These data plots are shown in Figure 2.
Figure 1. Grand average FVEP waveforms from all electrodes and wavelengths in 17 participants. Short- wavelength- evoked FVEPs show greater amplitudes compared with long - and middle - wavelength FVEPs. Latency did not change significantly. *P!0.05, **P!0.01 vs long wavelengths, #P!0.05 vs middle wavelengths.
Table 1. Coefficient correlation between FVEP amplitudes in each wavelength and STAI scores.
STAI long middle short STAI long middle short
score (635 nm) (527 nm) (470 nm) score (635 nm) (527 nm) (470 nm) N2 state 0.354 0.197 0.162 N2 state 0.055 0.092 - 0.091 trait 0.231 0.103 - 0.036 trait - 0.088 0.016 - 0.268 P2 state 0.41 0.444 0.462 P2 state 0.215 0.062 0.275 trait 0.31 0.238 0.286 trait 0.072 - 0.092 0.122 Fz Pz N3 state 0.33 0.262 0.087 N3 state 0.139 - 0.187 - 0.234 trait 0.334 0.042 - 0.039 trait 0.202 - 0.201 - 0.373 P3 state 0.179 0.482* 0.37 P3 state 0.085 - 0.302 0.116 trait 0.178 0.219 0.19 trait 0.033 - 0.466 0.115 N2 state 0.265 0.198 0.004 N2 state - 0.294 - 0.241 - 0.006 trait 0.148 0.122 - 0.128 trait - 0.257 - 0.042 - 0.042 P2 state 0.351 0.318 0.328 P2 state - 0.073 0.016 0.117 trait 0.27 0.179 0.24 trait - 0.173 - 0.025 - 0.025 Cz Oz N3 state 0.446 0.052 - 0.187 N3 state - 0.218 - 0.288 - 0.362 trait 0.495* - 0.062 - 0.237 trait - 0.173 - 0.359 - 0.359 P3 state 0.197 0.104 0.332 P3 state 0.127 - 0.313 - 0.393 trait 0.177 - 0.103 0.251 trait 0.021 - 0.421 - 0.421 *P!0.05.
DISCUSSION
The present results suggest that the processing of spectral information has some specificity, and negative emotional conditions affected this process-ing in the middle and long wavelengths studied.
In grand averaged FVEPs, the short-wavelength-evoked FVEPs showed larger amplitudes than long-and middle-wavelength-evoked FVEPs in spite of equal LED intensity. Rodents and primates have Melanopsin-containing intrinsically photosensitive retinal ganglion cells (ipRGCs) that facilitate circa-dian photoentrainment (13). However, recent re-ports suggest that the ipRGCs also contribute to image-forming vision (14). Due to the peak sensi-tivity of Melanopsin being around 470-480 nm in hu-mans (13), the enlarged amplitudes in short-wave-length-evoked FVEPs in our study may be a result of the contribution of both S cone cells and ipRGCs. On the other hand, the peak sensitivity of rod cell is around 490 nm (10), so the possibility that the ex-citation of rod cells affects the amplitudes in short-wavelength-evoked FVEPs also needs to be con-sidered. Further study will be needed to clarify the mechanisms of these amplitude differences.
With regard to the correlations between FVEPs and STAI scores, the amplitudes of P3 in middle-wavelength-evoked FVEPs from Fz and N3 in long-wavelength-evoked FVEPs from Cz showed signifi-cant positive correlations with state and trait anxiety scores, respectively. These results suggest that anxi-ety affects secondary visual processing in prefrontal
regions, after V1. Similarly to our study, Shackman
et al. reported that the amplitude of early
compo-nents (184-236 ms, N1) of event related potentials in prefrontal regions evoked by a visual discrimination task was increased by threatening stress (7). They suggested that the stress-induced amplification of N1 stems from modulation of extrastriate cortex by the amygdala or lateral prefrontal cortex. The anxie-ty-induced amplification of N3 and P3 in our FVEPs may be also derived from a modulation of extra-striate cortex. However, short-wavelength-evoked FVEPs did not show any significant correlation with STAI scores. Color information from each class (S, M, and L) of cone photoreceptors project V1 via the parvocellular layers of the lateral geniculate nu-cleus. In this pathway, color information converts to 2 sets of the color-opponency system : red-green (represented by L-on/M-off and M-on/L-off) and blue-yellow (represented by S-on/(L+M)-off and (L+M)-on/S-off) (9). These differences in the col-or-projecting pathway may be involved with color-specificity in the FVEP-anxiety correlation uncov-ered in this study. In addition, Melanopsin-derived input from ipRGCs may also be related to this dif-ference.
Many early studies reported that negative emo-tional changes deteriorate contrast perception (1-4). Similarly, the long and middle wavelengths, which were affected by anxiety level in our study, are one of the color-opponency systems that contribute to red-green color contrast. Our present study indi-cated the possibility that perception of color contrast
Figure 2. Coefficient correlations between state anxiety score and P3 amplitude from Fz (A) and trait anxiety score and N3 amplitude from Cz (B). Each data point from short-, middle -, and long - wavelength- evoked FVEPs are shown in blue, green, and red plots, re-spectively. Significant positive correlations were observed in the middle and long wavelengths. Short- wavelength- evoked FVEPs did not show significant correlation with any amplitude.
is affected by negative emotion. The alteration of color contrast perception might also contribute to the “gray-colored glass” of depressive and anxious individuals, and not only changes in their contrast perception.
DISCLOSURE
All of the authors, Yuki Hosono, Kazuyoshi Kitaoka, Ryo Urushihara, Hiroyoshi Séi, and Yohsuke Kinouchi, declare that they have no con-flict of interest or financial ties to disclose.
ACKNOWLEDGEMENTS
This work was supported by Management Ex-penses Grants for National University Corporations, The Ministry of Education, Culture, Sports, Science and Technology (MEXT). We thank Ryuji Kaji (De-partment of Neurology, the University of Tokushima Graduate School) and Masaki Hashizume (Insti-tute of Technology and Science, the University of Tokushima Graduate School) for great assistance in carrying out this study.
REFERENCES
1. Bubl E, Kern E, Ebert D, Bach M, Tebartz van Elst L : Seeing gray when feeling blue? Depres-sion can be measured in the eye of the dis-eased. Biol Psychiatry 68 : 205-208, 2010 2. Bubl E, Ebert D, Kern E, Tebartz van Elst L,
Bach M : Effect of antidepressive therapy on retinal contrast processing in depressive dis-order. Br J Psychiatry 201 : 151-158, 2012 3. Fam J, Rush AJ, Haaland B, Barbier S, Luu C :
Visual contrast sensitivity in major depressive disorder. J Psychosom Res 75 : 83-86, 2013 4. Laretzaki G, Plainis S, Argyropoulos S, Pallikaris
IG, Bitsios P : Threat and anxiety affect visual contrast perception. J Psychopharmacol 24 : 667-675, 2010
5. Normann C, Schmitz D, Furmaier A, Doing C, Bach M : Long-term plasticity of visually evoked potentials in humans is altered in major depression. Biol Psychiatry 62 : 373-380, 2007 6. Weinstein AM : Visual ERPs evidence for en-hanced processing of threatening information in anxious university students. Biol Psychiatry 37 : 847-858, 1995
7. Shackman AJ, Maxwell JS, McMenamin BW, Greischar LL, Davidson RJ : Stress potentiates early and attenuates late stages of visual proc-essing. J Neurosci 31 : 1156-1161, 2011 8. Fitzgerald PJ : Gray colored glasses : Is major
depression partially a sensory perceptual dis-order? J Affect Disord 151 : 418-422, 2013 9. Conway BR, Chatterjee S, Field GD, Horwitz
GD, Johnson EN, Koida K, Mancuso K : Ad-vances in color science : from retina to behav-ior. J Neurosci 30 : 14955-14963, 2010
10. Schnapf JL, Kraft TW, Nunn BJ, Baylor DA : Spectral sensitivity of primate photoreceptors. Vis Neurosci 1 : 255-261, 1988
11. Wu F, Chang E, Lee Y : Manifestation of de-pressive tendency in color perception and col-ors utilized in creating a self-portrait. Color Res Appl 34 : 84-92, 2009
12. Odom JV, Bach M, Brigell M, Holder GE, McCulloch DL, Tormene AP, Vaegan : ISCEV standard for clinical visual evoked potentials (2009 update). Doc Ophthalmol 120 : 111-119, 2010
13. Hankins MW, Peirson SN, Foster RG : Melanopsin : an exciting photopigment. Trends Neurosci 31 : 27-36, 2008
14. Schmidt TM, Do MT, Dacey D, Lucas R, Hattar S, Matynia A : Melanopsin-positive intrinsically photosensitive retinal ganglion cells : from form to function. J Neurosci 31 : 16094-16101, 2011