Statistical Comparison of Character Use
Between English and Melanesian Languages
著者
SUGITA Shigeharu
journal or
publication title
南方海域調査研究報告=Occasional Papers
volume
5
page range
219-228
URL
http://hdl.handle.net/10232/15889
Kagoshima Univ. Res. Center S. Pac, Occasional Papers, No. 5. p. 219-228. 1985 219
Statistical Comparison of Character Use
Between English and Melanesian Languages
Shieeharu Sugita*
Abstract
This paper simply presents several statistical data concerning character use in the text written in different languages. They are 1) frequency table of alphabet use, 2) distribution of word length, 3) distribution of sentence length measured by mumber of words used in the sentence, and 4) digram of alphabet connection.
Main object of this work is to make statistical comparison between English and Melanesian languages such as Pijin, Fijian, Bislama, and ARE'ARE.
Sample texts used for analysis are obtained from Fiji and Solomon islands when the second scientific survey group of the south pacific, organized by the Kagoshima University Research Center for the south pacific, visited to their island in 1982.
The solomon Pijin is not used for writing purpose but used for spoken purpose. Therefore character use has not so much meaningfull. But nowaday there are appearing
newspapers and textbooks which are written in Pijin or Fijian etc., so that written from
of their languages are becoming popular in Islands.
Sample texts
The textbooks inputted into computer for this purpose are listed below. The numerals indicated inside of parentheses means total number of words used in that text.
PIJIN Stori Abaotem Sir Jacob Vouza ( 2182 words)
Samfala Kastom Stori an Kastom Wei ( 5883 words)
Kastom Stori long Narafala ( 4100 words)
Mista Aao an Mista Totel ( 18100 words)
FIJIAN Tavialolowai ( 3460 words)
Na 1 Tovo Vakapasifika ( 43427 words)
Dua Ga Na Bogi ( 68548 words)
BISLAMA Ripot blong rijinal konfrens long Ian manejmen ( 20760 words)
ARE'ARE Six Stories of Rapu" anate ( 8617 words)
ENGLISH The golden bough (41 1866 words)
The chrysanthemum and sword ( 89806 words)
The Burman (22 1 147 words)
220 Si'GiTA : Statistical Comparison of Character Use
Statistics
3.1 Alphabet use
A simple frequency of alphabet use in each text is counted. Graph 1 shows distribution of each character in percent scale. In this graph, symbols such as space and
hyphen etc are omitted.
3.2 Word length
Graph 2 shows distribution of word length measured by number of characters.
Vertical unit of graph is percent (%).
3.3 Sentence lengh
Graph 3 shows distribution of sentence length measured by the number of words in the sentence. Horizontal unit of the graph is five words, that is, the first position indicates the percentage of total sentence of length from 1 to 5 words, the next position
from 6 to 10, etc.
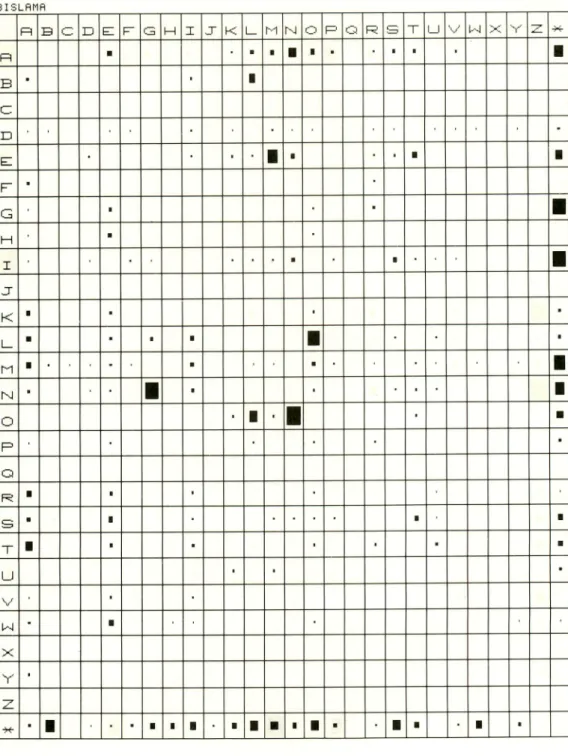
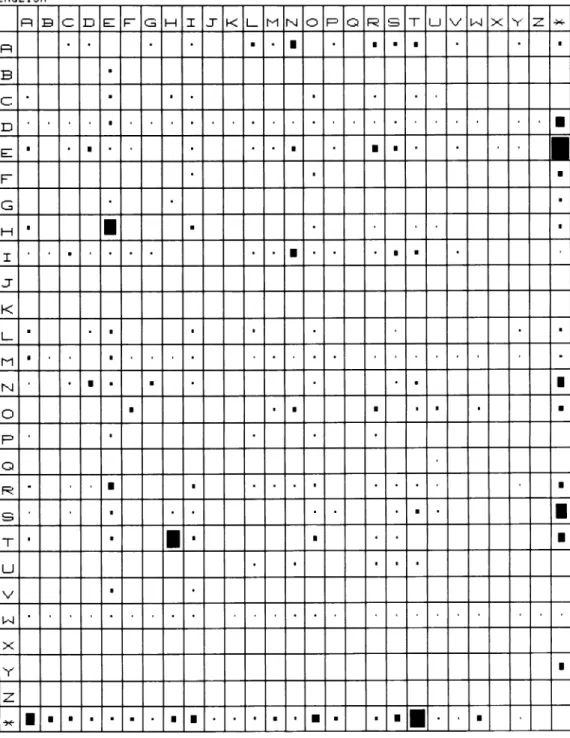
3.4 Digram ; frequency table of alphabet connection
Table 1 to 5 show the connection frequency of alphabets. The frequency is
represented by the largeness of square. The blanc position does not necessarily means zero frequency, because small value can not be printted out in visual size.
In this table, if you want to see the frequency of alphbet connection, for example "BY", first look up the left most column for "B", and then look up the upper most row
for "Y". The cross point of "B" row and "Y" column is the position of "BY"
connection.
Aknowledgements
This work was supported by the special research grant of the ministry of education,
science and culture, Japan (The second scientific survey of the south pacific, organized by the Kagoshima University Research Center for the South Pacific in 1982).
I would like to thank staffs of Research Center for the South Pacific, especially
Professors Tadao Katayama, Hachiro Hirata, Shinichi Terashi, and Yoshiaki Matsuda.
I also thank Professor Yuuichi Wada, National Museum of Ethnology, who was
Kagoshima Univ. Res. Center S. Pac, Occasional Papers, No. 5. 1985 221
Graph 1. Frequency of alphbet use in the text
P I J I N 2 0 %i 1 5 ? . 1 0K • S'H
1
•
-
_ - - L
1
-R B ! . 1 . 1 . 1 • 1 1 1 1 - . 1 1 . . . 2 D E F G H I J K l_ 1-1 N O P Q R S T U V H X - -FIJIAN £0>S 1 5 H l S*s r s ;1
-_ -_ - 1
_
1
. . I I _ . . 1 1 1 _ , f=1 B C D E F G H I .J K L M N O P Q R a T U V H X Y Z EISLflMfl £ 0 f ; 1 5 % 1 0*; 5 % • • - - • 1 R B '._ 1 _ 1 _ 1
. 1 1 1 1 .
. 1 1 . . .
; D E F G H I J K l_ M N O P Q R S T U V hi > - = HRE'RRE 2 0 % 1 0'--; 5 «1
1 1
1
1 1 1 -
1 .
.
1
F3 B C: D E F G H I J K l_ M N O P Q R S T U *>•' W > Y 21 ENGL IS H 2 0 J; 1 S*S B'<1 . . 1 1 . . 1 1
I . 1 1 -
I I I . - .
.
R B C D E F G H I J K l_ 1-1 N O P Q R S T U V W X Y ZSlJGITA : Statistical Comparison of Character Use
Graph 2. Distribution of word length
1 5 ;
ffffi
10S-; BH1
1 2 3 4 B G 9 10 11 12 13 14 15 16 17 18 19 2B F I J I A N - .c r•:•-• 2 0 Ji 1 5 S« 1QJ< 5*;1
1
1
1
IX 1
• 1 • 1 2 3 4 5 6 8 9 ID 11 12 13 14 15 i e i la 19 2S E I S L fl M fl I S ? :ttffi
5 ? ;t
1 - 2 3 4 5 6 9 LB 11 12 13 14 15 16 17 18 19 2B ARE'ARE .-, ^.,,. 2 0 % 1 5 H 1 0 *1
1
5>.1
1
_|_
1
1
z t
1
H • 1 2 3 4 5 6 8 9 IB 11 12 13 14 15 16 1 7 18 19 20 ENGLISH _ c -. . . . 2 0 * • • 1 0 H1
1 .
BHl
l l 1 I
• 1
1 21 1 1 1 1 • .
3 4 5 6 7 8 9 IB 11 12 13 14 15 16 L7 18 19 20Kagoshima Univ. Res. Cenier S. Pac.. Occasional Papers, No. 5. 1985 223
Graph 3. Distribution of sentence length
P I J I N
s
I
• • -5 IB 15 20 25 30 35 40 45 50 55 50 65 70 75 50 55 50 FIJIAN d •' .-••:• 2 Q*i 1 5 % • i a nl l l i
5S-;1 1 1 1 1 1 •
5 10 15 20 25 30 35 40 45 50 55 BS 65 70 75 50 55 50 EISLA11A G>,I • I I I I I •
5 10 15 20 25 30 35 40 45 50 55 E0 55 70 7,5 50 55 50 ARE"AREi
5 10 15 20a
25 30 35 40 4 5 50 5 5 60 55 70 75 50 55 90 ENGLISH 5 *• • I I I I I • . •=
5 10 IS 20 25 30 35 40 45 50 55 E0 55 70 75 90 95 90224 Sugita : Statistical Comparison of Character Use
Table 1. Matrix of character combination in the text (The sign * Represents space or
symbols) PIJIN R B C D e: F G H I j r K l_ M N O R Q R s T U V N X Y Z -x-R • • • • • • • ' • • • •
•
B i • • • C D • • • • • • -e: • • • • •I
• • • • • • • F • • • G • • H • • • I • • • • • • • • • • • • J" K • • t • • L_ • • • • • • • -M • • • • • • • • • • ••
N • • • • • • • • O • • • • • • • • P • • • • Q R • • • • • S • • • • • • • • • • • T • • • • • • U • • • • V • • w • • • • • • • X Y • z * e • • • • • • • • • • I I • • • • • • •-Kagoshima Univ. Res. Center S. Pac, Occasional Papers. No. 5, 1985 225
Table 2. Matrix of character combination in the text (The sign * represents space or
symbols) FIJIAN M B L_^ D E R G H I J" K L_ M N o R Q R , -T U \ j 1--J — rA
R • • • • • • • • • •i
B ' r~7 • • D -EZ • • • F '--3 • H I • 1 i ••
J K•
• • • L_ • • • M • • ' ' N•
• • o • • • • • • • p Q • R • S • • T • I • • U I • • • • • • • • • W 1 X Y • 2H "
• - • • • ••
••••
' I • • ' • •226 SuGITA : Statistical Comparison of Character Use
Table 3. Matrix of character combination in the text (The sign * represents space or symbols) BISLArlA 1—1 B c_; ID E R G H I J" K l_ M r-j r." 3 R Q R S T _l 1--1 X V ...-• *« R • • • • I • • • • • B • • I C D -e: • • • ' • • R • G • • • H • I • I • J K I • • • l_ • • • • • • M • - • • • N •
•
• • • I O • I •I
• • R Q R • • • S • • • • T I • • • • • • U • • • V • w - • X Y • z ** • • ' • • • • •Kagoshima Univ. Res. Center S. Pac, Occasional Papers, No. 5, 1985 227
Table 4. Matrix of character combination in the text (The sign * represents space or
symbols) ARE 'ARE R B C D R R Cj H I J" K L_ M N o R rjt R s T U '••/ w x v z
d
R • • • • • • • • • • • •fl
B C D R UI
R G H • • • • I • • • • •I
J K • • • • l_ 1-1 • • NI
• • • • O • • • • I P • • Q R•
• • • 1 S • • T • I • u • • > • V w • X Y 2 •Xr•
• • • • • • • • • • • • I228 SuGiTA : Statistical Comparison of Character Use
Table 5. Matrix of character combination in the text (The sign * represents space or symbols) ENGLISH R B C D e: F G H I J" K l_ M N O R Q R s T U V w X Y z **• R • • • • • • I • • • • • • • B • C • • • • • • • D • • • • • • • • • • • • • • e: • • • • • • • • • • • • • •