Change in the Terrestrial Invertebrate
Community Structure in Relation to Large Fires
at the Kutai National Park, East Kalimantan
(Borneo), Indonesia
著者
YAJIMA Takaaki
journal or
publication title
南方海域調査研究報告=Occasional Papers
volume
14
page range
63-81
URL
http://hdl.handle.net/10232/16244
CHANGE IN THE TERRESTRIAL INVERTEBRATE COMMUNITY STRUCTURE
IN RELATION TO LARGE FIRES AT THE KUTAI NATIONAL PARK,
EAST KALIMANTAN (BORNEO), INDONESIA
Takaaki Yajima
Department of Biology, College of Liberal Arts Kanazawa University, Kanazawa 920, Japan
I. INTRODUCTION
The tropical rain forests, where plants and animals are most abundant, are the earth s remaining great treasure houses of nature. Among these tropical rain forests, the primary lowland
forest of East Kalimantan (Borneo, Indonesia) is one of the most
magnificent (Kira,1983). In 1982-83, however, this lowland tropical rain forest suffered by a serious drought associated with the intense El Nino (Leighton,1984, Wirawan,1984, Malingreau
et al.9 1985).
The purpose of this study was to find out the changes in terrestrial invertebrate community structures in relation to the recovery of the forests after large fires and the significance of this for the preservation of tropical rain forests. The research
was done at the Kutai National Park, East Kalimantan, from 25
July to 23 August 1986, taking into consideration the various vegetation types such as unburnt, burnt and logged forests.
II. AREA SURVEYED
The area of Kutai National Park and stations surveyed is shown in Fig. 1. After consideration of the influence of large fires and the human impact on nature, the following eleven
stations were selected.
UNF: Unburnt natural Shorea forest at 165 to 185m above sea
level near Km 37.
UNF: Unburnt natural Dryobalanops forest at 200m above sea
near the Km, 45.
USF: Unburnt secondary Macaranga forest at 150m above sea
level near the Km 37.
BNF: Burnt natural Shorea forest at 245m above sea level near
-63-^0
s i Jakakarta
'"•-. Track of logging roads
. s Main rivers
-fc Stations surveyed • Camp sites
Unburnt dryland forests
Unburnt mangrove and coastal forests o 10 Burnt forests
Fig. 1. Outline map and vegetations of Kutai National Park showing
the stations surveyed.
UNF-1 and UNF-2:Unburnt natural f o r e s t s USF:Unburnt secondary forest
BNF:Burnt n a t u r a l f o r e s t
BSF:Burnt secondary forest
Open fields of Melastoma shrub (MEL) and Imperata grass
(IMP) were surveyed also. The stations of MEL-1 and
IMP-1, MEL-2 and IMP-2, and MEL-3 and IMP-3 located
near USF, BNF, and BSF, respectively.
the Km 45.
BSF: Burnt secondary Omalantus, Croton and Mallotusforest at
245 to 280m abobe sea level.
MEL: Open fields of Melastoma shrub along logging roads.
Three stations of MEL-1, -2 and -3 were selected near USF, BSF and
BNF, respectively.
IMP: Open fields ofImperata grass along logging roads. Three stations of IMP-1, -2 and -3 were selected near USF, BSF and BNF, respectively.
III. METHODS
-64-1. Macro soil-animals
The density and biomass of macro soil-animals whose body sizes exceed 2mm were studied. Four quadrats of 50 x 50cm were
set on flat floor at each station after consideration of the
microtopography. From the results of preliminary research at
UNF, it was found that fermentation of the soil layer was lacking and macro soil-animals were found only in a surface soil layer of
10cm in depth. Therefore, the macro soil-animals in each layer
of litter (L), humus (H), and surface soil (A) within 10cm depth were collected by hand sorting with tweezers. However, ants were
excluded because of the numerous numbers found.
As the surface soil which had been dug up contained a great deal of clay, it was very hard to put through a 2mm mesh sieve in
order to collect the soil animals. Therefore, the macro
soil-animals had to be found in the soil after cutting the soil by hand.
2. Floor animals
The floor invertebrates were collected quantitatively using
a pitfall trap. At each station, eight plastic cups (10cm in
height and 7.5cm in caliber) were sunk about 5m apart from one another in the ground so that the rims were on the level of the soil or letter surface. A little water was put into each cup so that the animals trapped could not escape easily from the cup.
Many cursorial arthropods which had fallen into the traps were collected on each of three mornings after setting.
3. Phytal animals
Phytal invertebrates were collected quantitatively at each station by the sweeping method.
The sweeping was done with a sweep net of 42cm in diameter having a wooden handle of 130cm in length. The sweepings were
done ten times at each station, and the invertebrates collected
were killed with etyle acetate.
All the samples collected by these various methods were sorted by species in the laboratories at Km 37 and Bontang, and were preserved in vials, plastic tubes and small plastic pouches
with 70 per cent alcohol, except for almost all of the insects,
which desiccated instead.
After weighing the biomass of macro soil-animals, all
-65-Table 1. Number of species and percent composition (in parentheses) of macro soil-animal communities at each station. For abbreviations, see Fig. 1. Animals UNF-1 UNF-2 USF BNF BSF MEL-1 MEL-2 MEL-3 IMP-1 IMP-2 IMP-3 Turbellaria 1(0.8) Gastropoda 6(4.9) 1(1.2) 2(2.2) 4(7.1) 5(5.5) 1(1.8) 1(5.0) Oligochaeta 59(48.0)* 41(48.8)* 63(68.5)* 44(57.9)* 36(64.3)* 64(70.3)* 3( 5.5) 7(35.0) 4(50.0) Hirudinea 1(0.8) 1(1.1) 1(1.8) Acarina 2(2.2) 1(1.8) Araneae 7(5.7) 2(2.4) 1(1.3) 1(1.1) 2(16.7) 4(7.3) 1(12.5) Isopoda 2(1.6) 14(16.7)* 6(6.5) 2(2.6) 3(5.4) 2(2.2) Chilopoda 12(9.8) 6(7.1) 3(3.3) 6(7.9) 1(1.8) 2(2.2) 1(8.3) 3(5.5) 1(5.0) Diplopoda 6(4.9) 3(3.3) 1(1.1) 4(5.3) 2(3.6) 1(1.1) 1(1.8) Collembola 1( 1.1) Thysanura 1( 1.3) Orthoptera 1( 1.8) 3( 5.5) Dermaptera 2(1.6) 3(3.6) 2(2.2) 7(9.2) 1(1.8) Dictyoptera 3(3.6) 3(3.3) 3(3.9) 4(4.4) 1(8.3) 40.3) 2(10.0) 1(20.0) Hemiptera 2(2.4) 1(1.1) 1(8.3) 2(25.0) Coleoptera 5(4.1) 2(2.4) 1.(1.1) 4(5.3) 2(3.6) 3(3.3) 6(50.0)* 23(41.8)* 9(45.0)* 3(60.0) 1(12.5) Larva 19(15.4)* 6(7.1) 6(6.5) 4(5.3) 5(8.9) 7(7.7) 1(8.3) 11(20.0) 1(20.0) Unknown 3(2.4) 1(1.2) 1(1.1) 1(1.1) 1(1.8) No. of species 32 23 22 23 13 14 7 27 7 3 4 No. of individuals 123 83 92 76 56 91 12 55 20 5 8 e 3.642 3.865 2.039 2.938 2.150 1.770 9.429 19.655 4.500 3.333 6.000 N/9 394.6 324.7 183.5 223.3 114.0 150.4 113.2 963.1 85.5 16.7 24.0
20CV 150 -.t-: 100 c Q 50 OL t s ion b *—. ' " " s 50 + m en o — ^—» in JL cn flj R -5 -»—i Qj £ _i-t • * J l _ U_ L_ U_ U_ _J Q_ Z 1/1 Z t/1 UJ 2 z> Z) m m s ~
Fig. 2. Density and biomass of macro soil-animals collected in each
quadrat (50x50 cm) at each station. Star symbols in UNF and USF mean the collection of one big Diplopoda, Sphaerobelum sp. For
abbreviations, see Fig. 1.
reference species collected were submitted to specialists for identification. The identification, however, was very difficult
to do in a short time. Therefore, in this report, the community
structures among the stations surveyed were compared with the
taxon of order or c l a s s l e v e l .
IV. RESULTS AND DISCUSSION
1 . Macro s o i l - a n i m a l s
A summary of results for macro soil-animals collected at each
s t a t i o n i s shown i n Table 1.
-67-L H A H
Density ( /m2)
50 100 - i — i — i — i — i — i — i — i — ili
Lb
UNF-1 Density \ Wet weight BNF BSF L_J I I I I I I I l_l I I I I I I L_l l_l l_l 0 5 10 15 20Wet weight (g/m2)
Fig. 3. Vertical change of macro soil-animals, at each forest. For abbreviations, see Fig. 1.
The number of individual macro soil-animals collected at
each station was very few, and so the total number of individuals was only 621. In the forests, the dominants, which are the significance with 90 per cent reliability from the mean occurrence rate (Kato, et al. , 1952), were earthworms Oligochaeta. On the other hand, in the open fields, the dominants, except for the Oligochaeta at MEL-1, were many kinds of Coleoptera of MEL-2 and -3, and IMP-1. Moreover, Isopoda, Diplopoda and Dermaptera, which were not dominants except for Isopoda of UNF-2, appeared, oddly enough, not in open fields but in forests. It was interesting that living land snails of Gastropoda, Collembola and Amphipoda were absent or rarely found at each station, and old dead and
damaged shells were collected only on and/or in soil. This was
interesting because, in temperate forests such as those of Japan,
-68-living land snails, Collembola and Amphipoda are common species
of macro soil-animals. These tendencies in tropical forests were
reported by Aoki and Harada (1982).
Fig. 2 shows the results of the density and biomass of macro soil-animals collected in each quadrat at various vegetations.
Generally, density and biomass decrease gradually from the
unburnt forests to open fields of Imperata grass according to the
degree of destruction of nature by means such as burning and logging. Watanabe et al. (1983) observed, in Northeast Thailand, a drastic decline in the density and biomass of macro soil-animals following burning. But even in the same station, the density and biomass collected at each quadrat changed widely. This was mainly due to the difference in the number of individuals and the weight of the larger earthworms collected, except two quadrats of UNF and USF where a big Diplopoda was found. The intensity and frequency of burning might affect the soil fauna and vary the ecological environment. However, the actual intensity of burning on soil fauna at each burnt forests was not known for the purposes of this research.
Fig. 3 shows the results of vertical change in macro
soil-animals at some unburnt and burnt forests.
As the research was done in the dry season, the thickness of
litter was 3 to 4cm of fallen leaves such as deciduous Diptero carpus. Allmost all of the fallen leaves were in their original form without decomposition, and the fermentation layer could not be identified. A small humus layer had formed and the thickness was only a few millimeters. Therefore, the density and biomass
at the litter layer were more scanty. As the earthworms and
larvae of beetles appeared in increasing more from the humus to the surface soil, the density and biomass increased correspond
ingly.
These results, that the number of species and individuals, and the biomass of macro soil-animals were not great (Table 1 and Figs. 2, 3), were consistent with those found by Watanabe
et al.(1966) in a dry season in Thailand, and Aoki and Harada
(1982) in a wet season in East Kalimantan. The reasons for the
poverty of the fauna and biomass may be the lack of a fermentation layer, and the fluctuations in soil moisture content (Lei,1987). Therefore, research on the seasonal changes in fauna and biomass of macro soil-animals needs to be carried out throughout the whole
-69-20 n
log
N(3 Soil11•i•.11I•!
lllllllll.i
•— rsj ,_ cm o~> ,— csi noI I I I I I I i
L l L l L l L l L l _j _l —I CL CL Q_
Z Z l ^ ) Z ( / ) U J L L l L a J 2 2 5 :
Z ) 3 = ) m m 2 2 ; 2 : — — —
Fig. 4. Comparison of species diversity (B) and total species
diversity (NIB) of macro soil-animal communities at each station expressed by Morisita s indexes. For abbreviations, see Fig. 1.
year.
The species and total species diversities (Morisita,1967) of
macro soil-animals were compared among the stations surveyed and
the results are shown in Fig. 4.
Against expectation, the value of species diversity was higher in open fields than in forests. The reason for this
difference was that an earthworm with a large number of
individuals was dominant in forests, and many kinds of beetle with a,small number of individuals were dominants in open fields,
especially at MEL-2, -3 and IMP-1.
The value of Morisita s index of diversity correlates not only with the number of species but also with the number of
individuals, and so the value is highest when the total number of
-70-I Table 2. Number of species and percent composition (in communities at each station. For abbreviations, see Fig. 1.
Aniaals Gastropoda Oligochaeta Opiliones Acarina Araneae Isopoda Chilopoda Diplopoda Colleabola Thysanura Orthoptera Dictyoptera Isoptera Psocoptera Thysanoptera Heaiptera Lepidoptera Diptera Coleoptera Hyaenoptera Larva Unknown
UNF-1 2( 1.6) 1( 0.8) 5( 4.0) 2( 1.6) 3(2.4) 2( 1.6) 4( 3.2) 1(0.8) 4< 3.2) 9( 7.1) 91(72.2)* 2( 1.6) UNF-2 3( 1.9) 3( 1.9) 2( 1.3) 2(1.3) 1(0.6) 1(0.6) 5(3.2) 3( 1.9) 134(85.9)* 2( 1.3) USF 1( 1.0) 1( 1.0) 2( 2.0) 1( 1.0) 8( 8.0) 1( 1.0) 2( 2.0) 1( 1.0) 8( 8.0) 72C72.0)* 3( 3.0) BNF 7( 6.9) (2.0) 3( 3.0) 4( 4.0) 3( 3.0) 11(10.9) 71(70.3)* BSF 2( 1.0) 3(1.5) 1(0.5) 1(0.5) 25(12.5) 8( 4.0) 1(0.5) 1(0.5) 9(4.5) 15( 7.5) 133(66.5)* 1(0.5) MEL-1 5(2.7) 10( 5.3) 2( 1.1) 3( 1.6) 3( 1.6) 1(0.5) 5(2.7) 2( 1.1) 1(0.5) 3( 1.6) 10( 5.3) 14004.5)* 3( 1.6) parentheses) of floor invertebrate MEL-2 8( 3.1) 4( 1.5) 16 ( 6.1) 5( 1.9) 5( 1.9) 1(0.4) 223(85.1)* MEL-3 3( 2.3) 11(8.0) 1( 0.8) 1( 0.8) 3( 2.3) 3( 2.3) 18(13.5) 5( 3.8) 5( 3.8) 4( 3.0) 79(59.4)* IMP-1 11(8.0) 6(4.4) 12( 8.8) 2(1.5) 2(1.5) 3( 2.2) 101(73.7)* IMP-2 1(0.7) 7( 4.9) 2(1.4) 5(3.5) 7( 4.9) 3( 2.1) 3( 2.1) 2(1.4) 113(79.0)* IMP-3 1(0.4) 10( 3.5) 5(1.8) 16( 5.6) 5( 1.8) 2(0.7) 1(0.4) 245(86.0)* No. of species 49 35 23 43 55 40 40 49 27 37 35 No. of individuals 126 156 100 101 200 188 262 133 137 143 285 & 6.5299 3.6328 2.2822 6.7423 4.7777 3.1686 6.1717 21.1518 3.5914 5.1748 4.0430 N0 822.8 566.7 228.2 681.0 955.4 595.7 1617.0 2813.2 492.0 740.0 1152.2
individuals is small and the number of individuals divides evenly
in each species. Therefore, he suggested that the index of total
species
diversity
be
used
along
with
the
index
of
species
diversity.Except for MEL-3, the value of Nfl decreased from unburnt
natural forests to opne fields. This suggests that the macro
soil-animal community at each station became simpler under the
influence of large fires and/or human impact.
2. Floor animals
A summary of results for floor invertebrates collected at
each station is shown in Table 2.
The floor invertebrate fauna ranged through more taxonomic
groups than the macro soil-animal fauna, and the total number of
individuals was 1,831. Almost all of the individuals collected were ants, and so many species of ant were dominants at each
station.
If the piftall traps had been set near the nests and/or
walking routes of ants, many ants might have been collected in
the same trap throughout the days surveyed. However, the pitfall traps were not set near ant nests and not many ants were collected in each trap on the days surveyed.
Many arthropod groups of Araneae, Collembola, Orthoptera, Diptera, Coleoptera and Hymenoptera were collected widely with the pitfall traps not only in forests but also in open fields.
Therefore, in the order level of taxon, the difference in floor
arthropod faunas between the forests and open fields was not recognizable as was the difference in macro soil-animal faunas
(Table 1).
A comparison was made of the degree of similarity of species composition, as collected with pitfall traps, for the stations of unburnt secondary forest, open fields of Melastoma shrub
and Imperata grass, and the results are shown in Table 3. These
three stations were located together within a short distance of
about 100m in diameter. At each station, four pitfall traps were
set and the collections were continued for ten days. The degree
of
similarity was expressed by Kimoto s index of Crr(Kimoto,1967).
According to Table 3, the community structures of MEL and
IMP of open fields were very similar. Meanwhile, that of USF
differed from those of open fields. However, even at the same
station, the similarity of species composition as collected with
-Table 3. Comparison of the similarities between the floor invertebrate communities collected at different station of Km 37
(Total) and at each station (USF and MEL) expressed by Kimoto's index of similarity. For abbreviations, see Fig. 1.
Total MEL 0.340 IMP 0.2 37 0.949 USF MEL
USF
2 0.790 3 0.652 0.549 A 0.541 0.472 0.967 1 2 3 MEL 2 0,731 3 0.711 0.343 A 0.897 0.610 0.8 58 1 2 3Pitfall trap
four pitfall traps, differed. These facts, first of all, may be
due to the difference in species composition of ants including
some dominant ones.
The species and total species diversities of floor invertebrates were compared among the stations and the results are
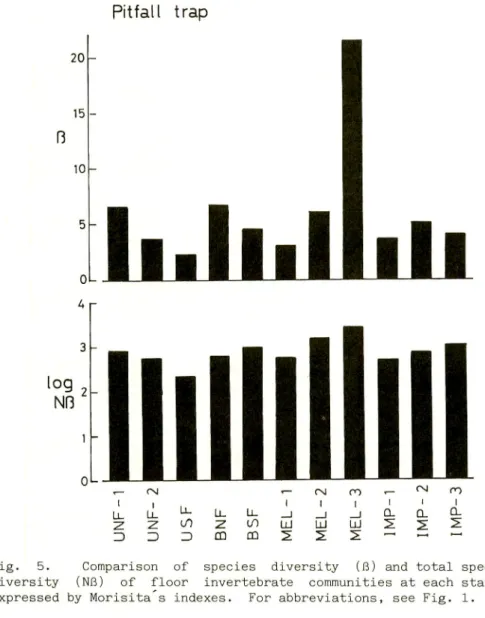
shown in Fig. 5.
The values of ft and Nfl of MEL-3 were the largest, and so the
complexity of fauna was not correlated with the difference in
vegetation types. One of the reasons for this discrepancy may be the difference in ant fauna at each station, because the ants were the dominant group and the number of individuals was not so different from station to station as shown in Table 2. Thus, the
-73-20 15 10
log
NilPitfall trap
•••••••!•••
iiiiiiiiiii
«- rsj "— CNJ CO r- ^ ro l i , l I i i < I U . U _ L j - L L L L _ l _ J _ j C L Q . a : ^ Z U O Z L O I j J L l I I j J S S S : 3 Z ) = ) C Q C D 2 2 2 : — — ~Fig. 5. Comparison of species diversity (B) and total species
diversity (Nfi) of floor invertebrate communities at each station expressed by Morisita s indexes. For abbreviations, see Fig. 1.
values of 6 and NB were influenced mainly by the species composition of ants. An example is MEL-3, where many species of
ants with a small number of individuals, were collected.
3. Phytal animals
A summary of results for phytal invertebrates collected at
each station is shown in Table 4.
The phytal invertebrate fauna was much more complex than the
macro soil-animal and floor invertebrate fauna. At each station,
some orders of taxon dominated and the total number of
individuals collected was great, 6,019. Among the individuals,
-74-I en I Animals Table 4. Number of species communities at each station. UNF-1 UNF-2 and percent composition (in For abbreviations, see Fig. 1. USF BNF BSF hEL-1 parentheses) of phytal invertebrate MEL-2 MEL-3 IMP-1 lfP-2 IMP-3 Gastropoda IK 3.0) 9( 1.8) 7(1.5) K 0.1) Opiliones 1(0.2) 1(0.1) Acarina 1(0.3) 3(0.7) 1(0.1) Aranea 79(21.7)* 36(7.1)* 33( 6.9) 20( 4.8) 20(2.5) 212(16.9)* 126(13.3)* 94(18.5)* 56(24.7)* 34(10.2) 32(16.7)* Isopoda 1(0.3) Diplopoda 1( 0.2) Colleabola 4( 1.1) K 0.3) Thysanura 5(1.4) 2(0.4) 1(0.2) 2(0.5) 1(0.1) 1(0.1) 1(0.4) EpheMeroptera 1(0.2) 1(0.2) Odonata 1(0.2) 1(0.1) Orthoptera 17( 4.7) 32(6.4) 25(5.2) 46Q1.D* 47( 5.9) 18( 1.4) 46( 4.9) 2(0.4) 21 ( 9.3) 28(8.4) 28(14.6) Phasnida 1(0.2) 10 ( 2.1) 1(0.2) 1(0.1) K 0.3) Demaptera 1(0.3) 1(0.1) Dictyoptera 3( 0.8) 15( 3.0) 7(1.5) IK 2.7) 5( 0.6) 8(0.6) 3( 0.3) 2(0.4) 3( 1.3) 8(2.4) 3( 1.6) Embioptera 1(0.2) Psocoptera 3(0.6) 1(0.2) 1(0.2) 2(0.2) Thysanoptera 2(0.2) Heraiptera 15( 4.1) 10( 2.0) 38( 7.9) 18( 4.3) 38(4.7) 283(22.5)* 273(28.9)* 124(24.4)* 69(30.4)* 105(31.6)* 44(22.9)* Mecoptera 1(0.3) Lepidoptera 6( 1.6) 6(1.2) 3(0.6) 2(0.5) IK 1.4) 8( 0.6) 5(0.5) 23(4.5) 4( 1.8) 3( 0.9) 7( 3.6) Diptera 63(17.3)* 94(18.8)* 89(18.6)* 38(9.2) 85(10.6)* 42( 3.3) 78( 8.3) 10( 2.0) 15( 6.6) 46(13.9) 14( 7.3) Coleoptera 36(9.9)* 31(6.2) 75(15.7)* 38(9.2) 85(10.6)* 81(6.4) 122(12.9)* 35( 6.9) 23(10.1) 44(13.3) 32(16.7)* Hynenoptera 119(32.7)* 256(51.1)* 186(38.9)* 230(55.6)* 503(62.8)* 587(46.7)* 287(30.4)* 217(42.6)* 28(12.3) 62(18.7)* 29(15.1) Larva 2(0.5) 2(0.4) 2(0.4) 7( 0.6) 1(0.1) 1(0.2) 3( 1.6) Unknown 4( 1.0) 9(0.7) 7(3.1) No. of species 191 235 251 208 246 188 258 134 118 165 105 No. of individuals 364 501 478 414 801 1256 945 509 227 332 192 B 24.3606 12.2422 17.8509 18.9098 14.2021 5.7631 27.8827 24.5324 92.2698 63.9651 75.1475 N0 8867.3 6133.3 8532.8 3933.2 11375.9 7238.5 26349.2 12487.0 20945.2 21236.4 14428.3
100 r
Sweeping
. , _ rsi , — rsi CO r - c^ 7 Li Li. U_ Li_ Ll i 1 i j d. Q_ CL Z 2 if) Z (/) UJ UJ UJ 2 2 S 3 Z> 3 CD m 2 2 2 •—•Fig. 6. Comparison of species diversity (fl) and total species diversity (NB) of phytal invertebrate communities at each station expressed by Morisita s indexes. For abbreviations, see Fig. 1.
many flower-visiting insects might have been collected because of
Melastoma flowers being at their best. Many arthropod groups of
Aranea, Orthoptera, Dictyoptera, Hemiptera, Lepidoptera, Diptera,
Coleoptera and Hymenoptera were collected throughout all the
stastions. However, except for ants which were collected dominantly not only in forests but also in open fields, Diptera
and Coleoptera had a tendency to dominate in forests, and Aranea
and Hemiptera in open fields. Moreover, it is interesting that
some living land snails were collected, especially in unburnt forests.
The species and total species diversities of phytal invertebrates were compared among the stations and the results are
-76-50 - Pitfall trap
MEL
,*♦*''^
^^^
IMP
0 ^^ 1 1 i —i i 1 l I I •Sampling
times
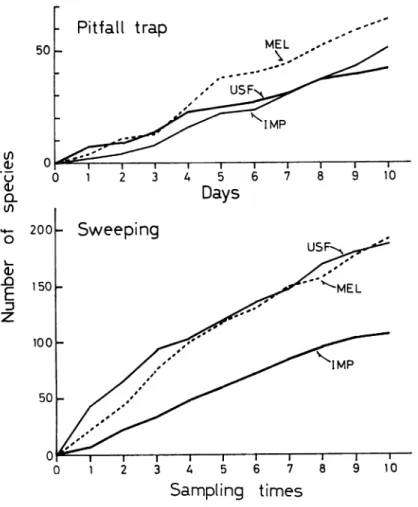
Fig. 7. Accumulative curve of number of species collected by
pitfall traps and sweepings at each station of Km 37. For
abbreviations, see Fig. 1.
shown in Fig. 6.
The values of ft in open fields of Imperata grass were higher
than at other stations because of many species having a small
number of individual each, whereas some dominant species,
especially ants had a larger number of individuals, and so the
values of ft were lower in forests and open fields of Melastoma
shrub.
Therefore, the values of total species diversity (Nfi) were
nearely similar among all the stations surveyed.
4. Conclusion
The
fauna
and
biomass of macro soil-animals had a tendency
to
become
more
simple
and
smaller
according to the change in
-vegetation after burning and/or logging (Table 1 and Figs. 2, 3,
4). However, such a tendency was not found in the results for the
floor and phytal invertebrate communities (Tables 3, 4 and Figs.
5, 6) .
Fig. 7 shows that, even if the number of species differed
among the stations, more and more new species were recruited with
an increase in collection. This suggests that the faunas of floor and phytal invertebrates not only in forests but also in open fields may be rich and complex. Therefore, the diversities of floor and phytal community structure will be affected largely by the difference in number of individuals of dominant species.
Termites play an important role in flow of energy and cycling of nutrients, and are economically and ecologically an important aspect of tropical ecosystems just as earthworms are. In the same East Kalimantan, Aoki and Harada (1982) reported that many termite species and individuals were collected widely from natural forests to shifting cultivated fields. However, in the
area of the Kutai National Park observed in this study, termites
and their mounds were difficult to find, and only three individuals were collected in the pitfall traps in the burnt natural forests (Table 2). The reason for the poverty of the
termite fauna in the area studied is not clear at this time and
more survey work is necessary.
As a result of this study, it was concluded that the diversity of terrestrial invertebrates recovers within three years after large fires. But the fauna after burning cannot be assumed
to be the same as the fauna before burning.
The burnt forests surveyed were located close to the unburnt forests (Fig. 1) , and so many species and individuals such as migratory insects may able to immigrate easily into the burnt forests from the unburnt forests. This assumption is supported
by the fact that the dominant ants such as Anoplolepis longipes
(Jerdon), Leptogenys sp. and Crematogaster sp. were found widely in the various vegetation types, where they were collected with
the pitfall traps and sweepings. On the other hand, most of the
land snails which cannot migrate easily will be damaged by burning and as a result, these snails survived and were collected at the
unburnt forests (Tables 1, 2, 4).
Therefore, studies on the change in structure of the terrestrial invertebrate community in relation to burning and
-78-logging will be necessary for more detailed investigation among the various vegetations, not only of the diversity of fauna but also of characteristic species such as land snails.
V. ACKNOWLEDGEMENTS
I am pleased to acknowledge the considerale assistance of
Mr. F. Ellia G. of Provincial Goverment of East Kalimantan during the field researches and also wish to express my gratitude to Professor H. Tagawa of Kagoshima University, who is the leader of
the joint party, and Dr. N. Wirawan of Hasanuddin University for
their many helpful suggestions and criticisms throughout the
course of my work. Thanks are also due to all the members of the
joint party for their kind support in my work and Dr. S. Yamane of Kagoshima University for the identification of ants. I should like to express my grateful thanks to the Indonesian Institue of Sciences (LIPI), Dr. S. Adisoemarto and Dra. R. Suhardjono of Bogor Zoological Museum, and many staffs of administrative office of the Kutai National Park. This study was supported by Grant-in-Aid for overseas Scientific Survey from the Ministry of Education, Science and Culture (Nos.61041067 and 62043063).
VI. SUMMARY
1. To know the change and recovery of terrestrial inverte brate community in the tropical rain forest after large fires, the
research was done at the Kutai National Park in East Kalimantan
(Borneo), Indonesia, in July to August 1986.
2. After consideration of the influence of large fires and the human impact on nature, eleven stations were selected from the unburnt natural forests, unburnt secondary forest, burnt natural forest, burnt secondary forest, and open fileds of Melastoma shrub
and Imperata grass.
3. The fauna of macro soil-animals, floor animals and phytal
animals were studied at each station.
4. The fauna of macro soil-animals was generally poverty in
each station, and according to the impacts of fires and human disturbance, the density, biomass and fauna of macro soil-animals became simpler.
5. No clear relationship was found between the faunas of
-79-floor and phytal invertebrates, and the environmental divisions. One of the reasons of these discrepancies in relation to the
environmental divisions was due to the difference of number of
species and individuals of ants which dominated in the floor and phytal invertebrate communities at each station,.
6. It may be said that the terrestrial invertebrate community recovered quickly beyond exceptation in the tropical rain forests
after burning.
VII. REFERENCES
Aoki, J. and H. Harada (1982) Environmental change and soil fauna
in East Kalimantan (Borneo). Bulletin of the Institue of
Environmental Science and Technology, Yokohama National University, 8:341-378. (In Japanese with English summary).
Kato, M., T. Matsuda and Z. Yamashita (1952) Associative ecology
of insects in the paddy field cultivated various planting forms. Science Report of Tohoku University, Series IV
(Biology), 19:291-301.
Kimoto, S. (1967) Some quantitative analysis on the Chrysomelid fauna of the Ryukyu Archipelago. Esakia, 6:27-54.
Kira, T. (1983) Nettai-rin no seitai (Ecology of tropical
forests). 251pp. Jinbun-syoin, Kyoto, Japan. (In Japanese). Lai, R. (1987) Tropical ecolgy and physical edaphology. 732pp.
John Wiley & Sons, Chichester, Great Britain.
Leighton, M. (1984) The impact of one of the world s worst forest fires. WWF Monthly Report June, pp.115-123.
Malingreau, J.P., G. Stephens and L. Fellows (1985) Remote sensing
of forest fires: Kalimantan and North Borneo in 1982-83.
Ambio, 14:314-321.
Morisita, M. (1967) Kyoto fukln ni okeru chyo no kisetu-bunpu (Seasonal distribution of butterflies near Kyoto). In Morisita, M. and T. Kira (eds.), Sizen:Seitaigau-teki-kenkyu (Nature:Ecological studies), pp.95-132. Chuokoron-sha, Tokyo, Japan. (In Japanese).
Watanabe, H.,P. Saichuae and T. Shidei (1966) On the biomass of of soil animals found in various types of forests in
Thailand. Southeast Asian Studies, 4:133-139.
Watanabe, H., S.Ruayssongnern and H. Takeda (1983) Soil animals. In Kyuma, K. and C. Pairintra (eds.), Shifting Cultivation,
-80-pp.110-126, Ministry of Science, Technology and Energy, Banghkok, Thailand.
Wirawan, N. (1984) Kutai National Park and the great Kalimantan fire. WWF Monthly report June, pp.125-132.