MORPHOTECTONIC ASPECT TO DELINEATE MULTIHAZARD
AREAS BASED ON SPATIAL ANALYSIS
Cipta ENDYANA
1,2,*, Febri HIRNAWAN
1, Dicky MUSLIM
1, Satoshi YAMAOKA
3 1Faculty of Geological Engineering, Universitas Padjadjaran, Indonesia
2
School of Post Graduate, Universitas Padjadjaran, Indonesia
3Faculty of Civil Engineering and Regional Design, Utsunomiya University, Japan *Corresponding Author: [email protected]
Abstract
Indonesia archipelago is a rich country with many natural resources. Energy, oil and gas, groundwater, bioresources, minerals and coal, etc. the highly potential resources present because Indonesia is in volcanic belt with complexity of tectonic. There is not only resource developed in this study area but also mitigation and unstable area as an earthquake, flooding, volcanic eruption, landslide, etc. The West Java which is the one province in western of Java Island has an interested area for research of mitigation. There are several reasons for choosing the Southeastern West Java become study area of multihazard, earthquake, landslide, volcanic eruption, flood, and tsunami.
Keyword: Morphotectonic, Spatial analysis, Multihazard 1. Introduction
Southeastern West Java Province has a unique morphologic aspect of multihazard study. Flood and landslide phenomena were occurred at October 2017 is an evidence that southeastern West Java, highly potential area for multihazard. Therefore, research in this area is required to delineate mitigation that occurs in several areas. Flood, landslide, even tsunami happened in southeastern West Java a year ago. Delineation of flood, landslide, and tsunami at study area uses spatial analysis with morphotectonic aspect. Relief shading methode, slope analysis, and flood simulation are used to delineate the area.
Digital Elevation Model (DEM) is primary data to be analysis with several methods that mention before. Aster GDEM with 30m x 30m resolution of Satellite Image has been chosen as a primary data for morphotectonic analysis. This morphotectonic aspect has been processed with geographic information system software-QGIS and spatial method in studio. A sample of lithology and measurement of strike/dip has been taken as a validation.
2. Geological Setting
The study area physiographically belongs to Southern West Java Mountainous Zone. In Southern West Java Mountainous Zone, there is a geanticline Java that compressed sustainly and become flat at southern side until Indian Ocean. This even makes a unique geological setting in shape of mountain and folding hill form and faulted with steep slope elevation. [1]
The geological setting occur old lithological formation from Oligocene to Miocene, and Holocene. Sedimentary, Igneous, and Metamorphic rocks are widely found + 50 km in this Southern West Java Mountainous Zone, from Ciletuh area in west side of this zone until Nusakambangan Island at east side of zone. Morphology in this zone influence by peneplain cause of rifting and tilting developed along this
area. Based on Geological Map of Pangandaran, the physiography of study area and its surrounding is divided into two morphological units, that is hill and plain units. Hills units have general characteristic of landform as area with sloping slope and blunt hills. Top of the hill has an elevation between 100m until 600m above mean sea level. The highest elevation found at Pasir Ciputat with its elevation 273m masl. This unit spread out at western, northwestern, and northeastern part of unit area. Lithological setting is clastic sedimentary rocks and old volcanic rock, Oligocene until Miocene epoch. Plain Unit formed by sedimentation with broken material, especially fine sand material. This unit spread out at southern part along south coastal area. (Figure 1)[1][2][8][9][10]
Figure 1. Regional geological map of Pangandaran and its surrounding.
3. Method
Relief shading method used to present Digital Elevation Model texture. DEM texture usually shows the lineament of slope and drainage pattern. This method also present shapes that appear in DEM with relief processed to enhance information of geospatial. The enhancement provides 3D view of overlaying data such as lithological data, flood plain, morphological data. The lineament, watershade and drainage pattern in study area become easier to analysis and determination of morphotectonic aspect [3][11].
Frequency Domain Decomposition (FDD) Method used for calculating fracture intensity and density, and delineation of fracture pattern also. Basic data is lineament that provide from lineament extraction of relief shading with difference sun shading. The result of FDD analysis is a distribution of fracture intensity at study area and its surrounding. Furthermore, fracture pattern will present major domain of tectonic stress or volcanic stress. Fracture appears at its DEM has a pattern that can describe stress analysis at study area. [4]. Further step of analysis use slope aspect method that used for provide values of slope degree. This slope value with degree or percentage of tilting slope and will be classified to morphometric unit. [5][6]
Final step of processing morphotectonic aspect with spatial analysis is compilations of several parameters that have been built before. Every parameter has a layer that can be overlaid by Geographic Information System software, in this case used Quantum-GIS. Each parameter that has been built are
hillshade map, slope aspect map, lineament map, FDD map, lithological map, and outcrop distribution map. [7][12]
4. Result and Discussion
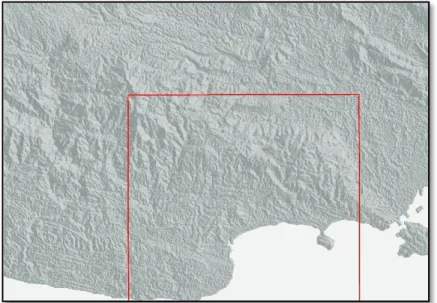
Relief shading (Figure 2) is the image processing method to make easier analysis the lineament and drainage pattern. The other function of relief shading is to show the elevation anomaly between slopes and valley. Relief shading derived from DEM processing using gis applications. Slope aspects is a data derived from dem data processing using slope values so it can classify the lineament of the same value slopes. (Figure 3)
Frequency domain decomposition (FDD) yields the density of lineament at pangandaran region show the areas with the biggest stress affected. After all data is populated. The overlaying all data as a next step of processing present an advance result as more specific information from the structure distribution in study area. (Figure 4)
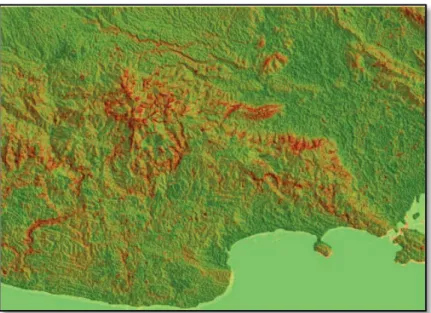
Figure 3. Slope aspect analysis in study area.
Lithology of Pangandaran area consists of sandstone, limestone, coral reef, carbonate sandstone, breccia, volcanic breccia, igneous rocks, and tuff. domination of lithology at study area is volcanic breccia and limestone. Critical area is used to determine the deliniation of the geological hazzard, in this case is used for determine the landslides area (Figure 5) and floodplain area (Figure 6). The floodplain area is at south and east of the research area, and analyzing the lithology, geological structure, and slopes to determine the landslides area.
Figure 4. Frequency Domain Decomposition of study area.
5. Conclusion
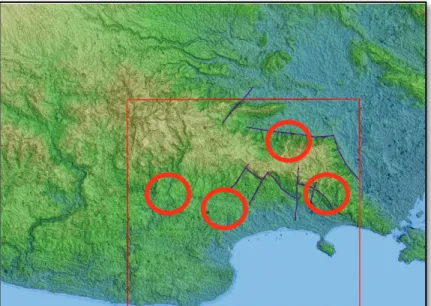
Final analysis is to delineate the potential hazzard of the study area. First, critical areas of landslide hazard in study area were located as indicated by red circle and blue lines (Figure 5). That critical location indicate with highly slope value and extreme elevation, then that critical location provide
fault with dip-slip mechanism and strike-slip mechanism. The location is distributed at the middle part of study area.
Second, critical areas of floodplain hazard were locate along coastal line and spread out at eastern part of study area. Critical area of floodplain as a result of sea level increase simulation with 5m to 30 m with deep basin analysis that taken from DEM processing before. The result shows that critical area with brown area is first prioriy to avoid when sea level increase, green area is second priority, and blue area is third priority.
This research required the further research to be developed and need to add analyzing of the watershade determination, stress direction and climate or rainfall analysis. For further research these parameter will be included to be a parameters of multihazard delineation.
Figure 5. Critical landslide area describe with blue lines and red circle in study area.
6. Acknowledgement
The image processing were performed with workstation computer processing in Faculty of Geological Engineering and School of Post Graduate, University Padjadjaran.
This Research as a part of Academic Leadership Grant (ALG) Research under Prof. Dr. Ir. H. Febri Hirnawan, M.Sc and was Financed by Universitas Padjadjaran.
References
[1] Van Bemmelen, R.W. 1949. The Geology of Indonesia, Volume 1.A, The Hague Martinus Nijhoff, Netherland
[2] Simandjuntak, T.O and Surono. 1992. Geological map of Pangandaran sheet, Java. Geology research center and development, Energy and Mining Department. Bandung
[3] Soendjojo, Hadwi; Akhmad Riqqi. 2012. Cartography (translate). ITB Bandung
[4] Cipta Endyana, Hendarmawan, Emi Sukiyah, Irwan Ari Dharmawan. 2016. Controlling Groudwater System by Pattern Fracture Approach in Subsurface Volcanic Deposit: Mt.Salak- Mt.Pangranggo, West Java, Indonesia, IOP Conf. Series: Earth and Environmental Science
[5] Van Zuidam. 1985. Guide to Geomorphology Aerial Photographic Interpretation and Mapping. International Institute for Aerial Survey and Earth Sience (ITC), Enschede, The Netherland
[6] Cipta Endyana, Hendarmawan, Emi Sukiyah, Irwan Ari Dharmawan, Faisal Helmi, 2014. Fracture Pattern Controlled Groundwater Flow In Volcanic System Case Study in Ciherang, West Java, Indonesia, The International Seminar on Chemistry (ISC) of Universitas Padjadjaran, Indonesia [7] Bonham-Carter G.F. 1994. Geographic Information System for Geoscientists, Modelling with GIS.
Pergamon. Oxford
[8] Budhitrisna. 1986. Geological map of Tasikmalaya sheet, Java. Geology research center and development, Energy and Mining Department. Bandung
[9] Kastowo dan Suwarna. 1996. Geological map of Majenang sheet, Java. Geology research center and development, Energy and Mining Department. Bandung
[10] Supriatna, et al. 1992. Geological map of Karangnunggal sheet, Java. Geology research center and development, Mining and energy development. Bandung
[11] Sabins, F.F. 1987. Remote Sensing : Principles and Interpretation. Freeman and Company. New York
[12] Sadahiro, Yukio. 2006. Course #716-26 Advanced Urban Analysis E. Lecture Title: - Spatial Analysis using GIS – Associate professor of the Department of Urban. Engineering Department of Tokyo University. Japan