A Preliminary Study on Automatic Detection of Distraction from
Driving Behavior using Driving Simulator
Basabi Chakraborty
1, Yusuke Manabe
2, Sho Yoshida
3and Kotaro Nakano
31
Faculty of Software and Information Science, Iwate Prefectural University
2
Faculty of Information and Computer Science, Chiba Institute of Technology
3
Graduate School of Software and Information Science, Iwate Prefectural University
Abstract: In this work, a preliminary study for automatic detection of driver's distraction due to cognitive
load has been done by analyzing driving data from driving simulator. The simulation experiments are done with 4 drivers and three type of driving situation (normal driving and driving with various types of cognitive loads). From the analysis of time series data obtained from sensors in a driving simulator, it has been noticed that driving behavior changes with statistical significance for varying cognitive tasks. The feature of the driving simulator data that changes most with increasing cognitive load has been assessed and the classification accuracy for driving with and without cognitive load by a simple classifier came out on the average as 66.3%
1. Introduction
Driver distraction due to secondary activities while driving, is considered to be one of the main reason of road accidents [1]. Automatic detection of distraction and issuance of alert can help driver to adhere to safe driving. Many researches [2] are going on to model driving behavior and automatic detection of driver's distraction, yet to come up with a successful commercial application. It is known that driving behavior is affected by fatigue, visual and cognitive distraction and can be modelled from the data obtained by physical, physiological or environmental sensors. The effective method of automatic detection of driver’s distraction or the effective combination of the sensors are now the objectives of research.
Generally two major types of distractions are visual distraction and cognitive distraction. Visual distraction happens when the driver looks away from the road described as “eye-off-road”, cognitive distraction occurs when the driver's mind is busy with something not directly related with driving known as “mind-off-road”. Visual distraction can be automatically detected by tracking the driver’s eye movement. A general algorithm that considers driver glance behavior across a relatively short period could detect visual distraction consistently across drivers. Some research works in this
direction are presented in [3]. However, detecting cognitive distraction is much more complex as the signs of cognitive distraction are usually not straight forward and can vary across drivers. Moreover the driving behavior does not have a simple linear relationship with cognitive distraction. Some studies on cognitive distraction can be found in [4].
In this work, we restrict our study to the effect of cognitive distraction on driving behavior of the driver and how it can be detected from the sensors available with the driving simulator. It is known from various studies [5] that the driving behavior changes when the driver is exposed to cognitive demand of the secondary task. The change of driving behavior may depend on individual or there might be some common trend. In this study, experiments are done with a driving simulator in different scenarios and drivers are asked to drive 1) with attention without any secondary task 2) with various secondary tasks. The sensors' data from driving simulator are collected and analyzed. Statistical tests are done to check whether there is any significant difference between the driving behavior with and without secondary cognitive tasks and what feature or which sensor data indicates the most difference during driving with attention and driving with distraction.
人工知能学会研究会資料 SIG-FPAI-B502-07
The next section presents some related works followed by the section describing experimental studies and results. The final section presents summarization and conclusion.
2. Related Works and Background
The area of modelling driving behavior is gaining an increasing attention in the research of safety driving. Some studies considered driving simulators [6] and some others used real cars equipped with various sensors [7]. The main objective is to automatically assess the distraction level of the driver that have considerable effect on driving performance.
Frontal cameras can be useful to assess the visual distraction level of the driver. Relevant visual features include head pose, gaze and eyelid movements. In [8], an approach to monitor visual distractions using a low cost camera is presented. Measuring cognitive distraction from cameras or any nonintrusive sensors is difficult as many parameters need to be integrated for detecting cognitive distraction. In [9] [10] Support Vector Machines (SVM) and Dynamic Bayesian Networks (DBN) are used respectively for detecting cognitive distraction from driver visual behavior and driving performance.
Car information also provide valuable information about the driver behavior. In [6] driver behavior is predicted from pedal position. In [11], driver attention level is calculated from steering wheel, vehicle speed and lateral position of the car. There are some other research works [12] in which car component features like wheel angle, gas pedal or brake pressure are used for assessing driver behavior.
Studies have also done considering physiological signals to assess cognitive load, attention and fatigue.
EEG and bio signals are also used in some researches for detecting drowsiness and sloppy driving behavior.
But for measuring physiological signals one needs to use intrusive sensors which are not convenient for real life situation.
3. Experimental Study
In this study, we have used driving simulator
D3sim (三菱プレシジョン). The driving behavior is
assessed from the simulator output which contains time series data (steering angle, steering torque, accelerator stroke, brake stroke, car speed, car angle, engine speed etc). We have used various scenarios for driving and collected simulator output. The experimental study in detail is as follows
1. 4 subjects have been used for this study. All of them are students in the age group 20-22 yrs. 2. For each subject, driving data for three
situations have been collected: a) normal driving with attention b) driving while continuing conversation with co passenger c) driving while doing mental arithmetic at the elementary school level
3. For each situations, different driving scenarios are used from simple route, route having curves and sharp bending, to routes with multiple diversions
4. All subjects are initially allowed to practice for a while in different routes. Each subject is then asked to drive in the designated routes (from simple to complex) consecutively and repeat driving for several times.
5. The time series output data from the driving simulator for steering wheel angle, steering torque, accelerator torque, brake stroke, car speed and engine speed are recorded
6. Statistical analysis have been done for finding out the best parameter for distinguishing driving behavior difference for attentive driving and distracted driving
7. Nearest neighbor classifier and Support Vector machine classifier are used to classify driving with cognitive load and without cognitive load.
4. Analysis and Results
In this study we selected 80 driving samples (for every person normal driving 11 times, driving with conversation 4 times and driving with mental arithmetic 5 times) for analysis. The drivers were asked to drive following a car speeding 60 km per hour with a more or less constant separation.
The route scenario used are as follows: 1) Mountain roads
2) Only curve roads without left/right turn 3) Roads with ups and down
route and repeat the course for 5 times.
The parameters used from each time series data are maximum value 𝛼𝑘, variance 𝜎𝑘2 and average value
𝜇𝑘. 𝛼𝑘= max1≤𝑡≤𝑁 𝑘{|𝑦𝑘(𝑡)|} 𝜎𝑘2= 1 𝑁𝑘∑(|𝑦𝑘(𝑡)| − 𝜇𝑘) 2 𝑁𝑘 𝑡=1 𝜇𝑘= 1 𝑁𝑘∑ |𝑦𝑘(𝑡) 𝑁𝑘 𝑡=1 |
𝑦𝑘(𝑡) ,𝑘(= 1,2, … ,6) is the time series data for kth
series, k representing each of the 6 time series data collected from driving simulator. 𝑁𝑘, thenumber of
time intervals from beginning to end of the driving.
Fig 1 Data for normal driving
Fig 2:Driving with conversation
Fig 3:Driving with mental arithmetic
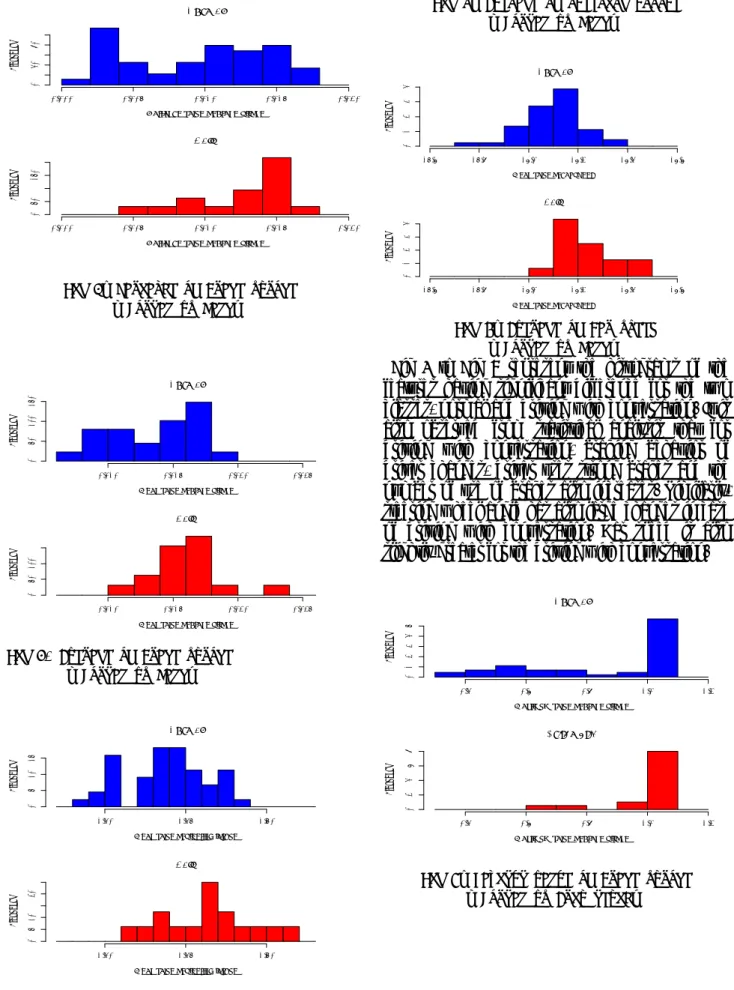
Now for every feature and for every series, statistical significance is tested for confirming significant difference between normal and distracted driving. 1NN classifier and SVM with RBF kernel is used to classify the data of driving. Fig1, Fig2 and Fig 3 represent the time series data from driving simulator for normal driving, driving with various cognitive tasks. It can be found from visual inspection of the data that steering angle and steering torque show difference in case of driving with or without cognitive load. Moreover it is found that the difference is larger for driving with conversation.
Fig 4:Maximum value of Brake stroke (Normal vs Talk)
Normal
Maximum value of brake stroke
Fr eq ue ncy 0.4 0.6 0.8 1.0 1.2 0 1 2 3 4 5 Talk
Maximum value of brake stroke
Fr eq ue ncy 0.4 0.6 0.8 1.0 1.2 0 2 4 6
Fig 5:Variance of Brake stroke (Normal vs Talk)
Fig 6. Average of Brake stroke (Normal vs Talk)
Fig 7:Average of steering torque (Normal vs Talk)
Fig 8:Average of Car speed (Normal vs Talk)
Fig 4 to Fig 8 represent the histograms of the features having significant difference for the two classes, normal and driving with conversation. It is also observed from statistical analysis that for driving with conversation, braking behavior of driver changes, driver uses strong brakes and the number of use of brakes also increases. Similarly, steering wheel angle has also large changes in case of driving with conversation. Car speed is also slightly greater for the driving with conversation.
Fig 9:Maximum value of Brake stroke (Normal vs Arithmetic) Normal
Variance value of brake stroke
Fr eq ue ncy 0.000 0.005 0.010 0.015 0.020 0 40 80 Talk
Variance value of brake stroke
Fr eq ue ncy 0.000 0.005 0.010 0.015 0.020 0 50 150 Normal
Mean value of brake stroke
Fr eq ue ncy 0.010 0.015 0.020 0.025 0 50 100 150 Talk
Mean value of brake stroke
Fr eq ue ncy 0.010 0.015 0.020 0.025 0 50 100 Normal
Mean value of steering torque
Fr eq ue ncy 1.40 1.45 1.50 0 5 10 15 Talk
Mean value of steering torque
Fr eq ue ncy 1.40 1.45 1.50 0 5 10 20 Normal
Mean value of car speed
Fr eq ue ncy 15.6 15.8 16.0 16.2 16.4 16.6 0 1 2 3 4 Talk
Mean value of car speed
Fr eq ue ncy 15.6 15.8 16.0 16.2 16.4 16.6 0 1 2 3 4 Normal
Maximum value of brake stroke
Fr eq ue ncy 0.4 0.6 0.8 1.0 1.2 0 1 2 3 4 5 Arithmetic
Maximum value of brake stroke
Fr eq ue ncy 0.4 0.6 0.8 1.0 1.2 0 2 4 6 8
Fig 10:Variance of Brake stroke (Normal vs Arithmetic)
Fig 9 to Fig 11 represent the histograms of features having significant difference for two classes normal and driving with mental arithmetic. It seems that brake stroke is the most important feature for distinguishing the two classes.
Fig 11:Average of Brake stroke (Normal vs Arithmetic)
Using the best features from the statistical analysis SVM is used to classify two classes of driving. Table 1 represents the results for the best values obtained.
Table 1 Classification results with SVM
Predicted Normal With cognitive load True Normal 68.2% 31.8% With cognitive load 36.1% 63.9%
We have tried nearest neighbor classifier (1nn) also but we could achieve the average result of classification as 59%.
5. Conclusion and Discussion
In this work a very simple study has been done in order to detect distracted driving automatically from the driving behavior. The study has been done using driving simulator and the driving behavior is assessed from the collected data from in-built non- intrusive sensors of the simulators. It has been observed that there is significant difference in terms of statistical test in driving behavior for attentive driving and distracted driving. From the analysis of the collected data it has been found that the braking behavior of the driver is the best common factor classifying normal and driving with cognitive loads. The steering angle also is influenced by driving with cognitive load. The classification result is not very good but as a simple study it is promising for further investigation.
For future study, we need to integrate other factors influencing cognitive distraction and also use some other sensors to detect cognitive distraction for more concrete results and increased classification accuracy for normal and distracted driving.
参考文献
[1] D. Ascone, T. Lindsay and C. Varghese, ``Traffic Safety factor: An Examination of Driver Distraction as Recorded in NHTSA Databases'', National Highway Traffic Safety Administration's National Center for Statistical Analysis, 2009.
[2] L. Jin, Q. Niu, H. Hou, et.al.,“Driver Cognitive Distraction Detection Using Driving Performance Measures, Discrete Dynamics in Nature and Society, Vol.2012, article ID 432634. 12 pages, 2012.
Normal
Variance value of brake stroke
Fr eq ue ncy 0.000 0.005 0.010 0.015 0.020 0 40 80 Arithmetic
Variance value of brake stroke
Fr eq ue ncy 0.000 0.005 0.010 0.015 0.020 0 50 150 250 Normal
Mean value of brake stroke
Fr eq ue ncy 0.010 0.015 0.020 0 50 100 150 Arithmetic
Mean value of brake stroke
Fr eq ue ncy 0.010 0.015 0.020 0 50 150
[3] Y. Liang, J. D. Lee and L. Yekhshatyan, “How dangerous is looking away from the road? Algorithms predict crash risk from glance patterns in naturalistic driving”, Human Factors, Vol. 54, No. 6, pp. 1104-1116, 2012.
[4] Y. Liang and J. D. Lee, “A hybrid Bayesian Network approach to detect driver cognitive distraction”, Transportation Research Part C, Vol. 38, pp. 146-155, 2014.
[5] N. Li, J. Jain and C. Busso,”Modeling of Driver Behavior in Real World Scenarios using Multiple Noninvasive Sensors”, IEEE Trans. On Multimedia, Vol15, No.5, pp. 1223-1225, 2013. [6] T. Ershal, H. Fuller et.al, ”Model based analysis
and classification of driver distraction under secondary tasks”, IEEE Trans. on Intelligent Transport Systems, Vol.11, No.3, pp.692-701,2010.
[7] M. Kutila, et.al, “Driver distraction detection with a camera vision system”, IEEE International Conference on Image Processing ICIP 2007, Vol.6, pp. 201-204, 2007.
[8] M. Su, C. Hsuing and D. Huang, “A simple approach to implementing a system for monitoring driver inattention”, IEEE International Conference on Systems, Man and Cybernetics
[9] Y. Liang et.al,”Non-intrusive detection of driver cognitive distraction in real time using Bayesian networks”, Transportation Research Record: Journal of the Transportation Research Board (TRR) Vol. 2018, pp.1-8, 2007
[10] Y. Liang et.al, “Real-time detection of driver cognitive distraction using Support Vector Machines”, IEEE Transactions on Intelligent Transportation Systems, Vol 8, No.2, pp. 340-350, 2007.
[11] F. Tango and M. Botta,” Evaluation of distraction in a driver-vehicle environment framework: An application of different data-mining techniques”, Advances in Data mining: Applications and Theoretical Aspects, Lecture Notes in Computer Science, Vol 5633, pp. 176-190, 2009.
[12] P. Angkititrakul et. al, “Getting start with UTDrive: Driver behavior modelling and assessment of distraction for in-vehicle speech system” Interspeech 2007, pp. 1334-1337, 2007.