第 54 卷 第 4 期
2019 年 8 月
JOURNAL OF SOUTHWEST JIAOTONG UNIVERSITY
Vol.54 No.4 Aug. 2019
ISSN -0258-2724 DOI:10.35741/issn.0258-2724.54.4.21
Research article
Computer and Information Science
T
EXT
L
ANGUAGE
I
DENTIFICATION
U
SING
L
ETTERS
(F
REQUENCY
,
S
ELF
-
INFORMATION
,
AND
E
NTROPY
)
A
NALYSIS FOR
E
NGLISH
,
F
RENCH
,
AND
G
ERMAN
L
ANGUAGES
Rasha Hassan Abbas1, Firas Abdul Elah Abdul Kareem2 1Computer Technology Engineering Department,
Al-Mansour University College, Iraq
2 Computer Technology Engineering Dept., Al-Mansour University College, Iraq
rasha.abbas@muc.edu.iq
Abstract
People illustrate the world, convey stories, share ideas, and interconnect in over 6900 languages. Information on the Internet may appear unlimited. All over history, electrical and computer experts have built tools such as telephone, telegraph and internet router, which have helped people communicate. Computer software that can translate between languages stands for one of such tools. The first step of translating a text is to categorize its language. In this research, self-identification program of text language was designed and tested depending on text letters (frequency, self-information, and entropy of certain chosen letters) for the English, French and German languages. The research, trying to detect the original language, is successful of detecting these languages, after applied to randomly selected text files. The detection program was written using C++ programming language.
Keywords: Text identification, word frequency, entropy, C++ programming language
摘要 : 人们用超过 6900 种语言来说明世界,传达故事,分享想法和互连。 互联网上的信息可能无限制。 历史悠久,电气和计算机专家已经建立了诸如电话,电报和互联网路由器之类的工具,这些工具帮助人们 进行交流。 可以在语言之间进行翻译的计算机软件代表了这样的工具之一。 翻译文本的第一步是对其语言 进行分类。 在这项研究中,文本语言的自我识别程序是根据英语,法语和德语的文本字母(频率,自我信 息和某些选定字母的熵)设计和测试的。 在应用于随机选择的文本文件之后,试图检测原始语言的研究成 功地检测到这些语言。 检测程序是使用 C ++编程语言编写的。 关键词: 文本识别,词频,熵,C ++编程语言
I. I
NTRODUCTIONThe knowledge of employing computers to translate text was firstly proposed in a letter from Warren Weaver to Norbert Wiener in March 1947 once computers had been still in their initial
stages. Warren Weaver is best identified for coauthoring, along with Claude Shannon, the book The Mathematical Theory of Communication and for translating Alice in Wonderland into numerous languages. Norbert
cybernetics and for his work on filtering [1], [2]. In the letter, Weaver highlights the position of aiding communication [1]. A most thoughtful problem for UNESCO and for the positive and peaceable future of the planet is the difficulty of translation, as it inescapably touches the communication between peoples [3]. In 1949, Weaver wrote a memorandum defining his ideas on computer translation and presenting the theme to a widespread audience [1], [2]. His memorandum starts with the words: “There is no
need to do more than mention the obvious fact that a multiplicity of languages impedes cultural interchange between the peoples of the earth, and
is a serious deterrent to international
understanding” [3]. Enhancing communication is
still a huge importance for the world community nowadays
Recently, speedy development in global communication has led to the need for systems capable of appropriately classifying languages of documents. Moreover, with the extent of the worldwide Internet access, a text is obtainable in a countless number of languages other than English. Automatic processing of these texts for objectives of web crawling, reading aids, and indexing require an initial identification of the language used. Similarly, any system including dictionary access should classify language before employing language-specific operations [4]. Language identification stands for the task of automatically identifying the language(s) in a document according to its content [5]. Consequently, the present difficulties of translation and language identification are closely connected for the reason that both aid communication and their solutions necessitate comparable skills.
Accordingly, this paper represents an investigation to detect the original language and measure the successful level of detecting these languages after applied to randomly selected text files. The detection program was written using C++ programming language.
II. HISTORY AND THEORY
Information theory came into a perplexing and chaotic world. Communication engineers had a problem, but no one had efficaciously put into words the problem or presented a measure of the product with which communication engineers usually deal. There were, on the one hand, stimulating and advantageous special cases. On the other hand, inadequate trials to arrange for a typical theory would effectively take account of and clarify such special cases [6].
In 1948, Claude Shannon disseminated a paper titled A Mathematical Theory of Communication that depicted a typical principle
for measuring the transmission of information from a sender, through a noisy channel, to a receiver. This theory became known as information theory [7]. Shannon described information as a quantitative measure of communication exchanges.
This theory analyzes information based on the probabilities of the existence of signs in their respective contexts. It is eventually derived from Claude Shannon and Warren Weaver‟s theory of communication [8].
This section presents several basic principles of information theory in addition to the definitions and notations of probabilities that will be used throughout the research.
A. Probability (Relative Frequency):
The theory of probability is an essential mathematical tool in the design of digital communication systems. This subject is important in the statistical modeling of sources that generate information [9].
The probability mathematics is based on things that occur at random, or randomly. Whenever you throw a coin in the air, you cannot forecast steadfastly whether it will fall „heads‟ or „tails‟. Most things in the world have some random aspects in them, that is why it is so tricky to forecast the future precisely [10].
An experiment stands for a random experiment in the case of its outcome cannot be forecast. Representative instances of a random experiment are all roll of die, the toss of a coin drawing a card from a deck, or choosing a message signal for transmission from numerous messages. The sample space S of the experiment have the set of each potential outcome. An element in S represents a sample point. In this case of the die [9]:
S= {1, 2, 3, 4, 5, 6},
where the integers 1 through 6 stand for the number of dots on the six faces of the die. These potential outcomes represent the sample points of the experiment. An event is a subset of S which can involve any number of sample points [9]. Tossing a coin is such an experiment, the possible outcomes being heads and tails. If the experiment is repeated N times, suppose that the outcome A will occur NA times. The relative frequency of occurrence of A is NA/N. This ratio is not very predictable when N is small. If experiment has statistical regularity, however, the
relative frequency of a particular outcome may approach a limit as the number of repetitions N becomes very large. This limiting value of the relative frequency of occurrence is called the probability of the outcome A and is written as P(A) [11]:
P A = lim N→∞
NA
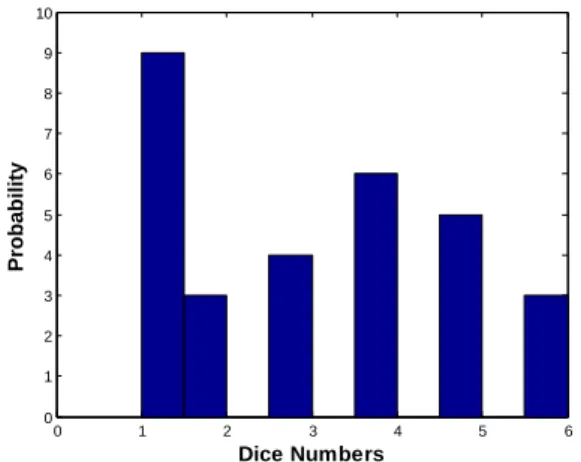
N … … … (1) The probability of an event represents a theoretic idea that is advantageous when there are a number of equally likely outcomes. While the relative frequency of an event is an applied idea, it refers to what fraction of the time an event truly happened. In the long run, the relative frequency of an event will be almost the (theoretical) probability [10]. The probability of an event stands for the limitation of its relative frequency in the long run [12]. For example, if we throw the dice 30 times at random, we get the probability that each number will appear in the dice as shown in Figure (1).
Figure 1. The column chart of the probability of dice numbers when it is thrown 30 times randomly. In the area of letter-frequencies, as the patterns of letters in language do not occur at random, letter frequencies can be signified in several rules and the pattern of letter frequencies can aid in discernment of random text from that of the natural language text [13].
The frequency of letters in a text has frequently been considered for cryptography and frequency investigation. Recent International Morse code encodes the most frequent letters with the direct symbols and a comparable idea has been used in modern data-compression systems. Linotype machines are as well in accordance with letter frequencies of the English language texts. No precise letter frequency distribution underlies a specified language as each writer writes to some extent differently. Latest analyses indicate that letter frequencies, such as word frequencies, have a tendency to
differ, by subject and writer. One cannot write an essay about x-rays with not employing frequent Xs, and the essay will have a particularly extraordinary letter frequency if the essay is concerning the frequent use of x-rays to treat zebras in Qatar. Diverse authors have habits that can be reflected in their use of letters. Bigram, trigram, letter, word frequencies, word length, and sentence length can be analyzed for particular authors, and used to prove or disprove writing of texts, even for authors whose styles are not highly different [13].
B. Self-Information in Information Theory
Within the background of information theory, self-information can be explained as the quantity of information that knowledge regarding the outcome of a certain event, adds to someone‟s general familiarity. The amount of self-information is stated in the unit of self-information: a bit. By default, the quantity of self-information in a probabilistic event relies upon only on the probability P of that event. More exactly; the smaller probability stands for larger self-information related with receiving self-information that the event certainly happened [14].
Additionally, by definition, the measure of self-information has the following features. If an event C has jointly autonomous events A and B, then the amount of information at the announcement that C has occurred, matches the sum of the amounts of information at announcement of event A and event B, correspondingly. Based on these properties, the self-information 𝐼 𝑥𝑖 (measured in bits which is the expected information) is related with outcome 𝑥𝑖 whose outcome has probability defined by [14]:
𝐼 𝑥𝑖 = 𝑙𝑜𝑔2 1 𝑃(𝑥𝑖)
= −𝑙𝑜𝑔2 𝑃 𝑥𝑖 … (2) This means that information contents for an event 𝑥𝑖 also decrease as 𝑃(𝑥𝑖) increases and no information exists as 𝑃 𝑥𝑖 reaches one [14].
The average self-information of a random variable x is called the Entropy [15, 16].
C. Shannon Entropy
The notion of information is too broad to be captured entirely by a single definition. Nevertheless, for any probability distribution, we describe a quantity termed as entropy that has numerous properties go along with the instinctive concept of what a measure of information should be [17].
The elementary idea of entropy in information theory has to do with how much arbitrariness
0 1 2 3 4 5 6 0 1 2 3 4 5 6 7 8 9 10 Dice Numbers Probability
there is in a signal or random event. A substitute way to observe at this is to talk about how much information there is in a signal. The entropy formula states the expected information content or uncertainty of probability distribution [18]. There are various entropy explanations and they are not correspondingly valuable for all applications, while Shannon entropy is the most famous (and most liberal) [19].
Shannon defined a measure of entropy (H). As applied to an information source, this could regulate the smallest channel capacity required to reliably convey the source information as encoded binary digits. Shannon‟s formula is feasibly derived by computing the expectancy of the quantity of information restricted in a digit from the information source [20].
The entropy of a random variable x represents the weighted sum (or average) of the self-information of each message 𝑥𝑖 from the sources [15], [16]: H x = P xi ∙ n i=1 I xi = P xi ∙ n i=1 log2 1 P(xi) …(3)
We are capable of evaluating the information content not just of messages or strings of messages, but of entire languages. As a result, we take a weighted average of all potential messages. Here 𝐻 𝑥 is used to characterize the entropy of the language and 𝑃 𝑥𝑖 specifies the probability of the ith letter and the sum extends over all letters of the language. This lets us capture structure in the language that takes place over two or more characters, such as Q usually being followed by U, and rules like “I before E, except after C.” As n grows, Hn becomes a better
estimate of H [21].
We observe that 0 ≤ 𝑃 𝑥𝑖 ≤ 1, 1
𝑃(𝑥) ≥ 0. Hence, 𝐻 𝑥 ≥ 0.
Shannon provides dual approaches of approximating the entropy of English [22]. The redundancy or number of constraints imposed on the text of the English language, results in a reduction in its complete entropy. Shannon approximated the entropy of written English to be between 0.6 and 1.3 bits for each character (bpc) over 100-letter long sequences of English text, based on the capability of human subjects to envisage the next character in a body of text [22].
III. M
ETHOD ANDR
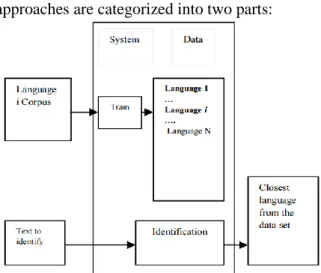
ESULTSThe general architecture of a language identifier (according to strategy used in this
research) is shown in Figure 2. Statistical frequency analysis for language identification approaches are categorized into two parts:
Figure 2. The general architecture of a language identifier. In the training part, the feature extraction from the specified training data set identified as corpus is done. This is a pre-processing stage of an unknown text goal file. The reference data that will be used for taking detection of language decision will be calculated and stored as reference limits between maximum and minimum thresholds. This is the most sensitive part that affects the detection result.
In the classification part, the similarity measure concerning the training profile and the testing profile is concluded and the most similar language is known as the language of the document.
The next sub-sections are dedicated to cover the steps of the research work
A. Reading the Text from a File
Languages detection requires large text to test the program and it is impossible to put long text in C++ language that will take some time. Therefore, text is read from a text file by taking all the text in the text file and placing it in the program by typing the link of the text file in the computer, and the program will work directly with the text.
B. Reading the Letters from A to Z within the Text
The interpretation of the mean score value of the study‟s variables are presented in Table 3, which indicates the respondents‟ level of agreement (i.e.,their perception) regarding the variables of the study. The table and the interpretation are adopted from [37].
C. Finding Text Size in Letters
In this part of the research, we calculated the total number of letters in the English, French and German texts which use this result to find the probability and the frequency of letters. We approximately used equal number of text letters for these three languages. The total number of letters per text for the English language is 10143 letters, for the French language is 10131 letters, and for the German language is 10127 letters.
D. Finding the Frequency of Each Letter
The relative frequencies of text letters can be used in automatically identifying the language of the text. Thus, the relative frequencies of letters in English, French and German languages have been relied upon them in this research in the frequency analysis of the letters to distinguish between the three languages as shown in Table 1.
Table 1
Relative frequencies of letters in English, French and German languages
Letters
English French German Relative Frequency Relative Frequency Relative Frequency a 8.34 % 8.13 % 5.58 % b 1.54 % 0.93 % 1.96 % c 2.73 % 3.15 % 3.16 % d 4.14 % 3.55 % 4.98 % e 12.60 % 15.10 % 16.93 % f 2.03 % 0.96 % 1.49 % g 1.92 % 0.97 % 3.02 % h 6.11 % 1.08 % 4.98 % i 6.71 % 6.94 % 8.02 % j 0.23 % 0.71 % 0.24 % k 0.87 % 0.16 % 1.32 % l 4.24 % 5.68 % 3.60 % m 2.53 % 3.23 % 2.55 % n 6.80 % 6.42 % 10.53 % o 7.70 % 5.27 % 2.24 % p 1.66 % 3.03 % 0.67 % q 0.09 % 0.89 % 0.02 % r 5.68 % 6.43 % 6.89 % s 6.11 % 7.91 % 6.42 % t 9.37 % 7.11 % 5.79 % u 2.85 % 6.05 % 3.83 % v 1.06 % 1.83 % 0.84 % w 2.34 % 0.04 % 1.78 % x 0.20 % 0.42 % 0.05 % y 2.04 % 0.19 % 0.05 % z 0.06 % 0.21 % 1.21 % By calculating the number of each letter occurring in the text, we can use the difference between the frequencies of letters to detect the language. A program, created with C++ programming language, was used to detect three languages and these languages are English, French, and German. The program calculates the frequency of each letter in the text for each
language. There is a difference in the frequency of each letter between the three languages as shown in Table 2. Thus, there is a different fingerprint for each language, where each language contains special frequencies of letters that differ from another language as shown in the column chart in Figure 3. Thus, we can distinguish between these languages by detecting the frequency of letters.
Table 2.
The frequency of the letters (from a to z) within the entered text files for the English, French and German languages.
Letters English French German Frequency Frequency Frequency
a 845 790 483 b 145 155 183 c 348 376 307 d 358 436 403 e 1441 1544 1838 f 178 128 124 g 269 103 393 h 430 80 496 i 680 822 930 j 6 50 21 k 44 9 153 l 483 627 379 m 270 267 255 n 695 710 1059 o 648 610 245 p 267 375 100 q 12 89 8 r 617 718 728 s 762 758 665 t 964 693 626 u 208 608 284 v 74 88 90 w 186 1 146 x 30 65 5 y 180 23 56 z 3 6 150
According to Table 1, we compare each two adjacent frequencies after arranging the frequencies of each language from the highest to the least. If the comparison condition is satisfactory, we get 1 point and otherwise we get zero point. For example, in the English language (e has the larger frequency as compared to letter
t) and (t has the largest frequency from letter a)
and so on until we get (the letter q has the larger frequency as compared to the letter z). Then, we collect the points of these comparisons for this language to get a score and by comparing this score with the scores of the comparison results for the other languages; thus, we can detect the language of the entered text. We notice that when we enter the text file in the English language the total score for English is 20, making 16 for French and 14 for German. Thus, the text appears
to indicate that the language in the text file is in the English language. And when we enter the text file in the French language, we notice that the total score for English is 14, making 17 for French and 11 for German. Therefore, the text appears to indicate that the language in the text file is in the French language. Finally, when we enter the text file in the German language, we
notice that the total score for English is 14, making 14 for French and 19 for German. Therefore, the text appears to indicate that the language in the text file is in the German language. Thus, we can distinguish the language of the text file.
(a) The English language
(b) The French language
Figure (3): Column chart of the frequency of letters (from a to z) within the entered text files for (a) the English language, (b) the French language, and (c) the German language
E. Finding Self-Information of the Highest Letters
Firstly, we used equation (1) to calculate the probability of each letter within the text files in order to calculate self-information, which is an additional fingerprint to help us detect the language. Table 3 shows the probabilities of English, French, and German letters, and Figure 4 shows the column charts for these probabilities.
Table 3.
The probabilities of the letters (from a to z) within the entered text files for the English, French, and German languages
Let ters
English French German 𝑷 𝒙𝒊 𝑷 𝒙𝒊 𝑷 𝒙𝒊 a 0.0833087 0.0779785 0.0476943 b 0.0142956 0.0152996 0.0180705 c 0.0343094 0.0371138 0.030315 d 0.0352953 0.0430362 0.0397946 e 0.142068 0.152404 0.181495 f 0.017549 0.0126345 0.0122445 g 0.0265208 0.0101668 0.0388071 h 0.0423938 0.00789656 0.048978 i 0.0670413 0.0811371 0.0918337 j 0.000591541 0.00493535 0.00207366 k 0.00433797 0.000888362 0.0151081 l 0.047619 0.0618892 0.0374247 m 0.0266193 0.0263548 0.0251802 n 0.0685202 0.0700819 0.104572 o 0.0638864 0.0602112 0.0241928 p 0.0263236 0.0370151 0.00987459 q 0.00118308 0.00878492 0.000789967 r 0.0608301 0.0708716 0.071887 s 0.0751257 0.0748199 0.065666 t 0.0950409 0.0684039 0.0618149 u 0.0205068 0.0600138 0.0280438 v 0.00729567 0.00868621 0.00888713 w 0.0183378 9.87069e-005 0.0144169 x 0.0029577 0.00641595 0.00049373 y 0.0177462 0.00227026 0.00552977 z 0.00029577 0.000592242 0.0148119
(a) The English language
(c) The German language
Figure 4. Column charts of the probabilities for the letters (from a to z) within the entered text files for (a) the English language, (b) the French language, and (c) the German language.
Using equation (2) we can calculate the subjective self-information of each letter within the text files for the three languages as in Table 4. The self-information of the letters in each language can also help us to detect the language using the highest self-information of the letters because the value of the self-information of the letters varies according to the languages. Figure 5 shows column charts of the self-information of all letters for the three languages. According to Table 4, we compare each two adjacent pieces of self-information after arranging the self-information of all letters of each language from the least to the highest. If the comparison condition is satisfactory, we get 1 point and otherwise we get zero point. For example, in the English language (e has self-information lower than t) and (t has self-information lower than a) and so on. Then, we collect the points of these comparisons for this language to get a score and by comparing this score to the scores of the comparisons in the other languages, we can detect the language of the entered text. The total scores for English, French, and German are the same as the total scores obtained in section above. Thus, we can detect the language of the text file.
Table 4.
The self-information of the letters (from a to z) within the entered text files for the English, French, and German languages
Letters English French German 𝑰 𝒙𝒊 𝑰 𝒙𝒊 𝑰 𝒙𝒊 a 3.58539 3.68078 4.39004 b 6.12829 6.03036 5.79022 c 4.86525 4.7519 5.04382 d 4.82438 4.5383 4.65128 e 2.81534 2.71403 2.462 f 5.83246 6.30649 6.35172 g 5.23673 6.61999 4.68753 h 4.56 6.98456 4.35172 i 3.89881 3.62349 3.44483 j 10.7232 7.66263 8.9136 k 7.84877 10.1366 6.04853 l 4.39232 4.01417 4.73987 m 5.23138 5.24579 5.31157 n 3.86733 3.83481 3.25743 o 3.96835 4.05382 5.36928 p 5.2475 4.75574 6.66206 q 9.72323 6.83076 10.3059 r 4.03907 3.81865 3.79812 s 3.73455 3.74043 3.92871 t 3.39531 3.86978 4.0159 u 5.60776 4.05856 5.15617 v 7.09874 6.84706 6.81407 w 5.76904 13.3065 6.11609 x 8.40131 7.28412 10.984 y 5.81634 8.78293 7.49856 z 11.7232 10.7215 6.0771
(a) The English language
(b) The French language
(c) The German language
Figure 5. Column charts of self-information of all letters within the entered text files for (a) the English language, (b) the French language, and (c) the German language.
F. Finding Partial Entropy for the Languages
We can use the probability of each letter within the text files in order to calculate the Partial Entropy of the language, which is another additional fingerprint which helps detection part or classification part of the program to detect the
language. Thus, if we use Equation (3) and the highest frequencies for five letters (a, e, n, o, and
t) in Table 1, we notice that in Table 5 the Partial
Entropy of the English language is higher than that of the French language, and for the French language it is higher than that of the German
language. Therefore, if the Partial Entropy value is greater than 1.5, the text is identified as an English text, and otherwise if it is ranged from 1.44 to 1.5, the text is identified as a French one, and if it is ranged from 1.3 to 1.43 the text is identified as a German text.
Table 5.
The Partial Entropy of (a, e, n, o, and t) for the English, French, and German languages using Table 1.
Letters
English French German Relative Frequency Relative Frequency Relative Frequency a 8.34 % 8.13 % 5.58 % e 12.60 % 15.10 % 16.93 % n 6.80 % 6.42 % 10.53 % o 7.70 % 5.27 % 2.24 % t 9.37 % 7.11 % 5.79 % 𝑯 𝒙 bits/symbol 1.5440 1.4554 1.3688
By applying these conditions to the text files that we take in this research, the entropy of these five letters in the English text file is 1.53987, making 1.47819 in the French text file and 1.375 in the German text file. These results are identical to the results obtained by the frequency of letters and self-information of the highest letters. While the entropy values of all letters (from a to z) for the English text file, the French text file, and the German text file are 4.12943, 4.03569, and 4.06298, respectively. Thus, we cannot use the Partial Entropy values of all letters because they are convergent. When we applied these conditions to more than one text file for each language, the results were identical by a large acceptable rate. Therefore, we can use it to distinguish between these languages with a small rate of error which depends on the subject of the entered text (i.e. any letter can be repeated more often than the other in text) and the total number of the entered letters (i.e. the longer the length of the text, the lower the error rate).
IV. D
ISCUSSIONAs the program detects the language, it reaches the phase of language identification depending on the text file. The decision of language identification is basically dependent on the following factors:
1. The highest frequency of letter (50%).
2. Self-information that depends on probability (10%).
3. Entropy of the language (40%).
As a result of these factors, the program tells us whether the language is English, or German or French or the program will show “I cannot detect
this language”" if the input text is in another language.
V. C
ONCLUSION ANDS
UGGESTIONSFOR
F
UTUREW
ORKFrom the present research, the following conclusions can be drawn:
The detection of language using self-information analysis is the same as the detection of language using frequency analysis since the self-information of each letter only depends on the probability of that letter and the latter depends on the frequency of that letter when the number of letters in the text is fixed.
If the text file length is lower than the research threshold level for detection of the language, the program cannot distinguish the language.
If the letters in the text are probably equal in terms of Entropy, that means letter frequency is equal and, consequently, the text may be classified as flat frequency distribution text. This may happen for ciphered text files.
The language fingerprint is largely reflected on letters frequency and Partial Entropy.
Each language has a group of maximum frequency letters.
Each language letter frequency has a great effect on the letter self-information in the lower and higher frequency letters.
The training part of this research must be treated carefully, before reference data are generated and stored.
To increase research program capabilities for other world languages training parts must be trained and reference data must be stored for these.
R
EFERENCES[1] HUTCHINS, W.J. (2000) Early Years in
Machine Translation: Memoirs and biographies of pioneers. John Benjamins
Publishing Co.
[2] HUTCHINS, J. (1997) First Steps in
Mechanical Translation, pp. 14-23,
https://pdfs.semanticscholar.org/8241/607f07c a47751bf89e5f173158999d07f8a6.pdf
[3] NIRENBURG, S., SOMERS, H., and WILKS, Y. (2003) Readings in Machine Translation. Massachusetts Institute of Technology. [4] SAINI, S., KASLIWAL, B., and BHATIA, S.
(2013) Language Identification Using G-LDA.
International Journal of Research in Engineering and Technology, 02(11), pp
[5] LUI, M., LAU, J.H., and BALDWIN, T. (2014) Automatic Detection and Language Identification of Multilingual Documents.
Transactions of the Association for Computational Linguistics, 2, pp 27-40.
[6] PIERCE, J.R. (1973) The Early Days of Information Theory. IEEE Transactions on
Information Theory, 19(1), pp. 3-8. doi:
10.1109/TIT.1973.1054955
[7] SHANNON, C.E. (1948) A mathematical theory of communication. The Bell System
Technical Journal, 27, pp. 379–423, 623–656.
[8] IBEKWE-SANJUAN, F. and DOUSA, T.M. (2014) Theories of Information, Communication and Knowledge: A Multidisciplinary Approach. Springer Netherlands, Studies in History and Philosophy of Science, Volume 34. doi: 10.1007/978-94-007-6973-1_1
[9] PROAKIS, J.G. (2001) Digital Communications. Fourth Edition, The McGraw-Hill Companies, Inc.
[10] KISSANE, B., and HARRADINE, A. (2000) Mathematical Interactions: Getting Started. Shriro Australia Pty Limited.
[11] TAUB, H., and SCHILLING, D.L. (1986)
Principles of Communication Systems. Second
Edition, McGraw-Hill Publishing Company. [12] VAN FRAASSEN, B.C. (1977) Relative
Frequencies. Synthese, 34, pp. 133-166. [13] PANDE, H., and DHAMI, H. S. (2010)
Mathematical Modelling of Occurrence of Letters and Word‟s Initials in Texts of Hindi Language. SKASE Journal of Theoretical
Linguistics, 7(2), pp. 19-38.
[14] AL-HALABI, Y.S. (2012) Information Theory and its Application to Pattern Recognition in Image Processing.
International Journal of Engineering Inventions, 1(10), pp 14-18.
[15] MITRA, D., and VERMA, K.G. (2016) Information Processing using Multilevel Masking to Image Segmentation.
International Journal of Computer Applications, 141(3), pp. 1-6.
[16] BOSE, R. (2008) Information Theory,
Coding and Cryptography. Second Edition,
Tata McGraw-Hill Publishing Company Limited.
[17] COVER, T.M., and THOMAS, J.A. (2006)
Elements of Information Theory. Second
Edition, A John Wiley & Sons, Inc.
[18] SHAMILOV, A., and YOLACAN, S. (2006) Statistical Structure of Printed Turkish, English, German, French, Russian and Spanish. Proceedings of the 9th WSEAS
International Conference on Applied Mathematics, pp. 1-7
.
[19] SKÓRSKI, M. (2015) Shannon Entropy versus Renyi Entropy from a Cryptographic Viewpoint. Proceedings of the 15th IMA
International Conference, IMACC 2015, 9496,
pp. 257-274.
[20] BANERJI, A. (2010) Multimedia Technologies. Tata McGraw-Hill Education
Private Limited.
[21] Bauer, C.P. (2017) Unsolved!: The History
and Mystery of the World's Greatest Ciphers from Ancient Egypt to Online Secret Societies.
Princeton University Press.
[22] SHANNON, C.E. (1951) Prediction and entropy of printed English. The Bell System
Technical Journal, 30(1), pp 50-64