Projection of smoking prevalence and mortality
averted in Japan under the enhanced MPOWER
tobacco control scenarios
学位名
修士(公衆衛生学)
学位授与機関
聖路加国際大学
学位授与年度
2020
学位授与番号
32633公修専第080
Projection of smoking prevalence and mortality averted in
Japan under the enhanced MPOWER tobacco control scenarios
日本における MPOWER タバコ政策の強化により回避される喫煙
率と死亡に関する予測
St Luke’s International University Graduate School of Public Health
Capstone Thesis for Master in Public Health 2021
Su Lan Yang
19MP218
ii
Projection of smoking prevalence and mortality averted in Japan under the enhanced MPOWER tobacco control scenarios
日本における MPOWER タバコ政策の強化により回避される喫煙率と死亡に関する予測
Abstract
Objective: To project the smoking prevalence and mortality averted up to 2100 should Japan implement full MPOWER tobacco control measures by 2020.
Methods: This study used a population simulation method to project the smoking prevalence and mortality for the status quo and several MPOWER policies scenarios in Japan. The simulation used 2018 smoking prevalence data as the baseline, and used projected population, cessation rates, MPOWER effect sizes, and group-specific mortality rates to project the smoking prevalence and mortality up to 2100. The simulation models were sex-and age-specific and all interventions were initiated in 2020. The mortality averted was defined as the mortality difference between the status quo and the intervention scenarios.
Results: If Japan’s tobacco control status quo continues, smoking prevalence will decline from 29.6% in 2018 to 2.2% in 2100 in men and 8.3% in 2018 to 1.1% in 2100 in women. Introducing a smoke-free law is the best individual policy, and combining MPOWER measures renders smoking prevalence lower at a faster rate. Under the combined MPOWER scenario, a 50% relative reduction in prevalence can be achieved in 17 years in men and 25 years in women, and by 2100, smoking prevalence will drop to 0.7% in men and 0.4% in women. The combined MPOWER measures will avert a total of 405,910 deaths (295,048 male and 110,862 female) by 2100, of which 59,349 (14.5%) are attributable to lung cancer.
iii
reducing tobacco use. It also sets the stage for legislation of tobacco control laws that are beyond the MPOWER measures to achieve a tobacco-free society in Japan.
iv
Table of Contents
Table of Contents
1. INTRODUCTION ... 10
1.1. The global tobacco epidemic ... 10
1.2. Tobacco epidemic in Japan ... 11
1.3. Worldwide tobacco control measures ... 12
1.4. Tobacco control measures in Japan... 15
1.5. Knowledge gap and study objectives ... 18
2. METHODS ... 20
2.1. Simulation model ... 20
2.2. Data source ... 21
2.2.1. National Health and Nutrition Survey ... 21
2.2.2. Population and mortality data ... 22
2.3. Mortality rate projection ... 22
2.3.1. Total mortality rate ... 22
2.3.2. Group-specific mortality rate ... 23
2.4. Population projection ... 24
2.5. Input of new smokers into the simulation model ... 25
2.6. MPOWER intervention scenarios and effect sizes ... 25
2.6.1. Scenario P – Smoke free policy ... 26
2.6.2. Scenario O – Offer help to quit smoking ... 26
2.6.3. Scenario W (L) – Warning label on cigarette package ... 27
2.6.4. Scenario W (MM) – Warning though mass media campaign ... 27
2.6.5. Scenario E – Ban on advertising, promotion and sponsorship ... 27
2.6.6. Scenario R – Raise tobacco tax ... 28
v
2.7.1. Net cessation rate of status quo model ... 30
2.7.2. Net cessation rate of intervention (full MPOWER) model ... 32
2.7.3. Net cessation rate of combined MPOWER model ... 33
2.8. Lung cancer mortality rate ... 36
2.9. Averted death calculation ... 37
3. RESULTS ... 38
3.1. Smoking prevalence under the status quo scenario ... 38
3.2. Smoking prevalence under different policy scenarios ... 41
3.3. Averted deaths from different policy scenarios ... 43
3.4. Effect of combined MPOWER policy ... 45
4. DISCUSSION ... 49
4.1. Smoking trends and behaviour ... 49
4.2. Policy interventions... 50
4.3. Averted deaths... 52
4.4. Strengths and limitations ... 53
4.5. Conclusion ... 55
vi
Acknowledgements
I would like to express my deepest gratitude to my supervisor, Professor Stuart Gilmour. Without his guidance, this work would not be possible. Thank you for the patience you have shown whenever we encounter challenges in this work, and believing in my potential and capability when I myself have doubts. As a young researcher, I appreciate you trying to expand my collaborator network and rope me in related discussions. As an international student, I appreciate your support during the difficult times in COVID-19 period.
I would like to thank my external collaborators, Kota Katanoda and Kayo Togawa, for sharing your invaluable insights on the current status of tobacco control efforts in Japan and guidance to source for important data and references used in this work.
I am grateful for my mom, Lim Sow Mei and my siblings, Su Yin and Su Lim for always being there for me, as my emotional pillars, and showing me unconditional love and support throughout this period of work. To my dearest and my greatest supporter, Sanford Chin, thank you for your sacrifice and understanding for the time we couldn’t spend together when this Master thesis work was on-going. I am in debt to the school, all supporting staff and faculty members who provide a friendly and conducive environment for learning. I am thankful for MPH seminar course lead, Professor Kevin Urayama, and course colleagues who improved my work with constructive criticism.
Last but not least, thank you to all my MPH coursemates. The friendship that we built had opened my eyes to Japanese culture, language and wisdom. Your kindness and humility have touched me. Please allow to me express my most heartfelt gratitude to each and every one of you. “ほんとにあり
vii
List of Figures
Figure 1: The probability of countries achieving 30% relative reduction on smoking prevalence by 2025. Source [24]. ... 14 Figure 2: The general model to project the prevalence of current and former smokers. ... 21 Figure 3: Fitted graph of observed male current smoker prevalence from NHNS data and predicted
prevalence from regression model. (a) Male model, (b) Female model. ... 31 Figure 4: Projection of smoking prevalence among men under the status quo. (a)Prevalence of current
smokers; (b) Prevalence of former smokers; (c) Prevalence of ever smokers. ... 39 Figure 5: Projection of smoking prevalence among women under the status quo. (a)Prevalence of current
smokers; (b) Prevalence of former smokers; (c) Prevalence of ever smokers. ... 40 Figure 6: Projection of smoking prevalence up to 2100 under different policy scenarios. ... 42 Figure 7: Averted all-cause and lung cancer deaths from different policy scenarios (2018–2100). ... 45 Figure 8: Cumulative deaths over 80 years under the combined MPOWER policy scenario (2018-2100). 46 Figure 9: Total averted deaths and averted deaths from 70+ age group only. ... 47 Figure 10: Averted deaths from age groups below 70 years old. (a) Men; (b) Women. ... 48
viii
List of Tables
Table 1: MPOWER measures in Japan. ... 15
Table 2: Questionnaire change in the smoking habit module of NHNS. ... 22
Table 3: Summary of intervention scenarios and its effect sizes. ... 29
Table 4: Summary table of age- and sex-specific cessation rates used in models. ... 35
Table 5: Summary table of group- and age-specific lung cancer mortality proportion... 37
Table 6: Averted all-cause deaths from different policy scenarios (2018–2100). ... 44
ix
List of abbreviations
DALY Disability-adjusted life years ENDS Electronic nicotine delivery system ENNDS Electronic non-nicotine delivery system FCTC Framework Convention of Tobacco Control
HNB Heat-Not-Burn
HTP Heated tobacco products
MDG Millennium development goal
SDG Sustainable development goal
SHS Secondhand smoke
10
1. INTRODUCTION
1.1. The global tobacco epidemic
With 1.3 billion tobacco users worldwide, the tobacco epidemic is a major public health threat in the 21st century [1]. The global prevalence of adult smoking is 19.2% in 2017, with the highest
prevalence recorded in high-income countries (21.6%), followed by middle-income countries (19.5%) and low-income countries (11.2%) [2]. The prevalence of global tobacco use has an encouraging downward trend, but the gains in tobacco control have not been evenly distributed globally. The net reduction in tobacco use between 2000 and 2015 was primarily a result of the tremendous progress made in the WHO regions of Americas and Europe in reducing 75.0 million smokers, followed by a smaller reduction of 3.9 million in the WHO South East-Asia region and 3.2 million in the Western Pacific region. [3]. However, this substantial decrease was also countered by the increased number of smokers in the WHO regions of African and Eastern Mediterranean (40.3 million) [3].
Tobacco use and trends in tobacco control are also unevenly distributed in other population groups. Tobacco consumption is higher among men than women (32.7% vs 5.8%) [2]. Sex- and country income level-specific analysis showed that male smoking prevalence is highest in middle-income countries (35.3%), whereas the highest female prevalence occurred in high-income countries (16.4%) [2]. Adolescent smoking prevalence varied greatly across countries, but a global estimate from 2007-2014 data showed that 7% of youth aged 13-15 years old smoked [4]. Because tobacco is highly addictive and efforts to quit smoking often fail, this high prevalence of youth smoking means that the tobacco epidemic remains locked in for future generations, with decades of future smoking-related ill-health still guaranteed.
Tobacco use has detrimental health, social and economic consequences. Tobacco use is the second leading risk factor—after high systolic blood pressure— for premature death and disability globally, accounting for over 8 million deaths and 182 million disability-adjusted life years (DALY) lost annually [5]. Of the over 8 million deaths occurred globally per year, 7 million deaths are due to due to the direct use of tobacco and 1.2 million deaths are attributable to secondhand smoke (SHS) exposure [5]. The
11
top four smoking-attributable causes of death are ischemic heart disease; chronic obstructive pulmonary disease; tracheal, bronchial, and lung cancer; and stroke. These together are responsible for about 70% of all smoking-attributable deaths [5].
On the societal level, although not the same for all countries, tobacco use is disproportionately prevalent in lower-income households[6]. Tobacco use leaves poorer households in a vicious cycle of poverty, where money for basic necessities, such as food, shelter and education, are spent on tobacco [7]. Tobacco farming, usually in lower-income regions, is labour intensive and exposes tobacco farmers to occupational hazards such as pesticide poisoning and green tobacco sickness [8]. In return, farmers’ wages are meagre compared to the final sale price due to the cost added along the production chain [9]. Therefore, tobacco use is not only a barrier to achieving the health-related sustainable development goal (SDG) 3.4 and 3A, it also impedes global advances to other SDGs such as SDG 10 (reduce inequality within and among countries), and SDG 8 (promote sustained, inclusive and sustainable economic growth, full and productive employment and decent work for all) [10].
The tobacco epidemic also damages the global economy directly through its health impact. Smoking-attributable mortality and morbidity increased global healthcare expenditure by an estimated US$ 422 billion in 2012, which was 5.7% of total global health expenditure [11]. The indirect cost of productivity loss from smoking-attributable death and disability was US$ 1 trillion [11]. Altogether, the direct and indirect cost of smoking totalled US$ 1.4 trillion, accounting for 1.8% of annual global gross domestic product [11].
1.2. Tobacco epidemic in Japan
Tobacco use remains a major public health problem in Japan. The prevalence of tobacco use in Japanese man peaked at 83.7% in 1966 before it decreased steadily by two-thirds to 25.6% in 2017, over half a century. In contrast, female smoking prevalence started lower at about 20% in 1966 but endured a slower decline to 11.2% in 2017 [3,12]. Cigarette use among Japanese adolescents is also on a declining trend [13], with lifetime prevalence of cigarette use among 15–18-year-olds of 5.1% in 2017 [14]. There were 157,800 smoking-attributable deaths in 2016, accounting for 18.3% of all deaths in
12
men and 4.9% of all deaths in women [15]. Despite the decline in tobacco use, due to the accumulated past exposure and Japan’s rapid ageing, tobacco use plays a major role in the country’s chronic disease burden. The leading smoking-attributable deaths among men are lung cancer (29%), ischemic heart disease (17%) and stroke (6%); while in women, the order is slightly different, ischemic heart disease came up first at 28%, stroke at 23% and lung cancer at 18%[16]. It has been estimated that lung cancer alone would cause 63,000 deaths in men in 2025 and 32,000 deaths in women in 2035 [17].
The tobacco epidemic is now made worse as the newer tobacco products, such as heated tobacco products (HTP) and electronic nicotine delivery system (ENDS), entering the market and gaining popularity. According to the National Health and Nutrition Survey 2018, about 20.3% of the smokers used HTP, of whom 8.6% of them used both conventional cigarettes and HTP, and the majority of the HTP users are aged less than 40 years. While the sales of ENDS are prohibited in Japan, electronic non-nicotine delivery system (ENNDS) is allowed. As much as 3.5% of adolescents claimed to use ENNDS in 2017, and dual users are common [14]. Ever since the launch of these new tobacco products, Japan has been claiming the largest market share for heated-tobacco products in the world [18,19]. Even as Japan’s efforts to control tobacco use slowly improve, tobacco company strategies to find new ways to sell nicotine threaten to maintain the epidemic long into the future without further tobacco control efforts.
1.3. Worldwide tobacco control measures
The health and economic impact of tobacco use is huge, but unnecessary and avoidable. Although it has been 70 years since Sir Richard Doll's landmark paper that established the association between smoking exposure and lung cancer [20], and 56 years since the 1964 US Surgeon General's report that warned of the health hazards against smoking, the battle against the tobacco epidemic is far from accomplished [21]. Global effort is needed to end this epidemic and save lives. At the 2003 World Health Assembly, all World Health Organization (WHO) member states announced their commitment to curb the tobacco epidemic by unanimously adopting the Framework Convention on Tobacco Control (FCTC), and to date 182 Parties have ratified this agreement [22]. The WHO FCTC came into full force
13
in 2015, the same year that the United Nations Millennium Development Goals (MDGs) were replaced by the Sustainable Development Goals (SDGs) and worldwide tobacco control was embedded in SDG 3A (strengthening the implementation of the WHO FCTC) and SDG 3.4 (reducing premature mortality from non-communicable diseases by one-third) [23]. In 2017, the WHO FCTC introduced the MPOWER package, a bundle of six cost-effective and high-impact measures intended to assist countries in reversing the tobacco epidemic, and to help track national progress on tobacco elimination. The six domains of MPOWER measures are:
1. Monitor tobacco use and prevention policies
2. Protect people from tobacco exposure with smoke-free policies 3. Offer help to quit
4. Warn about the dangers of tobacco
5. Enforce bans on tobacco advertising, promotion and sponsorship 6. Raise tobacco tax
The 2019 WHO report on the global tobacco epidemic noted that 136 countries (70%, covering 5 billion population) had implemented at least one out of six MPOWER measures; 82 countries (42%, covering 3.4 billion population) have implemented at least two out of six MPOWER measures to the highest level [2]. Cessation polices (O) are the least frequently adopted measure (23 countries) at the highest level, whereas cigarette pack warnings are the most adopted measure (91 countries) [2]. In 2012, Australia became the first country to go beyond MPOWER measures to enact a tobacco plain packaging law to restrict advertising on cigarette packages and since, about 19 countries have followed suit to either mandate plain packaging or pass regulation to do so [2].
Countries progressed at a vastly different pace, some steadily improving while some are lagging behind [2,24]. So far only Turkey and Brazil have successfully implemented all MPOWER measures to the highest level; Australia, New Zealand and Ireland are very close to achieving that, with only the "E" measure remaining at the second highest level [2]. Although countries are bound by the obligation to the FCTC international treaty to end the tobacco epidemic, overall progress towards a tobacco-free world is slow. According to a global estimate, only 37 (21%) countries are on track to achieve the 2025 target of 30% relative reduction on male smoking prevalence and 88 (49%) countries are able to achieve
14
female smoking prevalence target[24]. The probability of countries achieving targets is shown in Figure 1.
Figure 1: The probability of countries achieving 30% relative reduction on smoking prevalence by 2025. Source [24].
Countermeasures by the tobacco industry pose a major barrier to ending the tobacco epidemic is the [25]. Tobacco companies have launched several legal challenges to countries' legislative bodies in the past, and filed disputes against tobacco control laws with the World Trade Organization (WTO) [26]. Although these efforts to undermine tobacco control policies have not been fruitful, the decade-long lawsuits managed to delay policy implementation in countries and put more people at risk of tobacco-related ill health and death [27]. A more recently strategy from the tobacco industry is the attempt to disguise themselves as a worthy public health partner by claiming to help people quit conventional
15
smoking through newer tobacco products [2]. Tobacco companies fund research that promotes newer tobacco products as a "risk-reduction" tool and ruthlessly misinform the public on unproven health claims regarding these products, with the aim to convert current tobacco users and recruit new users [2]. For instance, Japan Tobacco International markets Ploom® and Logic® as modern lifestyle products
with a sleek design that appeals to customers who want an "upgrade" from cigarette smoking. Constant action is required for governments to remain ahead of tobacco companies’ efforts to find new ways to market their products, and this action is especially difficult in countries like Japan where tobacco control measures lag those of their international peers.
1.4. Tobacco control measures in Japan
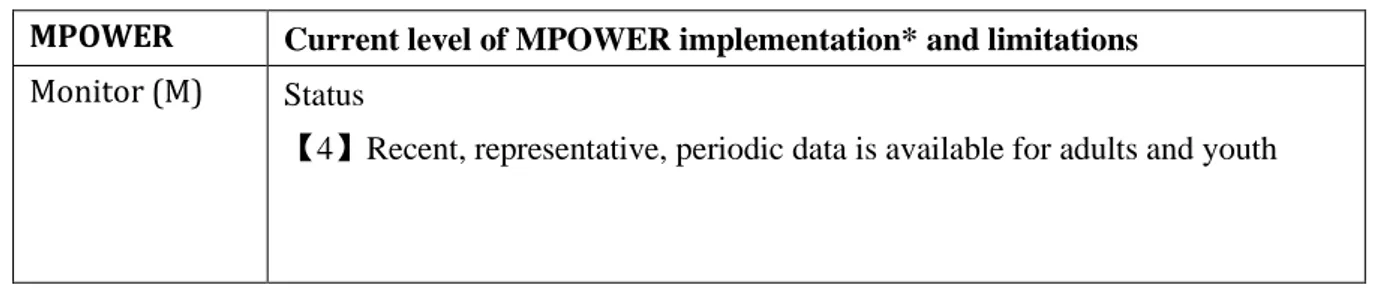
Japan has been one of the signatory parties to the WHO FCTC since June 2004. Sadly, sixteen years after FCTC ratification, Japan is ranked as one of the poorest performing high-income countries in implementing MPOWER measures, predominantly due to the strong conflict of interest within the ruling government where the Finance Ministry owns a 33% share in Japan Tobacco [28]. Despite healthcare professionals, public health experts, patient groups and civil society advocating for stronger anti-tobacco policies to de-normalize smoking, the current government continues to be friendly with and allow the tobacco industry to interfere in anti-tobacco legislation [12,29,30]. As a consequence, many proven tobacco control measures have yet to be translated into public health policies. Table 1 summarizes Japan's MPOWER implementation and its limitations. The areas where Japan received "weak policy" ratings were (1) protect people from tobacco smoke (P); (2) warn about the dangers of tobacco (W); and (3) enforce restrictions on tobacco advertising, promotion and sponsorships (E) [2,31].
Table 1: MPOWER measures in Japan.
MPOWER Current level of MPOWER implementation* and limitations Monitor (M) Status
16
Smoke-free policies (P)
Status
【2】3 to 5 public places completely smoke-free
Detail
1. Provision to ban smoking completely in four public places (healthcare, education, university and government facilities) was adopted but not implemented by December 2018.
2. The Industrial Safety and Health Act require workplace to be smoke-free or partially smoke-free with designated smoking area (DSA).
3. There are subnational laws/ordinances in Kanagawa, Hyogo and Tokyo prefecture but with insufficient enforcement.
Limitations
1. Policies are set to be effective from April 2020 [32].
2. As per WHO FCTC standard, the definition of "complete" smoke-free environment means no ventilation and designated smoking areas (DSA) are allowed. The Health Promotion Act has many exemption clauses and strictly speaking, is not a complete smoke-free policy. E.g., smoking is allowed in facilities if there is a DSA and small eateries less than 100sqm are exempted.
Offer cessation (O)
Status
【3】NRT and/or some cessation services (≥ 1 of which is cost-covered)
Detail
1. Nicotine replacement therapy (NRT), varenicline, behavioral modification therapy, unassisted attempt are the available smoking cessation methods.
2. NRT is available as over-the-counter items; varenicline is prescription-only medicine.
Limitation
1. No national quit line.
2. NRT and varenicline are not the most popular methods to quit smoking. 3. Cost for smoking cessation service is covered under national health insurance but limits its eligibility to heavy smokers. It covers merely 1% of the smokers in Japan [33,34].
17
(W, Labels) 【2】Medium size warning missing some/many appropriate characteristics
Limitation
1. Warning message covers 30% at the time of report.
2. Effective April 2020, it will cover 50% but still without many appropriate characteristics.
3. No pictorial warning or plain packaging [35].
Warn about the danger of tobacco thru mass media campaign (W, MM) Status
【2】National campaign conducted with 1 - 4 appropriate characteristics
Limitation
1. National campaign conducted between July 2016 and June 2018, with 2 appropriate characteristics. Ban on advertising, promotion and sponsorships (E) Status
【1】Complete absence of ban, or ban that does not cover national TV, radio and print media.
Limitation:
1. Ban on printed media only.
2. Only focuses on restricting advertising to minors.
3. Advertising at point-of-sales, promotion to adults and tobacco company event sponsorships are allowed.
Raise tobacco tax (R)
Status
【3】50-75% of retail price is tax.
Detail
1. 63.1% of retail price is tax
2. As of 2017, a standard pack of 20 cigarettes is priced at JPY430−490 (USD 4.0−4.6). If tax is increased to 75% of retail price, the selling price of a standard pack of cigarette would be JPY 636-725 (USD 6-7).
Limitation
1. Cigarette price is affordable compared to other developed countries. 2. Last tax increment was in 2010.
18
*Country MPOWER status in June 2018, as reported in WHO report on the global tobacco epidemic
2019. MPOWER implementation are rated in 5 levels: 0, no data; 1, no policy; 2 minimal policy; 3,
moderate policy; 4, complete policy.
The guidelines for implementation of WHO FCTC Article 8 recommend that comprehensive smoke-free policies be put in place within five years of entry into force of the Convention for that Party [36]. In July 2010, which is about five years after Japan’s entry into force, the International Olympic Committee (IOC) agreed with WHO to promote the Olympics as a smoke-free event where every host country must comply to legislate a smoke-free policy throughout the Olympic games [37]. However, it was not until 2018 that the cabinet of the Japanese government, in anticipation of the Tokyo 2020 Olympics, finally passed a long-delayed, watered-down bill to prohibit smoking in all restaurants and bars with floor size more than 100m2 in Tokyo [38]. This Prevention Ordinance commenced in April
2020 and allowed the Tokyo Metropolitan government to impose penalties on any facilities that violate the rule. However, this new policy is still far from meeting the requirement of FCTC Article 8, which mandates a complete smoking ban in all public and indoor places nationwide.
The evidence is clear that Japan lags behind many countries in its tobacco control measures, and there are a lot of opportunities for improvement.
1.5. Knowledge gap and study objectives
Tobacco use kills, MPOWER works. Japan lags behind in its implementation despite public health experts have criticized the inadequacy and advocated for immediate implementation of stricter MPOWER package in Japan [12,39]. Many countries conducted modelling analysis [40–42] on the potential impact of MPOWER measures on prevalence and mortality but there is no similar study conducted in Japan despite the utility of such country-specific analysis to motivate and advocate for better anti-smoking legislation. A few Japanese studies looked at how hypothetical changes in smoking prevalence [43], dynamic changes in the ageing population [17], and implementation of a single enhanced MPOWER measure [44] would affect the number of deaths from smoking-related diseases.
19
None of these studies considered to assess the potential impact of full MPOWER package using the effect size of each MPOWER measure in their estimation models. It is against this backdrop that my research aims to assess the impact of full MPOWER measures in Japan.
My study objectives are:
1. To project the smoking prevalence and mortality of current, former and never smokers up to 2100 under the status quo scenario representing current tobacco control measures.
2. To project the smoking prevalence and mortality of current, former and never smokers up to 2100 under enhanced MPOWER scenarios.
3. Using the status quo scenario as the baseline, to estimate the mortality averted in enhanced MPOWER scenarios.
My research will highlight the importance of anti-tobacco measures in reducing unnecessary deaths and I hope this will consolidate the scientific evidence to advocate for stricter tobacco control policies in Japan.
20
2. METHODS
A simulation model was used to project the number of smokers, smoking prevalence, and mortality from current, former, and never smokers. The model was run for eight different scenarios: one for the status quo, one for each MPOWER intervention, and one for combined MPOWER interventions, each time inputting the corresponding cessation rate. Youth smoking prevalence was not considered in this model; the age variable was organized into six 10-year age groups (20-29, 30-39, 40-49, 50-59, 60-69, and 70+). Models were run separately for men and women. The number of deaths averted from each intervention was defined as the excess mortality in the status quo compared to the intervention scenario.
2.1. Simulation model
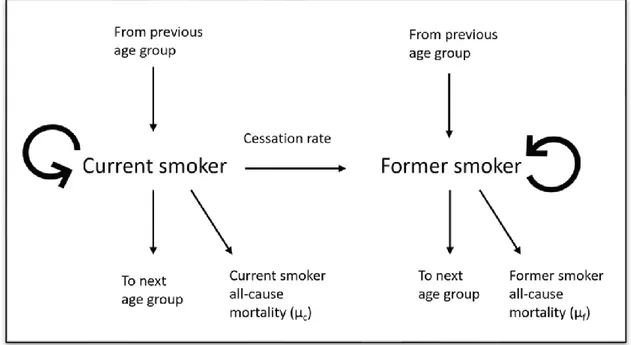
The model started with the number of current and former smokers at the baseline year 2018. The number of smokers was obtained by multiplying the population projection by the age-specific smoking prevalence from the National Health and Nutrition Survey (NHNS) 2018. First, net cessation rate and current smokers' all-cause mortality rate (𝜇𝑐) were applied to determine the number of smokers who became former smokers and mortality among smokers. Net cessation rate is different for each scenario and is the key driver to different outcomes. Next, having calculated changes in the distribution of current, former and never smokers due to cessation and mortality, the population matured by one year, and 10% of the remaining population in each 10-year age group was shifted to the next age group while 90% remained in the same age group. At the end of each year, the number of smokers was converted to prevalence. The former smoker population was simulated using similar dynamics. Using 2018 as the base year, we projected the model up to 2100, and all interventions were set to begin from 2020. The process is described in Figure 2.
21
Figure 2: The general model to project the prevalence of current and former smokers.
2.2. Data source
2.2.1. National Health and Nutrition Survey
The National Health and Nutrition Survey (NHNS) is a cross-sectional survey, consisting of health, nutrition and lifestyle questionnaires, conducted nationwide in Japan annually by the collaborative effort of the Ministry of Health, Labour and Welfare (MHLW) and local government public health centers [45]. The smoking habit module of the NHNS captures the prevalence of current, former, and never smokers since 1995. The smoking habit questionnaires changed three times over the years (Table 2): the question "Have you ever smoked more than 100 cigarettes and more than six months?" was removed from 2011 onwards and the question "Have you ever smoked habitually?" was removed from 2013. This alteration in the questionnaire did not affect current smokers' prevalence trend but has resulted in a drastic rise and fall in the prevalence of former smokers in 2011 and 2013 onwards. Hence, we decided to use the prevalence of current smokers up to 2018 and the prevalence of former smokers up to 2010. The smoking prevalence was reported in ten-year age groups (e.g., 20-29, 30-39, …, 60-69,
22
70+ years old).
Table 2: Questionnaire change in the smoking habit module of NHNS.
2003-2010 2011-2012 2013 onwards
Current Ever smoked >100 cigarettes AND smoked >6 months AND have smoked daily/sometimes in recent 1 month.
Ever smoked
habitually AND have smoked daily/sometimes in recent 1 month. Smoked daily/sometimes in recent 1 month.
Former Ever smoked >100 cigarettes AND smoked >6 months AND have not smoked in recent 1 month.
Ever smoked
habitually AND have not smoked in recent 1 month.
Used to smoked but have not smoked in the recent 1 month.
Never 1. Ever smoked <100 cigarettes AND smoked <6 months AND have not smoked in recent 1 month.
2. Those who never smoked.
Never smoked. Never smoked.
2.2.2. Population and mortality data
We used sex- and age-specific population data (1958-2018) from Japanese Vital Statistics (Ministry of Health, Labour and Welfare), which is downloadable from the National Cancer Centre Research website [46]. Sex- and age-specific all-cause mortality data (1980-2016) was obtained from Japanese Vital Statistics. Both population and mortality data were available in five-year and ten-year age group stratification.
2.3. Mortality rate projection
2.3.1. Total mortality rate
23
mortality rate for the total population (µt), separately for men and women. The regression model was
built using data from 1980 to 2016 and the estimates of this all-cause mortality rate were used in population projection up to 2100. The regression coefficients of year variable were also used to project group-specific mortality rates.
2.3.2. Group-specific mortality rate
Mortality relative risks were used to partition the 2018 age-specific total mortality rate (µt) into
three groups, i.e., current (µc), former (µf) and never smoker (µn) mortality rates. The total number of
deaths can be calculated as
𝜇𝑡𝑁𝑡 = 𝜇𝑐𝑁𝑐+ 𝜇𝑓𝑁𝑓+ 𝜇𝑛𝑁𝑛 (1) Relative risk of mortality in each of the risk groups is known and defined as
𝑅𝑅𝑐 = 𝜇𝑐 𝜇𝑛 ⇒ 𝜇𝑐= 𝑅𝑅𝑐𝜇𝑛 (2) 𝑅𝑅𝑓 = 𝜇𝑓 𝜇𝑛 ⇒ 𝜇𝑓 = 𝑅𝑅𝑓𝜇𝑛 (3)
Dividing equation (1) by total population (Nt) and inserting equations (2) and (3) we can obtain
𝜇𝑛=
𝜇𝑡
𝑅𝑅𝑐𝑃𝑐+ 𝑅𝑅𝑓𝑃𝑓+ 𝑃𝑛 Where
t designates total population c designates current smoker f designates former smoker n designates never smoker µ = mortality rate
N = population count
RR = relative risk of all-cause mortality in relative to never smoker p = prevalence
Once the mortality rate of never smokers (𝜇𝑛) was obtained, the mortality rate of current and former smokers was deduced from equations (2) and (3). The all-cause mortality relative risk for current and former smokers used in this study were 1.6 and 1.24 for men, and 1.48 and 1.24 for women [47].
24
The age-specific mortality rate in each group was then projected forward using the regression coefficient of year variable from a Poisson regression model of mortality, which is described in section 2.3.1. The age-specific formula for total mortality can be decomposed into contributions from each of the smoking groups as follows:
(𝜇𝑡𝑁𝑡)𝑖 = 𝛾(𝜇𝑡𝑁𝑡) = 𝛾𝑟𝑐𝜇𝑐𝑃𝑐𝑁𝑡+ 𝛾𝑟𝑓𝜇𝑛𝑃𝑓𝑁𝑡+ 𝛾𝜇𝑛𝑃𝑛𝑁𝑡 (4) where
(𝜇𝑡𝑁𝑡)𝑖= the mortality at time i
𝛾 = the multiplicative time factor at time i, which can be derived from the regression coefficient (𝛽) of year from a Poisson regression model of mortality trend, where 𝛾 = exp (𝛽).
r = relative risk of mortality risk in relative to never smoker
The age-specific time factor (γ) is applied to the 2018 age-specific mortality rate in each group over time to obtain future group-specific mortality rates in all three groups.
2.4. Population projection
Using the 2010 population as base, the population was projected up to 2100 using parameters such as sex- and age-specific all-cause mortality rate estimates, total fertility rate, and infant sex ratio. The base population and all-cause mortality rate estimates were organized in 5-year age groups (0-4, 5-9, …, 75-79, 80+) for more accurate estimates. I started by projecting the female population because that would provide the number of newborns each year. In a yearly cycle, first, the mortality cases were removed by multiplying the population by that year's mortality rate, adjusted for the long-term downward trend identified in the regression model of mortality. Second, we multiplied fertility rates by the number of women at reproductive age (15-49 years old) to provide the number of newborns that would enter the 0-4 years old cohort in the following year. The number of newborns was apportioned by sex according to the infant sex ratio. Third, we shifted the age group by 1 year as the population matured into subsequent years and repeated the cycle. The projection of the male population was conducted similarly by adding the number of male newborns into the 0-4 years old male cohort. We assumed a constant total fertility rate (TFR) of 1.44, which is the TFR used in the medium fertility
25
variant in the population projection conducted by National Institute of Population and Social Security Research, throughout this model [48]. The male to female infant sex ratio used was 1:1.04.
2.5. Input of new smokers into the simulation model
The simulation only considered smoking prevalence for those aged 20 years and above. This model assumes (1) smoking initiation only happens in age group 20 years; (2) age group 20 years only enters as current or never smoker, but not as former smoker; and (3) new entrants to the smoker population enter with a smoking prevalence that matches the current profile of 20-29 years old. These assumptions were necessary because data on smoking behavior in under 20- year-old is difficult to obtain. The number of new entrants into the model at the beginning of each year is as below.
𝑁𝐶20,𝑗= 𝑃𝐶(20−29),𝑗−1× 0.2 × 𝑁𝑡(15−19),𝑗−1
Where,
NC20,j is the number of current smokers aged 20 years at the j-th year
PC(20-29), j-1 is the prevalence of current smokers in the age group 20-29 years old at the (j-1)th year
Nt(15-19), j-1 is the number of people in the age group 15-19 years old at the (j-1)th year
The factor of 0.2 is applied to the 15-19 age group population to ensure that only the final year of this age group matures into the 20-29 age group. This ensures that each year the model effectively matures one year of the projected 15-19 age group into the 20-29 age group category, then converts a proportion of this 20-years-old population into smokers using the prevalence of smokers in the 20-29 years age group in the previous year.
2.6. MPOWER intervention scenarios and effect sizes
MPOWER describes a set of six high impact and cost-effective tobacco control measures suggested by WHO FCTC to help countries reverse the tobacco epidemic. The WHO report on the global tobacco
26
minimal policy, 3 for moderate policy, and 4 for complete policy. The intervention scenarios used in this analysis are hypothesized on the MPOWER measures implemented at its highest level (4, complete policy), that is, full MPOWER implementation. These measures were selected because they have yet to be implemented in Japan at the time of analysis, except for the "M" measure where Japan have already attained the highest policy level. Seven intervention scenarios were included in this analysis—six individual MPOWER measures and one combined MPOWER measure.
The effect sizes of each intervention were obtained from Levy et al. 2018. The effect size is defined as the long-run (40 years horizon) relative reduction in smoking prevalence of full MPOWER implementation relative to zero MPOWER implementation. However, Japan's current MPOWER implementation levels do not start at the lowest level, so the effect sizes need to be adjusted accordingly. The effect sizes for intervention scenarios are apportioned equally by level, so that the four levels of any intervention lead to equally sized increments in effect size up to the maximum. The effect size is assumed to be universal across all age groups and both sexes, except for the "R" (tax) measure, where the effect size is larger among younger age groups due to differences in cigarette affordability. The proposed intervention and effect sizes are summarized in Table 3.
2.6.1. Scenario P – Smoke free policy
Although Japan received a rating of "minimal policy【2】" for the P measure in the WHO report
on the global tobacco epidemic 2019, the smoke free policy was not implemented until April 2020.
Therefore, in scenario P, the model started with "no policy【1】" in 2018, and the full MPOWER implementation commences from 2020 onwards. The proposed intervention is to have a complete smoke-free policy for all public places (including healthcare facilities, educational facilities, universities, government facilities, indoor workplaces, restaurants, public places, and others). The effect size is -12.5%.
2.6.2. Scenario O – Offer help to quit smoking
Japan has achieved "moderate policy【3】" for the "O" measure and is only one level away from complete policy. The proposed intervention is to have a national quit line, financial coverage for more
27
smokers to access smoking cessation services, and more intervention from healthcare professionals. The effect size from Levy et al. 2018 is -11%, but because Japan has already achieved moderate policy, we apportioned it to -5%.
2.6.3. Scenario W (L) – Warning label on cigarette package
Japan achieved a "minimal policy【2】" for the "W(L)" measure by mandating warning labels to cover at least 30% of cigarette packaged, but many appropriate characteristics were missing. The proposed intervention for scenario W(L) is to mandate a large warning label covering at least 50% of the cigarette package and contains all characteristics. The effect size from Levy et al. is -10%, but the effect size used in this study was apportioned to -8.33%.
2.6.4. Scenario W (MM) – Warning though mass media campaign
Japan was rated "minimal policy【2】" for the "W(MM)" measure by running national anti-tobacco campaign between 2016 and 2018 with two appropriate characteristics. The proposed intervention is to have a national campaign with all seven appropriate characteristics, including airing warning messages on television and radio. The effect size from Levy et al. is -12%, but the effect size used in this study was apportioned to 9%.
2.6.5. Scenario E – Ban on advertising, promotion and sponsorship
Japan has "no policy【1】" to ban tobacco advertising, promotion and sponsorship as per WHO
report on the global tobacco epidemic 2019. Scaling up the intervention scenario to the highest policy
level means implementing bans on tobacco advertising to adults and youth, as well as all tobacco promotion and tobacco company sponsorship to any events. The effect size from Levy et al. is -6% for total ban on tobacco advertising but no mentioning of promotion and sponsorship bans. The effect size used in this study is -6%.
28
2.6.6. Scenario R – Raise tobacco taxAccording to the WHO report on the global tobacco epidemic 2019, the selling price of most cigarette brands in Japan is ¥440 and the tax component is 63.1% (i.e., cigarette price is ¥163 while tax is ¥277). If tax were to be raised to 75% of cigarette price, the cigarette selling price would be ¥652 (i.e., cigarette price is ¥163 while tax is ¥489). The cigarette price would increase 48% if the tax component were to be increased to 75%. The long-run tobacco price elasticity for high-income countries is estimated to be -0.36[4], which means a 1% increase in price will reduce tobacco consumption by 0.36% and therefore reduce smoking prevalence. Price elasticity can be multiplied by the projected relative change in cigarette price (in this case 48%) to get the prevalence change, i.e. the effect size of the policy implementation (in this case 48 x -0.36 = -17.2%). Price elasticity is higher for youth and young adults than older adults due to price affordability. This analysis adopted the age-specific price elasticity reported in the Korean and Chinese SimSmoke models because of the comparable cigarette price and tobacco control policies between Japan, Korean and China. A slight modification was made on the age group of Korean SimSmoke price elasticity so it can be applied to this model. The finalized age-specific price elasticities and effect sizes used in this model are -0.30 for age group 20-29, -0.20 for age group 3039 and 0.10 for age group ≥40. This translates to the effect size of 15%, 10% and -5% for the respective age groups.
29
Table 3: Summary of intervention scenarios and its effect sizes.
MPOWER MPOWER status* Intervention scenario Effect size in
Levy et al. 2018
Effect size in this study†
2018 Scaled-up
P 2 4 All public places (including healthcare facilities, educational facilities, universities, government facilities, indoor workplaces, restaurants, public places, and others) to be completely smoke-free‡.
-12.5% -12.5%
O 3 4 Have a complete cessation policy that includes a national quitline, financial coverage and intervention from healthcare professional.
-11% -5%
W (L) 2 4 Cigarette package to display large warning that covers >50% and contains all characteristics.
-10% -8.33%
W (MM) 2 4 Have a national campaign with 7 appropriate characteristics -12% -9%
E 1 4 Ban all tobacco advertising, promotion and sponsorship. -6% -6%
R 3 4 Increase the tax component from 63.1% to 75%. Price elasticity
by age groups: 18-24 : -0.30 25-34 : -0.20 ≥35 : -0.10 Price elasticity by age groups: 20-29: -0.30 30-39: -0.20 >40 : -0.10
Effect size by age groups:
20-29: -15% 30-39: -10% >40 : -5%
* Country MPOWER status in June 2018, as reported in WHO report on the global tobacco epidemic 2019. MPOWER implementation level is rated in 5 levels: 0, no data; 1, no policy; 2, minimal policy; 3, moderate policy; 4, complete policy.
† Effect size used when scaling up an MPOWER intervention from 2018 status to level 4-complete policy.
30
2.7. Cessation rate
The study describes cessation rate as net cessation rate, which is the net value after considering smoking cessation rate and initiation rate. Sex- and age-specific cessation rates were used in this study.
2.7.1. Net cessation rate of status quo model
To obtain the age-specific cessation rate for the status quo model, current smoker prevalence data from the NHNS (1995-2018) was used to run a linear regression model on the log of prevalence. The basic linear regression model equation is:
ln (𝑝𝑖) = 𝛽0+ 𝛽1𝑥𝑖1+ 𝛽2𝑥𝑖2+ 𝛽3𝑥𝑖1𝑥𝑖2+ 𝜖𝑖 (5)
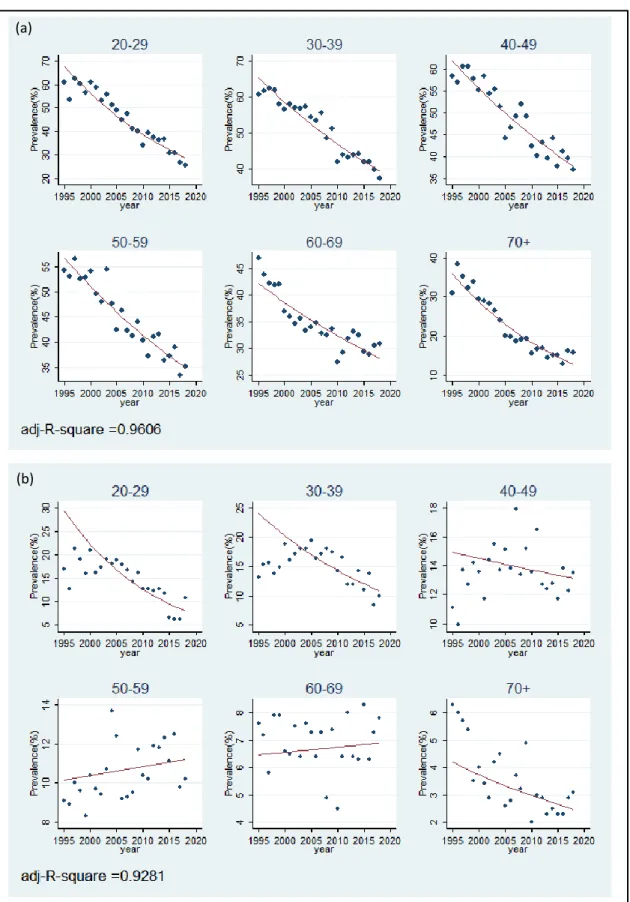
Define the prevalence for observation i (in year i) as 𝑝𝑖. Define year variable for the i-th year as 𝑥𝑖1, where 𝑥11 is 0 in 1995, and age group variable as 𝑥𝑖2. This ensures the intercept of all models is the value of prevalence in 1995. In practice, the age group variable 𝑥𝑖2 is decomposed as a set of dummy variables (one for each age group with the reference category omitted). However, for simplicity, it is represented as a single variable in equation (5). The estimated coefficient of the year variable (𝛽1+ 𝛽3) is the estimated age-specific cessation rate and is summarized in Table 4. In female 50-59 and 60-69 age groups, the estimated coefficients were positive, indicating growth in the number of current smokers. However, the values were small (0.0042 and 0.0028) and assumed to be zero in our model, indicating no cessation or growth for the 50-59 and 60-69 age groups. The predicted prevalence fits well with the original data (Figure 3). The status quo cessation rate was applied throughout all years in the status quo model (2018-2100) and for two years in the intervention model (2018-2019).
31
Figure 3: Fitted graph of observed male current smoker prevalence from NHNS data and predicted prevalence from regression model. (a) Male model, (b) Female model.
(a)
32
2.7.2. Net cessation rate of intervention (full MPOWER) model
The cessation effect of the intervention model was calculated based on the effect size in Table 3, added on to the cessation rate for status quo, and then applied to the intervention model from 2020 onwards. The formula to derive cessation rate of each intervention is described below.
Consider the original text in Levy et al. 2018 about effect size, "we convert their estimates to
relative terms, that is, the absolute change relative to the initial smoking prevalence." From this, the
effect size is defined as,
𝐸𝑆 =𝑝0− 𝑝1 𝑝0 𝐸𝑆 =𝑝0−𝑝1 𝑝0 = 1 − 𝑝1 𝑝0= 1 − 𝑟 (6)
Assume 𝑝1 < 𝑝0 because the prevalence is on a declining trend. Define the relative prevalence as 𝑟 =𝑝1
𝑝0 . Rewrite r as a multiplier,
𝑝1= 𝑟𝑝0 Decompose this into a series of t time steps, so that
𝑝1= (1 − 𝛼)𝑡𝑝0 So,
𝛼 = 1 − 𝑟1⁄𝑡 (7)
Where α is the annual percentage change, also known as the cessation rate. In the case of the status quo model, the cessation rate has been estimated from a regression model (section 2.7.1). So now, with a declining status quo trend and an intervention, let us define the annual intervention effect as 𝛼𝐼 and the annual status quo trend term as 𝛼. Then, a single year's change in smoking prevalence, from year j to year j+1, can be calculated as
𝑝𝑗+1= (1 − 𝛼𝐼)(1 − 𝛼)𝑝𝑗 An intervention applied to a starting prevalence over t years would be,
𝑝𝑡 = (1 − 𝛼𝐼)𝑡(1 − 𝛼)𝑡𝑝0 Rewrite the equation,
33
𝑝𝑡 = [(1 − 𝛼𝐼)(1 − 𝛼)]𝑡𝑝0 Expand the terms in the square brackets,
(1 − 𝛼𝐼)(1 − 𝛼) = 1 − 𝛼𝐼− 𝛼 + 𝛼𝐼𝛼 ≈ 1 − (𝛼𝐼+ 𝛼)
Provided that the annual percentage changes (𝛼 𝑎𝑛𝑑 𝛼𝐼) are small, so 𝛼𝐼𝛼 would be very small and negligible. Therefore, the cessation rate of the intervention model is the summation of cessation rate for the status quo (α) and the annual intervention effect (𝛼𝐼). 𝛼𝐼 can be deduced by inserting equation (6) into equation (7), 𝛼𝐼 = 1 − 𝑟 1 𝑡 ⁄ 𝛼𝐼= 1 − (1 − 𝐸𝑆) 1 𝑡 ⁄
For example, given that the effect size of P is 12.5% (from Levy et al. 2018), the annual P intervention effect over a 40-year horizon is
𝛼𝐼 = 1 − (1 − 0.125) 1
40 ⁄
𝛼𝐼 = 0.0033
Then, given that the cessation rate of male 20-29 age group from status quo model is 0.0372 (from section 2.7.1 regression model), the cessation rate of male 20-29 age group under full P intervention is (𝛼𝐼+ 𝛼)= 0.0033 + 0.0372 = 0.0405.
2.7.3. Net cessation rate of combined MPOWER model
For the combined MPOWER model, the cessation rate is obtained by multiplying the separate terms together. So, the cessation rate for the combined MPOWER model is
(1 − 𝛼) ∏(1 − 𝛼𝐼) 6
𝐼=1
Again, under the condition that all annual percentage terms are very small and 𝛼𝐼𝛼 would be very small and negligible. The equation (8) can also be expressed approximately by
34
1 − ∑ 𝛼𝑘 6
𝑘=0
where k=0 corresponds to the status quo cessation rate (𝛼) and k=1,2, …, 6 corresponds to each full intervention.
35
Table 4: Summary table of age- and sex-specific cessation rates used in models.
P
O
W(L)
W(MM)
E
R
Combined MPOWER
Effect size
12.50%
5.00%
8.33%
9.00%
6.00%
20-29: 15%,
30-39: 10%,
>40: 5%
-
Age
group
Status
quo
cessation
rate (α)
Annual intervention effect (α
i)
0.0033
0.0013
0.0022
0.0024
0.0015
20-29: 0.0041,
30-39: 0.0026,
>40: 0.0013
-
Cessation rate of full intervention model (α+α
i)
(α+α
i1+α
i2+α
i3+α
i4+α
i5+α
i6)
M
al
e
20-29
0.0372
0.0405
0.0385
0.0394
0.0396
0.0387
0.0413
0.0519
30-39
0.0219
0.0252
0.0232
0.0241
0.0243
0.0234
0.0245
0.0352
40-49
0.0215
0.0248
0.0228
0.0237
0.0239
0.0230
0.0228
0.0335
50-59
0.0212
0.0245
0.0225
0.0234
0.0236
0.0227
0.0225
0.0332
60-69
0.0176
0.0209
0.0189
0.0198
0.0200
0.0191
0.0189
0.0296
70+
0.0447
0.0480
0.0460
0.0469
0.0471
0.0462
0.0460
0.0567
Fem
al
e
20-29
0.0567
0.0600
0.0580
0.0589
0.0591
0.0582
0.0608
0.0714
30-39
0.0346
0.0379
0.0359
0.0368
0.0370
0.0361
0.0372
0.0479
40-49
0.0058
0.0091
0.0071
0.0080
0.0082
0.0073
0.0071
0.0178
50-59
0
0.0033
0.0013
0.0022
0.0024
0.0015
0.0013
0.0120
60-69
0
0.0033
0.0013
0.0022
0.0024
0.0015
0.0013
0.0120
70+
0.0228
0.0261
0.0241
0.0250
0.0252
0.0243
0.0241
0.0348
36
2.8. Lung cancer mortality rate
Because lung cancer is a major mortality consequence of smoking, I modeled lung cancer mortality as a sub-analysis of all-cause mortality. The proportion of lung cancer mortality relative to all-cause mortality was consistent in recent years, so I used this proportion to predict the lung cancer mortality rate from total mortality. In this model, it was assumed that this proportion is constant until 2100.
Let xc be the proportion of lung cancer mortality relative to all-cause mortality from current
smokers, 𝑥𝑐 = 𝐷𝑒𝑎𝑡ℎ𝑙𝑢𝑛𝑔,𝑐 𝐷𝑒𝑎𝑡ℎ𝑎𝑙𝑙𝑐𝑎𝑢𝑠𝑒,𝑐= 𝐷𝑒𝑎𝑡ℎ𝑙𝑢𝑛𝑔,𝑐 𝑃𝑜𝑝𝑐 𝐷𝑒𝑎𝑡ℎ𝑎𝑙𝑙𝑐𝑎𝑢𝑠𝑒,𝑐 𝑃𝑜𝑝𝑐 = 𝑀𝑅𝑙𝑢𝑛𝑔,𝑐 𝑀𝑅𝑎𝑙𝑙𝑐𝑎𝑢𝑠𝑒,𝑐 (8)
Equation 8 showed that the proportion of mortality cases equates to the proportion of mortality rate. The proportion for formers smokers (xf) and never smokers (xn) was deduced in a similar way. The
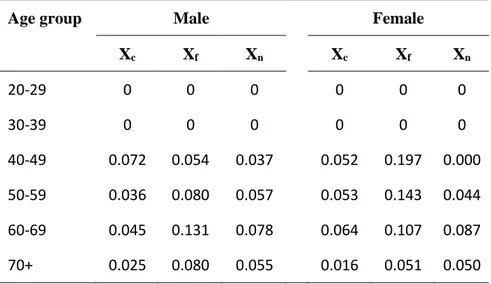
group-specific lung cancer mortality rates were adopted from a pooled analysis of three cohort studies[16,49]. Because the cohort studies did not include subjects less than 40 years old and tobacco-related lung cancer rarely occurred in individuals less than 40 years old, lung cancer mortality rates for 20-29 and 30-39 age groups were assumed to be 0. The group-specific all-cause mortality rates were deduced in section 2.3.2. These proportions were then applied to the all-cause mortality generated from the simulation models to obtain the number of lung cancer deaths. The proportions are summarized in Table 5.
37
Table 5: Summary table of group- and age-specific lung cancer mortality proportion.
Age group Male Female
Xc Xf Xn Xc Xf Xn 20-29 0 0 0 0 0 0 30-39 0 0 0 0 0 0 40-49 0.072 0.054 0.037 0.052 0.197 0.000 50-59 0.036 0.080 0.057 0.053 0.143 0.044 60-69 0.045 0.131 0.078 0.064 0.107 0.087 70+ 0.025 0.080 0.055 0.016 0.051 0.050
2.9. Averted death calculation
Averted death is the difference between the number of deaths from the status quo scenario and policy intervention scenario. The deaths from current, former, and never smokers were all included in calculating the total number of deaths. A positive value for averted death indicates fewer deaths in the policy scenario than the status quo scenario.
38
3. RESULTS
3.1. Smoking prevalence under the status quo scenario
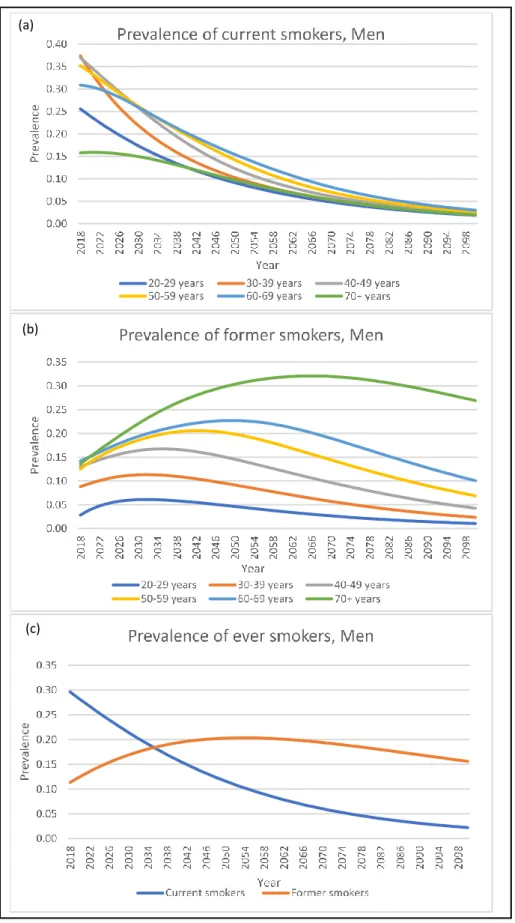
Under the status quo scenario, even without additional intervention policies, the male smoking prevalence continues on a downward trend in all age groups. The male smoking prevalence falls below 5% in all age groups at the end of 2100 (Figure 4a). The prevalence of male former smokers in all age groups increases for several years or decades before it starts decreasing (Figure 4b). The prevalence of former smokers in all age groups, except for the 70+ years old age group, falls below 10% at the end of 2100. When combining all age groups, the smoking prevalence fall steadily falls from 29.6% in 2018 to 0.7% in 2100. In contrast, the prevalence of former smokers rises from 11.3% and peaks at 23.5% in 2050 before falling to 15.5% in 2100 (Figure 4c).
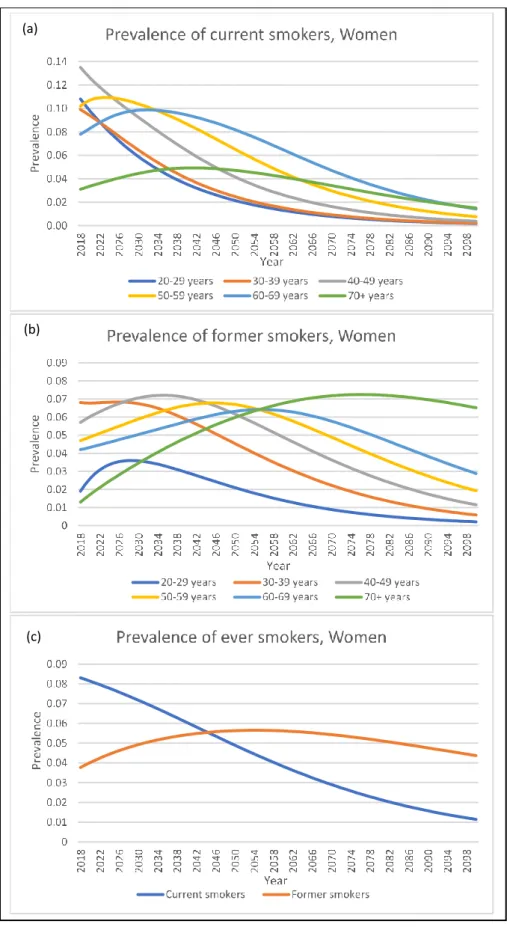
In general, women have lower prevalence of current and former smokers than men. The female smoking prevalence falls below 2% in all age groups at the end of 2100 (Figure 5a). The smoking prevalence of younger age groups (<50 years old) shows a continuous downward trend, whereas the prevalence increases slightly before falling again in the older age groups (>50 years old). The prevalence of female former smokers increases slightly before falling to less than 7% at the end of 2100 in all age groups (Figure 5b). When combining all age groups, the prevalence of current smokers falls continuously from 8.3% in 2018 to 0.4% in 2100, whereas the prevalence of former smokers rises from 3.7%, peaks at 7.0% in 2053 before falling to 4.8% in 2100 (Figure 5c).
There were more current smokers in both sexes than former smokers at the beginning of 2018 but ended with more former smokers than current smokers at the end of 2100. (Figure 4c and 5c).
39
Figure 4: Projection of smoking prevalence among men under the status quo. (a)Prevalence of current smokers; (b) Prevalence of former smokers; (c) Prevalence of ever smokers.
(a)
(b)
40
Figure 5: Projection of smoking prevalence among women under the status quo. (a)Prevalence of current smokers; (b) Prevalence of former smokers; (c) Prevalence of ever smokers.
(a)
(b)
41
3.2. Smoking prevalence under different policy scenarios
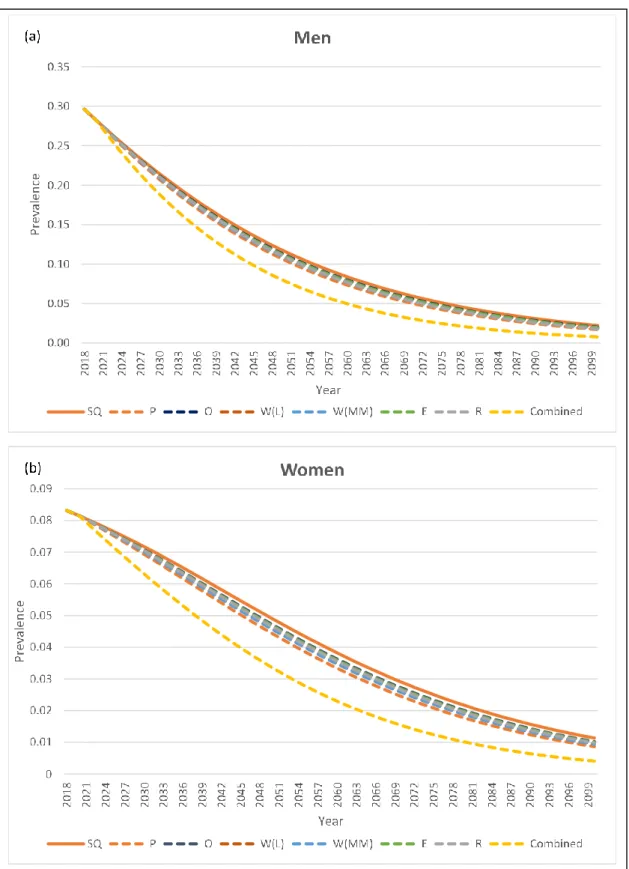
The effect of different policy scenarios on smoking prevalence is shown in Figure 6. Smoking prevalence is projected to have a downward trend in both sexes, even without scaling up any MPOWER interventions. Among the individual policy scenarios, enhanced public smoke-free policy (P) achieved the biggest prevalence drop, followed by raising taxes (R), mass media campaigns (W(MM)), warning labels (W(L)), advertising and promotion bans, and offering cessation services (O). The projected male smoking prevalence by 2100 is 2.2%, 1.7–2.0% and 0.7% under the status quo, individual MPOWER and combined MPOWER scenarios, respectively. In the female model, the projected prevalence in 2100 is 1.1%, 0.8–1.0% and 0.4% under the status quo, individual MPOWER and combined MPOWER scenario, respectively.
The differences are more noticeable in the combined MPOWER scenario, where the prevalence declines lower and faster. It requires 17 years to achieve 50% relative reduction from baseline prevalence in men with the implementation of combined MPOWER measure, compared to 24 years in the status quo (7 years shorter). In the female model, combined MPOWER policy takes 25 years to reduce baseline prevalence by 50%, compared to 40 years in the status quo scenario (15 years shorter). With the combined MPOWER policy intervention, Japan is expected to see male smoking prevalence drop to 5% in 2060, 16 years faster than the status quo scenario; female smoking will drop to 1% in 2081, 20 years faster than the status quo scenario.
42
Figure 6: Projection of smoking prevalence up to 2100 under different policy scenarios.
SQ, status quo; P, smoke-free law; O, offer cessation service; W(L), warning on label; W(MM), warning through mass media; E, advertising bans; R, raise tax; combined, combined all policies.
43
3.3. Averted deaths from different policy scenarios
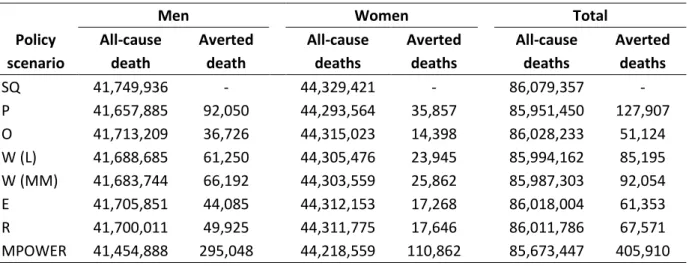
Averted deaths is the number of preventable deaths should there be a policy intervention instead of the status quo. As shown in Table 6, all intervention policy scenarios result in fewer all-cause deaths than the status quo scenario. In other words, all intervention policies are effective in preventing deaths from tobacco smoking. Scaling up any one of the individual MPOWER measures helps prevent as many as 127,907 deaths with smoking free (P) policy or as few as 51,124 deaths with the offering cessation (O) policy. If all MPOWER measures were to be implemented at the highest level, Japan would be able to prevent a total of 405,910 all-cause deaths (295,048 from men and 110,863 from women) in the coming 80 years. The combined MPOWER policy is the most effective; it can prevent 3 – 8 times more deaths than any individual MPOWER policy.
The number of averted all-cause deaths includes the deaths from lung cancer. Under the combined MPOWER scenario, 59,349 (14.6%) of the total averted all-cause deaths are attributable to lung cancer, that is, 51,441 averted deaths from men and 7,908 averted deaths from women (Table 7).
Figure 7 plots the number of averted all-cause and lung cancer deaths in a single graph to illustrate the difference between the two sexes and the proportion of lung cancer deaths in all-cause deaths. On average, the averted lung cancer deaths comprised 17.4% of all-cause averted deaths in men and 6.8-8.1% in women. There are more averted deaths in men than women, regardless of all-cause or lung cancer deaths (Table 6 and 7).
44
Table 6: Averted all-cause deaths from different policy scenarios (2018–2100).
Men Women Total
Policy scenario All-cause death Averted death All-cause deaths Averted deaths All-cause deaths Averted deaths SQ 41,749,936 - 44,329,421 - 86,079,357 - P 41,657,885 92,050 44,293,564 35,857 85,951,450 127,907 O 41,713,209 36,726 44,315,023 14,398 86,028,233 51,124 W (L) 41,688,685 61,250 44,305,476 23,945 85,994,162 85,195 W (MM) 41,683,744 66,192 44,303,559 25,862 85,987,303 92,054 E 41,705,851 44,085 44,312,153 17,268 86,018,004 61,353 R 41,700,011 49,925 44,311,775 17,646 86,011,786 67,571 MPOWER 41,454,888 295,048 44,218,559 110,862 85,673,447 405,910
Table 7: Averted lung cancer deaths from different policy scenarios (2018–2100).
Men Women Total
Policy scenario Lung cancer death Averted death Lung cancer death Averted deaths Lung cancer death Averted deaths SQ 1,842,142 - 988,872 - 2,831,014 - P 1,826,104 16,038 986,418 2,454 2,812,522 18,492 O 1,835,746 6,396 987,891 981 2,823,637 7,377 W (L) 1,831,473 10,669 987,238 1,635 2,818,711 12,304 W (MM) 1,830,612 11,530 987,106 1,766 2,817,718 13,296 E 1,834,464 7,678 987,695 1,177 2,822,159 8,855 R 1,833,513 8,629 987,449 1,423 2,820,962 10,052 MPOWER 1,790,701 51,441 980,965 7,908 2,771,666 59,349
45
Figure 7: Averted all-cause and lung cancer deaths from different policy scenarios (2018–2100). P, smoke-free law; O, offer cessation service; W(L), warning on label; W(MM), warning through mass media; E, advertising bans; R, raise tax; Combined, combined all policies; LungCa, lung cancer; Non-LungCa, non-lung cancer.
3.4. Effect of combined MPOWER policy
The effect of combined MPOWER policy is described in more detail because it is the largest among all policy interventions (Figure 7). Figure 8 shows that the same policy has different effects on men and women; the cumulative number of averted deaths is almost three times higher in men. In the male model, the policy will avert the first 100,000 deaths by 2045 (i.e., 25 years after implementing policy), 200,000 deaths by 2065, and almost 300,000 deaths by 2100; the female model only achieves the first 100,000 averted deaths in 2090 (i.e., 70 years after implementing policy). The policy averts more deaths in men and the time taken to achieve a certain number of averted deaths is also shorter in the male model.
When analyzing the number of averted deaths per year, the male and female models follow a
50,000 100,000 150,000 200,000 250,000 300,000 350,000
P
O
W(L)
W(MM)
E
R
Combined
N u m b er o f a ve rted d eat h s Policy scenario46
similar pattern, the difference is only the magnitude and the time taken for averted deaths to peak (Figure 9). The key driver of averted deaths in both sexes is the averted deaths that occurred in the 70+ years old age group. The averted deaths in the 70+ age group comprised 81.7% of total averted deaths in men; the proportion is higher in women, at 93.8%. The number of total averted deaths per year increases for a few decades before gradually decreasing. In men, it peaks at 5628 cases per year in 2043 (i.e., 23 years after implementing policy); in women, it peaks at 1962 cases per year in 2055 (i.e., 35 years after implementing policy). Compared to the 70+ age group, the younger age groups contribute relatively little to the number of averted deaths. The 20-29, 30-39, and 40-49 age groups among men contribute less than 100 averted deaths per year while all the below 70 years old age groups in women have less than 100 averted deaths per year (Figure 10).
Figure 8: Cumulative deaths over 80 years under the combined MPOWER policy scenario (2018-2100). 50,000 100,000 150,000 200,000 250,000 300,000 350,000 400,000 450,000 2018 2021 2024 2027 2030 2033 2036 2039 2042 2045 2048 2051 2054 2057 2060 2063 2066 2069 2072 2075 2078 2081 2084 2087 2090 2093 2096 2099 CU m u lat iv e d eat h s Year
47
Figure 9: Total averted deaths and averted deaths from 70+ age group only.
0 1000 2000 3000 4000 5000 6000 7000 8000 2018 2021 2024 2027 2030 2033 2036 2039 2042 2045 2048 2051 2054 2057 2060 2063 2066 2069 2072 2075 2078 2081 2084 2087 2090 2093 2096 2099 N u m b er o f a ve rted d eat h s Year
48
Figure 10: Averted deaths from age groups below 70 years old. (a) Men; (b) Women.
0 100 200 300 400 500 600 700 800 2018 2021 2024 2027 2030 2033 2036 2039 2042 2045 2048 2051 2054 2057 2060 2063 2066 2069 2072 2075 2078 2081 2084 2087 2090 2093 2096 2099 N u m b er o f a ve ted d eat h Year
Men
20-29 years 30-39 years 40-49 years 50-59 years 60-69 years
(a) 0 10 20 30 40 50 60 70 80 90 100 2018 2021 2024 2027 2030 2033 2036 2039 2042 2045 2048 2051 2054 2057 2060 2063 2066 2069 2072 2075 2078 2081 2084 2087 2090 2093 2096 2099 N u m b er o f a ve rted d eat h s Year
Women
20-29 years 30-39 years 40-49 years 50-59 years 60-69 years