Energy
Systems
Copyright © 2013 by JSME
Attachment of Tripping Wires to Enhance the
Efficiency of a Vortex-Induced Vibrations
Department of Systems Design for Ocean-Space, Faculty of Engineering, Yokohama National University
79-5 Tokiwadai, Hodogaya-ku, Yokohama, Japan E-mail: luis.quadrante@gmail.com
Abstract
extraction from a constant flow that can be obtained by attaching a pair of tripping wires to an elastically mounted cylinder under influence of vortex-induced vibrations. Free oscillation tests were carried with three different cylinder configurations: smooth, with tripping wires positioned at angular positions equal to 60o and 75o. The Reynolds number varied from 2.9×10³ to 2.2×10⁴. We measured the amplitude of oscillation and the output voltage to calculate the power generated and conversion efficiency. The maximum power generation occurred when tripping wires were positioned at 60o and reduced velocity was 12, but only a 2.88% efficiency was achieved at this case. The maximum efficiency obtained was 12.47% and occurred when tripping wires were positioned at 75o, with reduced velocity 6.5. The maximum efficiency with tripping wires attached was about four times larger than the maximum efficiency obtained on smooth cylinder case. The presence of tripping wires also widen the lock-in region and when they were placed at 75o an almost constant power generation was obtained within reduced velocity ranging from 6 to 8.5, meaning that it is possible to design a system that generates the same amount of power even with variations on flow speed.
Key words: Vortex-Induced Vibrations, Renewable Energy, Tripping Wires, Energy Harvesting, Circular Cylinder
Nomenclature
Symbol Definition Value and Unit
A Non-dimensional amplitude of oscillation [-]
Apeak Displacement signal peak amplitudes [m]
d Tripping wires diameter [m]
D Cylinder diameter [m]
E Generated Voltage [Volt]
fn System natural frequency of oscillation [Hz]
fosc Frequency of oscillation [Hz]
fs Frequency of vortex-shedding [Hz]
L Cylinder length [m]
m System oscillating mass [kg]
m* Mass ratio L D m m 4 * 2 [-]
P Electric power generated [kg m2 s-3]
Re Reynolds Number [-]
Energy Generation System
*
Luis A. R. QUADRANTE** and Yoshiki NISHI**
**We conducted an experiment to quantify the increase in efficiency of energy
*Received 16 Apr., 2013 (No. 13-00019)
162 [DOI: 10.1299/jpes.7.162]
TE End time of analysis [s]
TS Start time of analysis [s]
V Flow speed [m/s] VR Reduced velocity f D V V n R [-]
Wwater Power of fluid flow [kg m2 s-3]
Tripping wires angular position [degrees]
F Difference of phase between L and Z [degrees]
L Phase of lift force [degrees]
Z Phase of cylinder vertical displacement [degrees]
Energy conversion efficiency [-]
Gap between cylinder and tripping wire [m]
1. Introduction
The world’s energy supply is hardly dependent of fossil fuels. The World Energy Outlook 2007 predicted that coal, oil and gas will be responsible to meet 84% of energy demand in 2030 and it is of common knowledge that these non-renewable sources will deplete in a near future, however it is not a consensus when it will happens because lots of efforts have been made to delay it. The search for new oil fields is constant, as well the development of new drilling and extraction techniques to increase the volume of recovered oil. In parallel, the energy conversion efficiency of existing systems is being improved and renewable energy sources are being developed. The latest World Energy Outlook, released in 2012, estimates that is necessary to invest 4.8 trillion US dollars on the development of renewable energy systems until 2035 to meet the demand increase.
A promising source of renewable energy is the ocean. There are two basic principles on producing energy from it that are usually broached. The first one is thermal and relies on the difference of temperature between the surface and deep water. The warm water on the surface is used to vaporize a fluid, which has a low boiling point, and the vapor expansion turns a turbine that is connected to a generator, producing electricity. Then the vapor is directed deep into the ocean where it condenses, re-starting the cycle. The second one consists on using the mechanical energy of tides and waves. It is based on the principle that a floating body moves up and down under effect of tides and waves. The body is connected to a linear type generator that converts its vertical motion in electricity, but this kind of generation can be intermittent as depends of weather conditions.
There is a third potential source of energy on the oceans that is not explored: the currents. The main reason is because ocean currents have low speeds, usually less than 1.0 m/s at water surface, and it is not efficient to use turbine type generators at such low speed. Recently, a group of researches of Michigan University developed a system called VIVACE(1) (Vortex-Induced Vibration Aquatic Clean Energy) that consists of an elastically mounted cylinder that is submerged on water and connected to a generator. Their system takes advantage of a phenomenon called vortex-induced vibrations to extract energy from a flow.
Vortex-induced vibrations are the result of vortex shedding that occurs on a bluff body under influence of a steady flow. The vortex shedding process induces periodic forces on the body which can result in motions. The motions are perpendicular to the flow direction and are self-excited when the vortex-shedding frequency and system natural frequency are approximately the same. The vortex shedding frequency can be predicted using the Strouhal number equation:
V D f
St s (1)
The strouhal number of a circular cylinder is well known and is almost constant around 0.21, at Reynolds numbers greater than 1×10³. Once known the vortex shedding frequency it is only necessary to set the system natural frequency equal to the vortex shedding frequency to obtain motions on the cylinder. There are other factors that influence the amplitudes of oscillation, as system damping and mass ratios(2) and Reynolds number(3), but further discussion if out of the current work scope.
Following VIVACE(1) steps, Nishi et al.(4) developed a system that utilizes the vortex-induced vibrations of a cylinder and principle of leverage. Their system transforms the translation motion of the VIV into a translation motion of the generator as shown in Fig. 1. The aim of their work was to improve the system efficiency by tuning the distance between the pivot and the generator, changing the relation between the cylinder motion and coil motion.
Fig. 1: Schematic view of the energy generation system using VIV and principle of leverage.
The efficiency of energy conversion using vortex induced vibration systems needs to be improved. VIVACE(1), the most efficient system reported until now, achieves only 22%. The search of a technique to improve the conversion efficiency led to study the work of researches(5)-(10) who have studied the addition of attachments to the cylinder in order to change the flow characteristics.
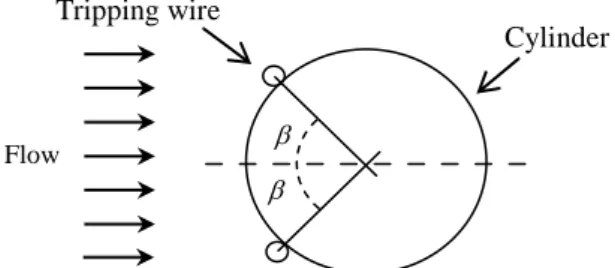
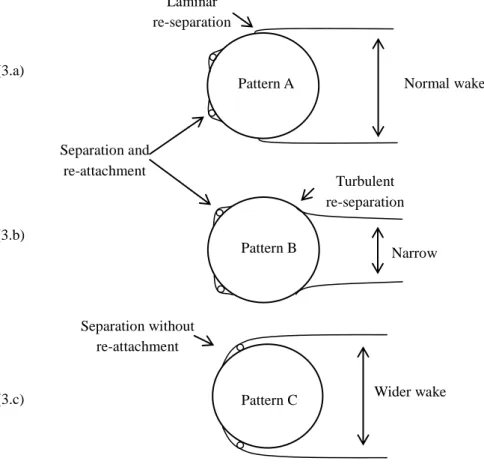
Igarashi(5) and Nebres and Batil(6) concentrated efforts on measuring hydrodynamic forces and strouhal number of cylinders with tripping wires attached at angular positions , defined in Fig. 2. They found three flow patterns, shown in Fig. 3, which are dependent of Reynolds Number and tripping wire diameter and angular position. The first pattern (A), shown in Fig. 3.a, is characterized by a separation over tripping wire, an immediately reattachment behind it and a posterior laminar re-separation, not causing changes on drag coefficients. The second pattern (B), shown in Fig. 3.b, has as main characteristic a separation over the tripping wire, a reattachment behind it and a turbulent re-separation that occurs more downstream than the smooth cylinder case, resulting in a narrow wake region and, consequently, lower drag coefficients than smooth cylinder. The third and last pattern (C), shown in Fig. 3.c, is characterized by a completely separation over the tripping wire, resulting in a wider wake region. The widening on the wake region led to the formation of larger vortexes behind the cylinder, which in turn led to larger pressure fluctuations and, consequently, larger drag and lift forces.
Fig. 2: Tripping wire angular positioning definition. Pivot Generator VIV Flow Cylinder Tripping wire Flow 164
Alam et al.(7) and Quadrante and Nishi(8) studied the effects of a pair of tripping wires positioned symmetrically in relation to the stagnation point. Alam et al.(7) focused the reduction of drag and lift forces acting on a non-oscillating cylinder with tripping wires positioned within 20o < < 60o. The comparison between tripping wires and smooth cylinder cases showed two distinct regions. They found that when 20o < < 40o the forces acting on the cylinder decreased but, when 50o < < 60o, the forces increased. They also confirmed the flow patterns B and C described previously as the cause of the decrease and increase of forces, respectively. Quadrante and Nishi(8) expanded tripping wires positioning range to 15o < < 90o to obtain more data about the increase on forces and included free oscillating tests to obtain VIV response with tripping wires. They found large increase on forces and VIV amplitudes when = 60o and = 75o. As the experimental apparatus of their work and the present work are basically the same their results are of great relevance, then a revised data analysis of their experiments is presented briefly in a subsequent section.
(3.a)
(3.b)
(3.c) P
Fig. 3: Flow patterns related to tripping wires position. (a) Pattern A, (b) Pattern B, (c) Pattern C.
The present study has the objective of combining Nishi et al.(4) and Quadrante and Nishi(8) studies to achieve a more efficient system by exploring the effects present on pattern C which causes larger fluid forces on the cylinder. To induce the occurrence of pattern C a pair of tripping wires was attached to the cylinder at 60o and 75o and free oscillation tests were carried out to measure the amplitude of oscillation, the forces and the voltage generated. The results were compared with smooth cylinder case to quantify tripping wires contribution to system efficiency. The next two sections contain a brief description of the mathematical model behind the principle of leverage and a revision of tripping wires effects on VIV response obtained by Quadrante and Nishi(8). They are followed by the description of current experimental setup, the presentation of results and the
Wider wake Separation without re-attachment Separation and re-attachment Narrow wake Laminar re-separation Turbulent re-separation Normal wake Pattern A Pattern B Pattern C
discussion.
2. Mathematical model
Table one contains the variables and parameters pertinent to the mathematical model. The leverage system is represented by a single rigid bar that rotates around a pivot, as shown on Fig. 4. Fluid force from VIV and electromagnetic reaction forces are applied at distances r2 and r3, respectively, from the pivot, while spring restoring force is applied at distance r1. The dynamic equation of the system is written as:
θ r F Mgr r F kr k C
I sin cos L 2cos 3cos m3cos
2 1 (2)
Fig. 4: System modeled as a single rigid bar.
The voltage generated on the generator is proportional to the velocity of the coil’s translation motion and can be written as:
r3cos
E (3)
Where is the constant of proportionality obtained experimentally. The electromagnetic reaction force is:
cos 3 R N r m Fm b (4)
By solving the equation of motion and considering the frequency of lift force equal to the system’s natural frequency it is possible to obtain the equation of maximum generated voltage: 2 3 3 2 max r r R N m r r C F E b L (5)
Table 1: Parameters and variables pertinent to numerical model
Symbol Definition Value
C Damping coefficient 2 Ik[kg m s-1]
FL Amplitude of lift force - [N]
Fm Electromagnet reaction force - [N]
g Gravity acceleration 9.81 [kg m s-2]
I Moment of Inertia of the bar and coil 2
3 48 . 0 Mr [kg m2] k Spring stiffness 540 [N m-1]
Coil length 0.043 [m]mb Magnet bar coefficient 0.637×10⁻³ [Wb]
M Coil mass 0.548 [kg]
N Total number of turns of the coil 2000
R Resistor connected to the generator 100 [Ω]
FL pivot Mg Fm k r3 r2 r1 166
r1 Distance between pivot and spring 0.5 [m]
r2 Distance between pivot and cylinder 0.5 [m]
r3 Distance between pivot and generator variable [m]
Empirical coefficient 29.76 [V s m-1]
Damping ratio 0.079 [-]
Angular position of the bar - [rad]
3. Tripping wires effects
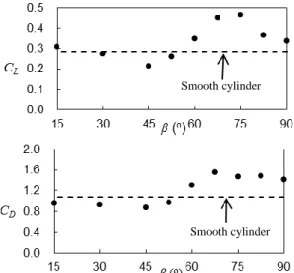
A revised data analysis of Quadrante and Nishi(8) experiments with tripping wires is presented on this section. They conducted non-oscillating tests with a low mass and damping ratios system (m*=6.94 and =0.016, respectively) to determine the position of maximum increase on lift coefficient and chose two cases to use on free oscillating tests. Figure 5 shows lift and drag coefficients obtained from non-oscillating tests in function of tripping wires angular position. The maximum lift and drag coefficients occur when = 75o and are, respectively, 65% and 44% larger than smooth cylinder case.
Fig. 5: Lift and drag coefficients of a non-oscillating cylinder in function of tripping wires position (Quadrante and Nishi(8))
Figure 6 shows the amplitude and frequency responses obtained from free oscillating tests. The presence of tripping wires widen the lock-in region and results in a monotonically increase of VIV amplitude with respect to reduced velocity when positioning tripping wires at = 60o and = 75o. A similar behavior was obtained by Raghavan and Bernitsas(9) using roughness strips instead of tripping wires and is attributed to the transition of the flow around the cylinder to pattern C described by Igarashi(5) and Nebres and Batil(6).
4. Experiment
4.1 Experimental arrangement
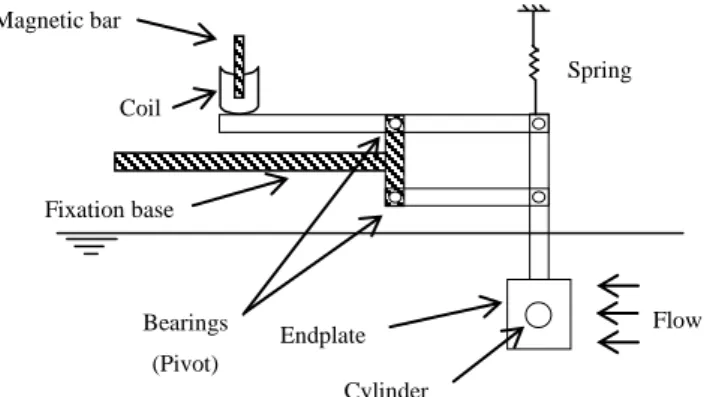
The experiments were conducted in a 100m long, 8m wide and 3.5m depth towing tank at Yokohama National University. The system arrangement, presented in Fig. 7, was built of aluminum bars connected by bearings. Its construction guarantees an almost perpendicular movement of the cylinder as the arm length measures 0.5m and the maximum vertical oscillation expected is 0.025m. The cylinder motion can be approximated as a pure translation motion in vertical direction as the maximum horizontal excursion expected is 6.25×10⁻⁴ m, much smaller than the vertical.
Smooth cylinder
Fig. 6: VIV amplitude and frequency response for free-oscillating tests. Symbols: (○) smooth cylinder, (□) tripping wires at β = 60o, (▲) tripping wires at β = 75o. (Quadrante and Nishi(8))
The cylinder also was built of aluminum with external diameter D = 0.025m and length L = 0.454m. It was supported by four springs in parallel, resulting in stiffness k = 540N/m. Two bi-axial load cells were equipped at cylinder ends to measure the drag and lift forces acting on it. To measure the vertical motion, a laser displacement sensor was positioned right over the cylinder. Acrylic endplates were attached to cylinder extremities in order to avoid end effects and ensure a two-dimensional flow.
The tripping wires in this study were the same used by Quadrante and Nishi(8) and a schematic view of their positioning around the cylinder is shown in Fig. 8. They are placed symmetrically in relation to the stagnation point at angular positions . The diameter d = 0.003m results in a diameter ratio d/D= 0.12. The gap between tripping wires and cylinder surfaces were equal to 0.0025, resulting in a gap ratio /D= 0.1.
Fig 7: Schematic view of experiment apparatus. (Dashed shapes represent the non-movable parts of the system).
The electricity generator attached to the system is composed of a fixed magnetic bar and a moving coil. A 100 resistor is connected to the generator to act as a load and the voltage on it is measured. Flow Cylinder Endplate Spring Bearings (Pivot) Magnetic bar Coil Fixation base 168
4.2 Methodology
Free oscillation tests were carried out with and without tripping wires to compare amplitude response and generated voltage with nine different configurations which are combinations of three cylinder characteristics (smooth cylinder, tripping wires at = 60o and = 75o) and three generator positions (r3/r2 = 0.9, 1.0 and 1.1). The relation r3/r2 tested
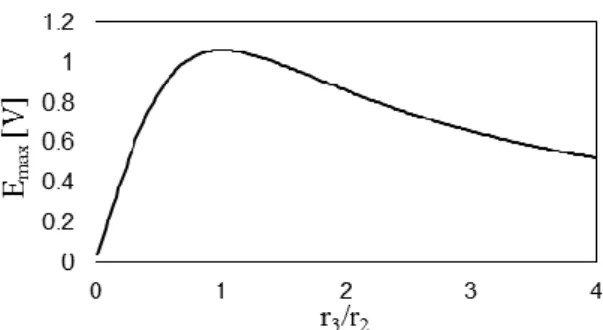
was determined by substituting the system parameters in Eq. 5 and varying r3 to create a
maximum voltage response in function of r3.The result is shown in Fig. 9, from which is possible to note that the maximum voltage is obtained when r3 = r2.
Fig 8: Tripping wires positioning
Fig 9: Theoretical maximum voltage response in function of r3/r2.
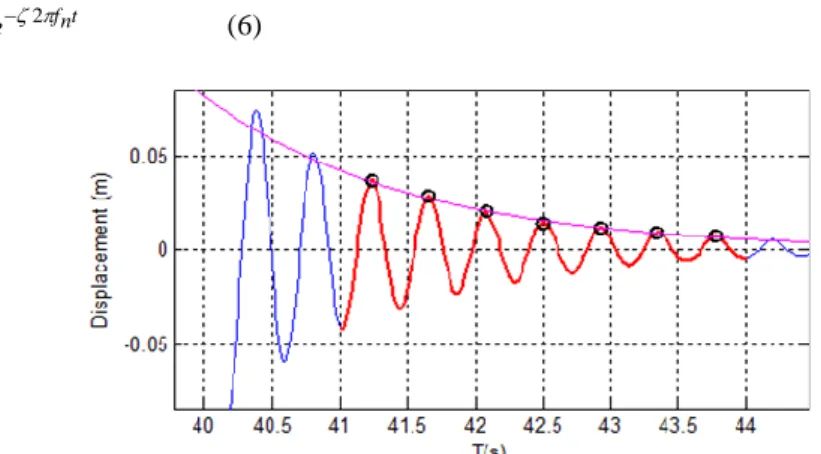
The damping ratio () of the system is composed by the structural damping (structural = 0.010), measured without the magnet positioned inside the coil, and the generator damping (0.038 ≤ generator ≤ 0.042), calculated by subtracting the structural damping from the total damping ratio, which was obtained from free-decay tests with the 100 resistor attached to the generator. Figure 10 contains one example of the free-decay tests signal with the exponential curve (Eq. 6) adjusted to the selected peaks from the signal. The value of used to the best adjustment of the equation is the damping ratio of the system. The linear approximation shows a good agreement with the signal inside the selected region, in red. The selected region of the signal was made by considering the maximum amplitudes of oscillation expected of 0.025m.
The decay tests were also used to obtain the system natural frequency of oscillation in water. The natural frequency is essential to calculate the towing speed in order to cover the desired reduced velocity range, 2 < VR < 12, within vortex induced vibrations of circular cylinder are expected. Inside this reduced velocity range, Reynolds number varied by 2.9×10³ < Re < 2.2×10⁴. At least two repetitions of each reduced velocity for each case were made to check the repeatability of VIV response.
Cylinder D d Tripping wire Flow
t n f e Z Z 0 2 (6)
Fig 10: Free-decay test response with the exponential curve adjusted to the peaks
4.3 Summary of experiment parameters
All the system parameters that are related to the flow are summarized in table 2.
Table 2: Summary of flow related parameters.
Parameter Value and Unit
Cylinder diameter (D) 0.025 [m]
Cylinder Length (L) 0.454 [m]
Tripping wires diameter (d) 0.003 [m]
Range of Reynolds number (Re) 2.9×10³ < Re < 2.2×10⁴ [-] Range of reduced velocity 2 < VR < 12[-] 4.4 Data processing
We measured the drag and lift forces acting on each cylinder end, the towing carriage speed, the cylinder vertical displacement and the voltage at the resistor. The first step of data analysis was the zero adjustment and digital filtering of all signals, followed by the selection of the region for temporal and spectral analysis.
Total forces were obtained by the sum of forces measured by load cells. Drag coefficient was calculated using the average drag force (FD ) and the lift coefficient was calculated using the fluctuating lift force (FLrms) as follows:
2 2 DLV F C D D (7) 2 2 DLV F CL Lrms (8)
Non-dimensional amplitudes were calculated from the maximum absolute amplitudes (Apeaks) of cylinder displacement. A peak detection routine written in Matlab® was used to find all signal peaks and then compute the average of the peaks. The amplitude was normalized by the cylinder diameter as usual in VIV analysis as:
D A n A n i peaksn
1 1 (9)All signals dominant frequencies and respective phases were obtained through Fast Fourier Transform (FFT). The relative phase between the displacement and lift force (φF) is calculated as: Z L F (10) 170
Where φZ andφL denote the displacement and lift force phases, respectively. This definition of φF means that the lift force excites the vibration when φF ranges from 0 to 180o, while the lift force decays the vibration when φF ranges from -180o to 0o.
Energy conversion efficiency is calculated as the ratio between electrical power P and fluid flow power Wwater:
DL V dt R E T T W P E T S T S E 3 2 water 0.5 1
(11)5. Results
The three variations of r3/r2 presented similar results, with small variations in maximum amplitudes of VIV, voltage and generated power. As expected from Fig. 9, the maximum generated voltage was obtained for r3/r2 = 1.0 and for that reason we chosen this case to present in this section. A summary containing all the results, including r3/r2 = 0.9 and 1.1, will be presented on the end of this section.
5.1 VIV amplitude response
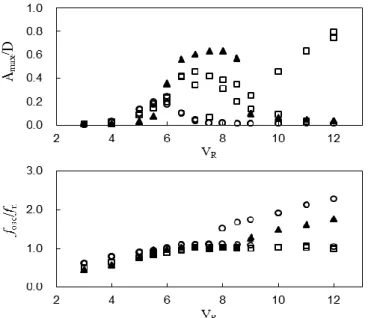
Figure 11 contains the VIV amplitude and frequency responses. Both cases with tripping wires present larger amplitudes and a wider lock-in region than smooth cylinder case. The maximum normalized amplitudes for = 75o and = 60o are, respectively, 0.63 and 0.74, however, for smooth cylinder case, it is only 0.23. The monotonically increase in amplitude related by Quadrante and Nishi(8) and presented in Fig. 6 can be observed on Fig. 11, but it occurred only when = 60o and VR ≥ 10 and, even then, not for all repetitions. For VR = 10 and 11 it is possible to see distinct responses, with one of the test runs presenting large amplitudes and the other one a near zero value.
The monotonically increase of amplitude present in Fig. 6 is related to a transition from VIV to galloping phenomenon, which occurs at higher reduced velocities than VIV. The galloping phenomenon is the result of wake instabilities which induce lift forces on the cylinder. The difference in the galloping response between Figs. 6 and 11 are associated to two factors: difference in the mass and damping ratios between experiments and the position of tripping wires.
Firstly the difference in mass and damping ratios will be discussed. The current experiment was carried with larger mass ratios (10.08 ≤ m* ≤ 11.28) and damping ratios (0.042 ≤ ≤ 0.052) than the presented by Quadrante and Nishi(8) (m*=6.94 and =0.016). The lower values in their experiments facilitate the occurrence of large galloping.
The second factor that contributes for galloping occurrence is the tripping wires position. Chang et al.(10) studied the effects of surface roughness in VIVACE(1) galloping response and found that systems with large mass and damping ratios are susceptible to galloping when the roughness is placed inside a critical range of angular positions, from 10o to 62o. Above 62o, the placement of roughness inhibited the galloping phenomena. This explains the non-existent galloping when tripping wires were placed at =75o. The unstable occurrence of galloping when tripping wires were at = 60o is result of the proximity to 62o limit observed by Chang et al. (10), which is a transition region.
The lock-in range, characterized by fosc/fn ≈ 1, also presents differences between the
three cases. Smooth cylinder and = 75o cases have a limited lock-in range while = 60o lock-in range starts at VR = 6.0 and extends until the maximum reduced velocity tested.
Fig. 11: Amplitude and frequency response of VIV. Symbols: (○) smooth cylinder, (□) tripping wires at β = 60o, (▲) tripping wires at β = 75o.
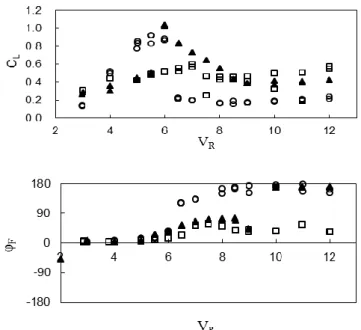
To understand the changes caused on amplitude and lock-in we analyzed the lift coefficients and the difference of phase between lift force and cylinder displacement (Eq. 10) shown in Fig. 12. To achieve large amplitude response a favorable combination of lift force and phase difference is necessary. According to the definition in Eq. 10, a phase difference equal to 90o means that the lift force acts in a purely excitation rule. It means that as near the difference of phase is to 90o more efficiently the force excites the system and larger amplitudes of oscillation can be expected.
Smooth cylinder case presents lower lift coefficients than tripping wires cases, except at the region between reduced velocities 4.0 and 5.5 within it achieved almost the same maximum coefficient than = 75o case. However, even these large lift coefficients were not translated into high amplitudes because the phase difference is around 30o. If we compare the smooth cylinder to the lock-in region (6 ≤ VR ≤ 8.5) of the case with tripping wires at
75o it is noticeable the rule of the phase difference on VIV response. This case has similar maximum lift coefficients than the smooth cylinder, but the oscillation amplitudes achieved were more than three times larger than the smooth cylinder case, just because the difference of phase is around 70o.
The same principle can be used to explain the lower amplitudes achieved when tripping wires were positioned at = 60o than at = 75o. The lift coefficients for = 60o are slightly lower than the smooth cylinder, as well the phase, around 60o. The composition of smaller coefficients with a phase difference more distant from 90o led to smaller amplitude. The opposite occurred at reduced velocities larger than 9, when the case of = 60o presented much larger amplitudes than the = 75o case. Now, the lift coefficients are a little larger for = 60o and the phase difference stills around 60o, while the phase for = 75o shifted to near 180o.
5.2 Generated power and conversion efficiency
Generated power was calculated using the numerator of Eq. 11 and is shown in Fig. 13. The maximum electric power generated was 57.8mW and occurred on = 60o case at VR = 12. = 75o case also presented large electric power between reduced velocities 6.5 and 8.5, achieving up to 50.41mW. Smooth cylinder case had the lowest power generation, achieving a maximum of 4.86mW at VR = 6.0.
Fig. 12: Lift coefficients and difference of phase between lift force and cylinder vertical position. Symbols: (○) smooth cylinder, (□) tripping wires at β = 60o, (▲) tripping wires at β = 75o.
Figure 14 shows the efficiency in function of reduced velocity. = 75o case had the best performance, achieving a maximum efficiency = 12.41% at VR = 6.5, about 4 times the maximum efficiency obtained on smooth cylinder case. Although the maximum power generation occurred in = 60o case its efficiency is very low because the high flow speed involved.
Fig. 13: Electric power generated. Symbols: (○) smooth cylinder, (□) tripping wires at β = 60o, (▲) tripping wires at β = 75o.
Fig. 14: System conversion efficiency. Symbols: (○) smooth cylinder, (□) tripping wires at β = 60o, (▲) tripping wires at β = 75o.
5.3 Results summary
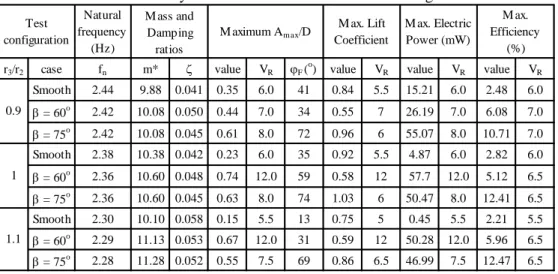
Table 3 contains a summary of all results obtained. The maximum amplitude response and electric power generated occur when r3/r2 = 1.0and = 60o, at VR = 12, but this case presents a low efficiency because the power of the flow is high at this speed. Smooth cylinder cases presented very small amplitude response and, consequently, low electric power generation and efficiency at all tested configurations. The most efficient case was = 75o, presenting values between 10.71% and 12.47%, at reduced velocities between 6 and 8.
From Table 3 is also possible to realize that the presence of large lift forces acting on the cylinder do not guarantee a high amplitude response. The phase difference between lift force and displacement also has an important influence since as near it is to 90o, larger will be the force contribution to excite the system VIV.
6. Discussion
The efficiency of energy generation systems using vortex-induced vibrations has been studied in a few works(1)(4). The main characteristics and results of previous and current works are listed in Table 4. VIVACE(1) is the best system developed until the present moment, achieving a 22% conversion efficiency, value much larger than obtained by Nishi et al.(4) and by the current experiment with smooth cylinder.
Table 3: Summary of results obtained for each test configuration. Natural
frequency (Hz)
r3/r2 case fn m* value VR F (o) value VR value VR value VR Smooth 2.44 9.88 0.041 0.35 6.0 41 0.84 5.5 15.21 6.0 2.48 6.0 = 60o 2.42 10.08 0.050 0.44 7.0 34 0.55 7 26.19 7.0 6.08 7.0 = 75o 2.42 10.08 0.045 0.61 8.0 72 0.96 6 55.07 8.0 10.71 7.0 Smooth 2.38 10.38 0.042 0.23 6.0 35 0.92 5.5 4.87 6.0 2.82 6.0 = 60o 2.36 10.60 0.048 0.74 12.0 59 0.58 12 57.7 12.0 5.12 6.5 = 75o 2.36 10.60 0.045 0.63 8.0 74 1.03 6 50.47 8.0 12.41 6.5 Smooth 2.30 10.10 0.058 0.15 5.5 13 0.75 5 0.45 5.5 2.21 5.5 = 60o 2.29 11.13 0.053 0.67 12.0 31 0.59 12 50.28 12.0 5.96 6.5 = 75o 2.28 11.28 0.052 0.55 7.5 69 0.86 6.5 46.99 7.5 12.47 6.5 M ax. Lift Coefficient M ax. Electric Power (mW) M ax. Efficiency (%) 0.9 1 1.1 M ass and Damping ratios Test
configuration M aximum Am ax/D
There are two main differences between the VIVACE(1) and the other two systems: the mass ratio and Reynolds number. Low mass ratio can increase the length of lock-in region, as discussed by Khalak and Williamson(2), but has small influence on amplitude response. On the other hand, variation of Reynolds number has large influence on response because the regime of vortex generation changes(3) as it increases. Nishi et al.(4) and the current experiment operates in lower Reynolds number, under TrSL2(11) (transition of shear layer 2) regime, which is a subcritical regime characterized by the formation of transition vortices in free shear layer. VIVACE(1) operates on TrSL3(11) regime, which also is a subcritical regime, but has a fully turbulent shear layer that results in larger fluid forces and amplitude response. The attachment of tripping wires to our system increased the lock-in range and amplitudes of oscillation without necessity of change on Reynolds number. It probably induced a transition from TrSL2 to TrSL3 regime even at lower Reynolds number, but it is not possible to confirm without obtaining the vortex pattern behind the cylinder.
The system efficiency had a significant increase on efficiency when = 75o. Moreover, the amplitude of oscillation and, consequently, the power generated had almost stabilized values within the lock-in range (6.0 ≤ VR ≤ 8.5). This characteristic is very important as it is
expected that the current speed suffer fluctuations along time and, with a large lock-in range, it is possible to tune the system to deal with these fluctuations to minimize downtime.
Table 4: Characteristics and efficiency of known energy generation systems that uses VIV.
Re m* (%) 9.4×10⁴ 1.45 0.059 22.00 5~7×10³ 12.68 0.023 4.50 Smooth 10.38 0.042 2.82 = 60o 10.08 0.050 6.08 = 75o 11.28 0.052 12.47 2.9~22×103 Current experiment Nishi et. al.
VIVACE Experiment
By observing Table 4 it is clear that lots of new configurations can be studied to search for a more efficient system. It is not possible to predict what will happen if tripping wires are attached to VIVACE, or what will happen if the current experiment is conducted at higher Reynolds numbers. Another points are that the generator of the current experiment is not optimized to work with the force increase resulted from the attachment of the tripping wires and there was no investigation of the effects of changing the load required form the generator in the system response. Changes in the load causes significant changes in the damping of the system and must be investigated.
Further research and experiments are necessary to clarify these questions and check the real potential of generating energy from a fluid flow using vortex-induced vibrations phenomenon.
7. Conclusion
This study carried out experiments about the attachment of a pair of tripping wires to the cylinder of an energy extraction system through vortex-induced vibrations and use principle of leverage to transmit the oscillations from the cylinder to the generator. We attached tripping wires at two different angular positions, = 60oand = 75o, and conducted free oscillating experiments to measure response amplitude and power generated to compare with smooth cylinder results.
We found that the presence of tripping wires widen the lock-in range and increased the amplitudes of oscillation and power generated significantly. At the best configuration, when = 75o, the system efficiency achieved = 12.47%, more than four times the efficiency obtained on smooth cylinder experiments, showing that the use of tripping wires has a great potential to be used to enhancement of vortex-induced vibrations.
References
(1) Bernitsas M. M., Raghavan K., Ben-Simon Y., Garcia E. M. H., VIVACE (Vortex-Induced Vibrations Aquatic Clean Energy): A new concept in generation of clean and renewable energy from fluid flow, Proceedings of the International OMAE Conference; and ASME transactions, JOMAE in press, 2007.
(2) Khalak A., Williamson C.H.K., Investigation of the relative effects of mass and damping in vortex-induced vibration of a circular cylinder. Journal of Wind Engineering and Industrial Aerodynamics (1997) 69-71, 341-350.
(3) Raghavan K., Bernitsas M. M., Maroulis D., Effect of Reynolds Number on Vortex Induced Vibrations, IUTAM Symposium 2007, Hamburg, Germany.
(4) Nishi Y., Ono K., Kokubun K., Development of a renewable energy system using vortex-induced vibration of a cylinder and principle of leverage aiming for application in deep sea, Journal of Marine Science and Technology, 17(3) (2012) 382-389.
(5) Igarashi T., Effect of tripping wires on the flow around a circular cylinder normal to an airstream. Bulletin of the Japan Society of Mechanical Engineers, 29 (1986), 2917–2924
(6) Nebres J., Batil S., Flow about a circular cylinder with a single large-scale surface perturbation. Experiments in Fluids 15 (1993), 369–379.
(7) Alam M. M., Moriya M., Sakamoto H., Reduction of fluid forces acting on a single circular cylinder and two circular cylinders by using tripping rods. Journal of Fluids and Structures 18 (2003), 347-366.
(8) Quadrante L. A. R., Nishi Y., Effects of tripping rods on the flow around a cylinder and VIV amplification, Hydroelasticity Conference 2012, Tokyo, Japan.
(9) Raghavan, K., Bernitsas, M. M., Enhancement of high damping VIV through roughness distribution for energy harnessing at 8×10³ < Re <1.5×10⁵. Proceedings of the International Conference on Offshore Mechanics and Artic Engineering – OMAE 2008, Lisbon.
(10) Chang, C.m Kumar, R. A., Bernitsas, M. M., 2011, VIV and galloping of a single circular cylinder with surface roughness at 3.0×10⁴≤Re≤1.2×10⁵. Ocean Engineering, Vol. 38, #16, pp. 1713-1732.
(11) Zdravkovich, M. M. 1997 Flow Around Circular Cylinders. Vol. 1: Fundamentals. Oxford University Press, Chap. 5.