結核年報 2013(4)治療・治療成績
結核研究所疫学情報センター
キーワーズ:結核,治療歴,受療状況,治療期間,治療成績
は じ め に
結核対策の重要な目的の一つは,地域における結核登
録患者の治療状況を把握し,治療継続の阻害となってい
る要因を明らかにして,それらを解消することにより,
全ての結核患者が無事に治療を完遂することを目指すこ
とである。そのためには,まず結核登録患者の治療状況
についての正確な情報収集と治療成績に関する分析が必
要である。
結核登録者情報システム年報では,前年に新規に登録
された全結核患者集団をコホートとして分析対象とし,
そのうち肺結核患者についての治療成績を自動算出して
いる。また,前年に登録された全結核患者の,その次の
年末時における登録除外状況および除外理由について,
保健所で入力された情報を集計している。
本報告では,2013 年の結核登録者情報システム年報情
報から,2013 年の結核登録患者の治療歴・受療状況・治
療期間等についてと,2012 年に新規に登録された結核患
者のコホート法による治療成績および登録除外状況から
の死亡状況等について概観する。
治 療 歴
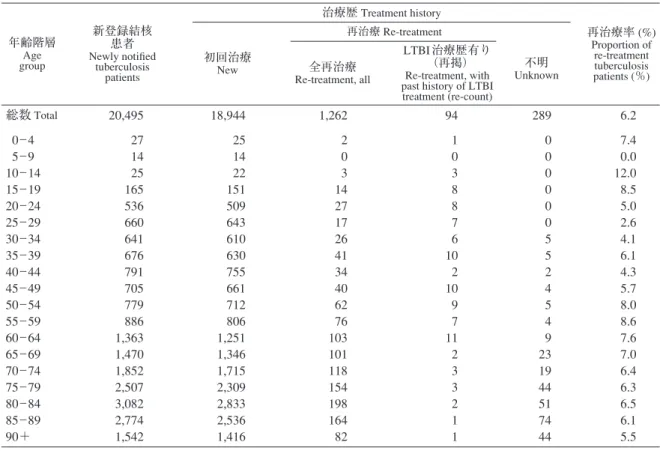
( 1 )治療歴(表 1 )
2013 年に新規登録された活動性結核患者 20,495 人の
登録前治療歴を表 1 に示す。再治療は「結核の化学療法
による治療歴あり」を意味し,外科療法のみ等の場合に
はこれに含めていない。再治療患者は 1,262 人(前年
1,336 人)で,治療歴不明患者(289 人)を除く全活動性
結核患者の 6.2% となり,前年の 6.4% よりも少し低下し
ている。また上記再治療者のうち 94 人で潜在性結核感
染症治療歴があり,前年 95 人とほぼ同様であった。
( 2 )再治療患者の前回治療開始年(表 2 )
2013 年に再治療となった結核患者 1,262 人の,前回治
療開始年についての集計を表 2 に示す。昨年度のデータ
と傾向は同じであり,比較的最近の治療歴(2000 年以
降)とかなり以前(1950 年代前後)の治療歴の,二峰性
の分布で,前者のほうが大きなピークを形成している。
治療開始時の治療内容
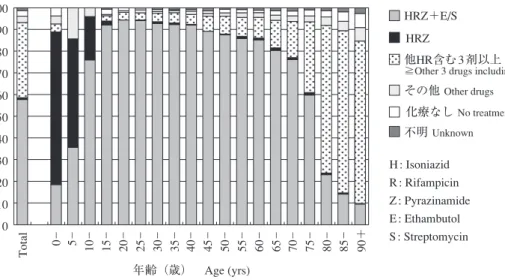
( 3 )治療開始時治療内容(図 1 ・表 3 )
2013 年に新規登録された全活動性結核患者 20,495 人
の,5 歳年齢階層別治療開始時化学療法内容を図 1 に示
す。「化療なし」の患者には,診断前死亡や,全身状態
不良で化学療法不可能だった者,治療拒否者などが含ま
れるものと推察される。イソニアジド(INH)・リファン
ピシン(RFP)・ピラジナミド(PZA)
〔HRZ〕を用いる
標準法による治療開始割合は,15 歳から 49 歳までは 90
% 前後であるが,それ以上の年齢で少しずつ減少し,80
歳を境に著明に低下している。この傾向は以前と同じ
で,高齢者に対する PZA 使用方針に大きな変化はない
ようである。
2012 年 の 新 登 録 活 動 性 結 核 患 者 で, 治 療 開 始 時 に
PZA を含む治療を開始した 12,660 人について,PZA の服
薬期間に関する集計を表 3 に示す。治療完遂者のうち約
13% で PZA 投与期間が 2 カ月に及ばず,標準治療どお
りに治療を行えない状況であった。
受 療 状 況
( 4 )受療状況(図 2 )
2013 年の新登録肺結核患者 15,972 人の治療開始時受
公益財団法人結核予防会結核研究所
連絡先 : 疫学情報センター,公益財団法人結核予防会結核研究
所,〒 204 _ 8533 東京都清瀬市松山 3 _ 1 _ 24
(E-mail : tbsur@jata.or.jp)
表 2 再治療患者の年齢階層別・前回治療開始年別患者数,2013 年
Table 2 Number of re-treatment tuberculosis patients by previous treatment year and age group, 2013
年
Year
総計
Total
年齢(歳)
Age group (yrs)(再掲)前回
治療内容不明
(Re-count)* 0 _ 19 20 _ 29 30 _ 39 40 _ 49 50 _ 59 60 _ 69 70 _ 79 80+総数
Total_ 1949
1950 _ 59
1960 _ 69
1970 _ 79
1980 _ 89
1990 _ 99
2000 _ 09
2010 _ 12
1,262
106
177
76
56
38
66
277
466
19
0
0
0
0
0
0
4
15
44
0
0
0
0
0
2
17
25
67
0
0
0
0
2
4
19
42
74
0
0
0
1
2
7
24
40
138
0
0
1
5
8
9
39
76
204
0
8
15
24
13
13
58
73
272
7
64
30
13
8
13
54
83
444
99
105
30
13
5
18
62
112
349
78
90
46
34
20
29
36
16
(再掲)2000∼2013 年
(Re-count) 2000 _ 20132000
2001
2002
2003
2004
2005
2006
2007
2008
2009
2010
2011
2012
2013
11
8
20
22
20
32
34
30
48
52
90
152
171
53
0
0
0
0
0
1
2
0
1
0
1
5
4
5
1
0
3
0
1
1
2
3
5
1
4
7
11
3
1
0
1
2
0
2
0
3
8
2
14
8
11
9
2
0
2
1
4
3
2
1
4
5
8
11
15
6
2
2
1
0
1
7
5
6
2
13
13
27
24
12
2
2
6
7
4
7
8
5
5
12
13
24
28
8
1
2
4
7
4
5
6
6
9
10
16
25
36
6
2
2
3
5
6
6
9
6
14
9
21
45
42
4
3
2
4
7
1
0
7
2
7
3
6
4
5
1
*(Re-count) : Unknown of previous treatment regimen
表 1 新登録結核患者の年齢階層別・治療歴別患者数,2013 年
Table 1 Number of tuberculosis patients by treatment history and age group, 2013
再治療率 (%):治療歴不明を除く
Proportion of re-treatment tuberculosis patients: those of unknown treatment history excluded LTBI: Latent Tuberculosis Infection
年齢階層
Age group新登録結核
患者
Newly notifi ed tuberculosis patients治療歴
Treatment history再治療率 (%)
Proportion of re-treatment tuberculosis patients (%)初回治療
New 再治療 Re-treatment全再治療
Re-treatment, allLTBI 治療歴有り
(再掲)
Re-treatment, with past history of LTBI treatment (re-count)不明
Unknown総数
Total0 _ 4
5 _ 9
10 _ 14
15 _ 19
20 _ 24
25 _ 29
30 _ 34
35 _ 39
40 _ 44
45 _ 49
50 _ 54
55 _ 59
60 _ 64
65 _ 69
70 _ 74
75 _ 79
80 _ 84
85 _ 89
90+
20,495
27
14
25
165
536
660
641
676
791
705
779
886
1,363
1,470
1,852
2,507
3,082
2,774
1,542
18,944
25
14
22
151
509
643
610
630
755
661
712
806
1,251
1,346
1,715
2,309
2,833
2,536
1,416
1,262
2
0
3
14
27
17
26
41
34
40
62
76
103
101
118
154
198
164
82
94
1
0
3
8
8
7
6
10
2
10
9
7
11
2
3
3
2
1
1
289
0
0
0
0
0
0
5
5
2
4
5
4
9
23
19
44
51
74
44
6.2
7.4
0.0
12.0
8.5
5.0
2.6
4.1
6.1
4.3
5.7
8.0
8.6
7.6
7.0
6.4
6.3
6.5
6.1
5.5
図 1 新登録結核患者の年齢階層別治療開始時化学療法内容,2013 年
Fig. 1 Initial treatment regimen of newly notifi ed tuberculosis patients by age group, 2013
0
_
5
_
10
_
15
_
20
_
25
_
30
_
35
_
40
_
45
_
50
_
55
_
60
_
65
_
70
_
75
_
80
_
85
_
90+
年齢(歳) Age (yrs)
100
90
80
70
60
50
40
30
20
10
0
%
HRZ+E/S
他HR含む 3 剤以上
≧Other 3 drugs including HR
不明
Unknownその他
Other drugs化療なし
No treatmentHRZ
H : Isoniazid
R : Rifampicin
Z : Pyrazinamide
E : Ethambutol
S : Streptomycin
Total
表 3 治療開始時 PZA 使用者について,治療完遂者の PZA 使用継続状況,2012 年新登録患者
Table 3 Treatment with PZA in initial phase among newly notifi ed tuberculosis patients in 2012
and completed standard treatment
総計
Total Completed (%)治療完遂者
総計
Total2 カ月
2 months1 カ月以上 2 カ月未満
≧ 1 month and < 2 months1 カ月未満
< 1 month不明
Unknown12,660
8,012
723
679
3,246
10,303
7,601 (87.3)
590 ( 6.8)
517 ( 5.9)
1,595 ( − )
(%):不明を除く割合 Proportions: cases with unknown PZA use status excluded
PZA: Pyrazinamide
100
90
80
70
60
50
40
30
20
10
0
Total
0
_
5
_
10
_
15
_
20
_
25
_
30
_
35
_
40
_
45
_
50
_
55
_
60
_
65
_
70
_
75
_
80
_
85
_
90
+%
治療なし・不明
Not treated / Unknown
外来
Outpatients
他疾患入院
Hospitalized due mainly
to other diseases
入院
Hospitalized for
tuberculosis treatment
年齢(歳) Age (yrs)
図 2 新登録肺結核患者の治療開始時受療状況別割合,年齢階層別,2013 年
120
140
0
20
40
60
80
100
0 _
20 _ 30 _ 40 _ 50 _ 60 _ 70 _ 80 _ 90+
年齢 Age
男 80%ile
Male
女 80%ile
Female
男 50%ile
Male
女 50%ile
Female
日数 Days
図 3 治療開始時結核を主たる理由に入院かつ退院時期情報があった者について,性・年齢階層別入院期間
(中央値および 80% 値),2012 年新登録肺結核喀痰塗抹陽性初回治療者
Fig. 3 Median (50%ile) and 80%ile of duration of hospitalization among those hospitalized with tuberculosis and with known
discharged day, new sputum-smear positive pulmonary tuberculosis patients in 2012 by sex and age group
表 4 治療開始時入院治療者の入院期間,総合患者分類別,2012 年新登録結核患者
Table 4 Duration of hospitalization among newly notifi ed tuberculosis patients receiving initial treatment
at hospital in 2012 by patient classifi cation
新登録活動性結核 Newly notifi ed tuberculosis patients
総数
Total
肺結核 Pulmonary tuberculosis patients
肺外結核 Extra-pulmonary tuberculosis patients 計 Total 喀痰塗抹陽性 Sputum-smear positive その他の 結核菌陽性 Other bacteriologically positive 菌陰性・ その他 Bacteriologically negative and others 初回治療 New Re-treatment再治療
総数
Total入院
Hospitalized with tuberculosis退院日入力
Known date of discharge21,221
10,508
8,369
16,411
9,140
7,452
7,694
6,950
5,842
579
520
424
5,656
1,388
1,017
2,482
282
169
4,810
1,368
917
入院患者で退院日が入力された者の入院期間 (*)
Duration of hospitalization among those hospitalized with tuberculosis and with known date of discharge (*)
中央値(日)
Median (days)80% 値(日)
80%ile (days)64
113
66
114
69
117
68
116
45
93
44
99
43
100
*退院理由は問わず *Irrespective of the reason for discharge from hospital
棟での退院基準が既に固定しており,結核病床数が一定
している地域では,患者数の減少から結核病床の空床率
が増加し続けていると推測される。
表 4 の対象者中,肺結核喀痰塗抹陽性初回治療の入院
期間代表値を,性・年齢階層別に集計したものを図 3 に
示す。前年同様,女性では年齢と共に入院期間が増加す
る傾向にあるが,男性では 50∼60 歳代のピーク以降入
院期間は減少している。
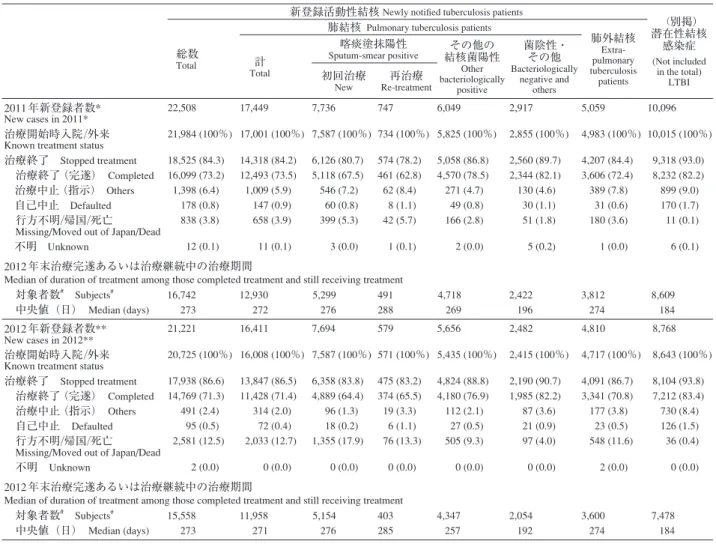
( 6 )治療期間(表 5 )
表 5 は,2012 年と 2013 年の年報情報を用いて,それ
ぞれの前年に新規に登録された全結核患者と潜在性結核
感染症治療対象者について,2012 年および 2013 年末ま
での治療終了状況をみたものである。治療完遂者と治療
継続中の者を対象に,総合患者分類別に治療期間(中央
療状況について,5 歳年齢階層別にみたものを図 2 に示
す。ここでの「入院」とは入院勧告の有無にかかわらず,
「結核の治療を主たる理由とする入院」の意味である。
新登録肺結核患者の治療開始時受療状況の各割合(%)
は前年とほとんど変化はなく,40 歳以降年齢階層が高く
なるに従って,入院治療割合が直線的に増加する傾向で
あった。
( 5 )入院期間(表 4 ・図 3 )
2012 年新登録結核患者で結核治療を主たる理由に入
院治療が実施された者のうち,退院日(死亡退院を含む)
が入力された者について,入院期間を総合患者分類別に
集計したものを表 4 に示す。入院期間は中央値と 80%
値を代表値として示している。これらの数値は前年とほ
ぼ同様で,入院期間の大きな変動はみられず,各結核病
表 5 前年(2011 年,2012 年)新登録治療開始者の各次年末時(2012 年,2013 年)治療終了状況および治療期間,総合患者分類別
Table 5 Treatment status and duration of treatment at the end of the following years (2012/2013) among those newly notifi ed and started
tuberculosis treatment in the previous years (2011/2012) by patient classifi cation
*2012 年年報データによる Based on the annual report database in 2012
**2013 年年報データによる Based on the annual report database in 2013
#
対象者数:年末時点 (2012 年,2013 年)で治療完遂者と登録中かつ治療終了が未入力で治療継続中の者
Subjects : Those who completed tuberculosis treatment or those who were still receiving treatment at the end of the years (2012/2013) LTBI : Latent tuberculosis infection
新登録活動性結核 Newly notifi ed tuberculosis patients
(別掲) 潜在性結核 感染症 (Not included in the total) LTBI 総数 Total
肺結核 Pulmonary tuberculosis patients
肺外結核 Extra-pulmonary tuberculosis patients 計 Total 喀痰塗抹陽性 Sputum-smear positive 結核菌陽性その他の Other bacteriologically positive 菌陰性・ その他 Bacteriologically negative and others 初回治療 New Re-treatment再治療 2011 年新登録者数* New cases in 2011* 治療開始時入院 ⁄外来
Known treatment status
治療終了 Stopped treatment
治療終了(完遂) Completed
治療中止(指示) Others
自己中止 Defaulted
行方不明 ⁄帰国 ⁄死亡 Missing/Moved out of Japan/Dead 不明 Unknown 22,508 21,984 (100%) 18,525 (84.3) 16,099 (73.2) 1,398 (6.4) 178 (0.8) 838 (3.8) 12 (0.1) 17,449 17,001 (100%) 14,318 (84.2) 12,493 (73.5) 1,009 (5.9) 147 (0.9) 658 (3.9) 11 (0.1) 7,736 7,587 (100%) 6,126 (80.7) 5,118 (67.5) 546 (7.2) 60 (0.8) 399 (5.3) 3 (0.0) 747 734 (100%) 574 (78.2) 461 (62.8) 62 (8.4) 8 (1.1) 42 (5.7) 1 (0.1) 6,049 5,825 (100%) 5,058 (86.8) 4,570 (78.5) 271 (4.7) 49 (0.8) 166 (2.8) 2 (0.0) 2,917 2,855 (100%) 2,560 (89.7) 2,344 (82.1) 130 (4.6) 30 (1.1) 51 (1.8) 5 (0.2) 5,059 4,983 (100%) 4,207 (84.4) 3,606 (72.4) 389 (7.8) 31 (0.6) 180 (3.6) 1 (0.0) 10,096 10,015 (100%) 9,318 (93.0) 8,232 (82.2) 899 (9.0) 170 (1.7) 11 (0.1) 6 (0.1) 2012 年末治療完遂あるいは治療継続中の治療期間
Median of duration of treatment among those completed treatment and still receiving treatment
対象者数# Subjects# 16,742 12,930 5,299 491 4,718 2,422 3,812 8,609 中央値(日) Median (days) 273 272 276 288 269 196 274 184 2012 年新登録者数** New cases in 2012** 治療開始時入院 ⁄外来
Known treatment status
治療終了 Stopped treatment
治療終了(完遂) Completed
治療中止(指示) Others
自己中止 Defaulted
行方不明 ⁄帰国 ⁄死亡 Missing/Moved out of Japan/Dead
不明 Unknown 21,221 20,725 (100%) 17,938 (86.6) 14,769 (71.3) 491 (2.4) 95 (0.5) 2,581 (12.5) 2 (0.0) 16,411 16,008 (100%) 13,847 (86.5) 11,428 (71.4) 314 (2.0) 72 (0.4) 2,033 (12.7) 0 (0.0) 7,694 7,587 (100%) 6,358 (83.8) 4,889 (64.4) 96 (1.3) 18 (0.2) 1,355 (17.9) 0 (0.0) 579 571 (100%) 475 (83.2) 374 (65.5) 19 (3.3) 6 (1.1) 76 (13.3) 0 (0.0) 5,656 5,435 (100%) 4,824 (88.8) 4,180 (76.9) 112 (2.1) 27 (0.5) 505 (9.3) 0 (0.0) 2,482 2,415 (100%) 2,190 (90.7) 1,985 (82.2) 87 (3.6) 21 (0.9) 97 (4.0) 0 (0.0) 4,810 4,717 (100%) 4,091 (86.7) 3,341 (70.8) 177 (3.8) 23 (0.5) 548 (11.6) 2 (0.0) 8,768 8,643 (100%) 8,104 (93.8) 7,212 (83.4) 730 (8.4) 126 (1.5) 36 (0.4) 0 (0.0) 2012 年末治療完遂あるいは治療継続中の治療期間
Median of duration of treatment among those completed treatment and still receiving treatment
対象者数# Subjects# 15,558 11,958 5,154 403 4,347 2,054 3,600 7,478 中央値(日) Median (days) 273 271 276 285 257 192 274 184
値)を算出して表示した。治療期間の中央値は前年同様
で,全結核患者 273 日,肺結核喀痰塗抹陽性初回治療患
者 276 日で,大半の例で PZA を使用した化学療法が開始
されているにもかかわらず(表 3 ),平均治療期間は約
9 カ月となっている。
治 療 成 績
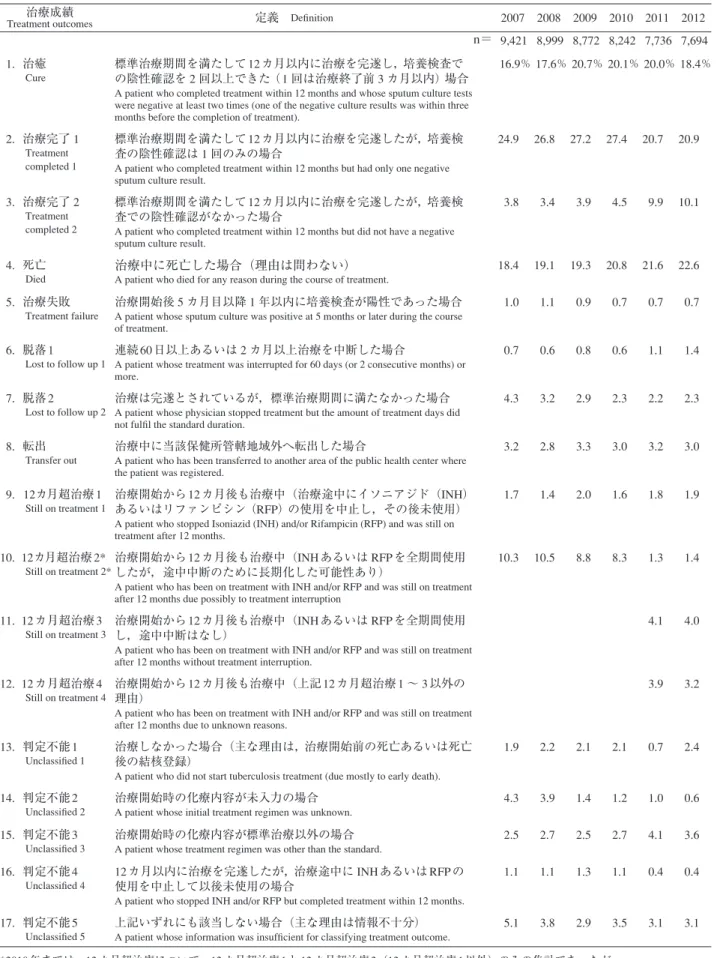
( 7 )肺結核患者分類別治療成績(表 6 ・表 7 )
2012 年新登録肺結核患者をコホートとする治療成績
は,菌培養検査結果・受療状況・治療終了理由・登録除
外理由等から,コンピュータにより 17 区分に自動に分
類されるが(2010 年までは 15 区分,表 7 ),結核年報の
治療成績は,
「治療成功」から「判定不能」までの 7 区
分にまとめている(表 6 )。総合患者分類別でみた「治療
成功」
(「治癒」と「治療完了」を合わせたもの)割合は,
「初回治療」で 49.4%,
「再治療」で 45.1%,
「他結核菌陽
性」で 58.0%,
「結核菌陰性・その他」で 62.0% であった。
「死亡」(理由は問わず結核治療中に死亡した場合)の割
合は,
「喀痰塗抹陽性初回治療」で 22.6%,
「同再治療」
で 18.5% であったが,
「結核菌陰性・その他」では 6.0%
と低かった。一方「脱落・中断」の割合は,
「喀痰塗抹
陽性」
(「初回治療」で 3.7%,
「再治療」で 3.5%)より「結
核菌陰性・その他」で高い傾向があり(12.2%),これは
治療期間が標準治療期間に満たない「脱落 2 」の割合が
高い(10.2%)ことによる。「12 カ月を超える治療」の割
合は,
「喀痰塗抹陽性再治療」で 15.0% と高く,
「喀痰塗
抹陽性初回治療」
(10.5%)の約 1.5 倍,
「結核菌陰性・そ
の他」
(5.0%)の約 3 倍であった。コンピュータによる
自動治療成績分析で「判定不能」と分類されたのは,全
体で 1,735 人(10.6%)であり,結核治療を開始しなかっ
た「判定不能 1 」が 456 人(2.8%),非標準治療により治
療を開始した「判定不能 3 」が 540 人(3.3%),治療成績
表 6 2012 年新登録肺結核患者の総合患者分類別によるコホート治療成績
Table 6 Treatment outcome of newly notifi ed pulmonary tuberculosis patients by patient classifi cation, 2012 year cohort
肺結核 Pulmonary tuberculosis patients
総数 Total 喀痰塗抹陽性 Sputum-smear positive 他結核菌陽性 Other bacteriologically positive 結核菌陰性・ その他 Bacteriologically negative and others 初回治療 New Re-treatment再治療
新登録肺結核患者数
New pulmonary tuberculosis patients
16,411 (100%)
7,694 (100%)
579 (100%)
5,656 (100%)
2,482 (100%)
治療成績
Treatment outcomes (*)1. 治療成功
Treatment success治癒
Cure治療完了
Treatment completed治療完了 1
Treatment completed 1治療完了 2
Treatment completed 22. 死亡
Died3. 治療失敗
Treatment failure4. 脱落・中断
Lost to follow up脱落 1
Lost to follow up 1脱落 2
Lost to follow up 25. 転出
Transfer out6. 12 カ月超治療
Still on treatment12 カ月超 1
Still on treatment 112 カ月超 2
Still on treatment 212 カ月超 3
Still on treatment 312 カ月超 4
Still on treatment 47. 判定不能
Unclassifi ed判定不能 1
Unclassifi ed 1判定不能 2
Unclassifi ed 2判定不能 3
Unclassifi ed 3判定不能 4
Unclassifi ed 4判定不能 5
Unclassifi ed 58,876
2,469
6,407
4,113
2,294
2,716
81
1,093
283
810
473
1,437
275
187
525
450
1,735
456
69
540
83
587
54.1
15.0
39.0
25.1
14.0
16.5
0.5
6.7
1.7
4.9
2.9
8.8
1.7
1.1
3.2
2.7
10.6
2.8
0.4
3.3
0.5
3.6
3,797
1,413
2,384
1,607
777
1,742
53
288
110
178
228
810
150
107
309
244
776
184
43
277
30
242
49.4
18.4
31.0
20.9
10.1
22.6
0.7
3.7
1.4
2.3
3.0
10.5
1.9
1.4
4.0
3.2
10.1
2.4
0.6
3.6
0.4
3.1
261
104
157
110
47
107
5
20
10
10
20
87
19
9
40
19
79
6
4
38
5
26
45.1
18.0
27.1
19.0
8.1
18.5
0.9
3.5
1.7
1.7
3.5
15.0
3.3
1.6
6.9
3.3
13.6
1.0
0.7
6.6
0.9
4.5
3,278
713
2,565
1,097
1,468
719
21
481
111
370
140
417
87
52
130
148
600
211
17
147
37
188
58.0
12.6
45.4
19.4
26.0
12.7
0.4
8.5
2.0
6.5
2.5
7.4
1.5
0.9
2.3
2.6
10.6
3.7
0.3
2.6
0.7
3.3
1,540
239
1,301
1,299
2
148
2
304
52
252
85
123
19
19
46
39
280
55
5
78
11
131
62.0
9.6
52.4
52.3
0.1
6.0
0.1
12.2
2.1
10.2
3.4
5.0
0.8
0.8
1.9
1.6
11.3
2.2
0.2
3.1
0.4
5.3
* 治療成績:表 7 参照。治療開始せず(主に早期に死亡),化療内容不明,非標準治療で開始,途中から最後まで INH あるいは RFP 使用 中止,その他情報不足を含む。*Treatment outcomes: See Table 7. It includes those who did not start tuberculosis treatment (mostly caused by early death), those whose initial treatment regimen is unknown, those whose treatment is other than standard treatment, those who stopped INH and/or RFP before treatment completion, and those whose information is insuffi cient for classifying treatment outcomes.
INH: Isoniazid, RFP: Rifampicin
判定のための情報が不足していた「判定不能 5 」が 587
人(3.6%)であった(表 6 )。
表 7 に治療成績 17 区分の各定義と,喀痰塗抹陽性初
回治療肺結核患者として,2007 年以降の各年に登録さ
れた患者の治療成績割合の推移を示した。「治癒」・「治
療完了 1 」・「治療完了 2 」を合わせた「治療成功」は約
50% で 横 ば い 傾 向 で あ り,
「 死 亡 」 の 割 合 は,2010 年
20.8%,2011 年 21.6%,2012 年 22.6% と,近年増加傾向に
ある
1)。「脱落 1 」
・
「脱落 2 」を合わせた「脱落・中断」は,
2007 年以降 5 % 以下を維持している。「判定不能 2 」は
減少傾向で,2012 年は 1 % 未満となったが,
「判定不能
3 」と「判定不能 5 」は横ばいであった。
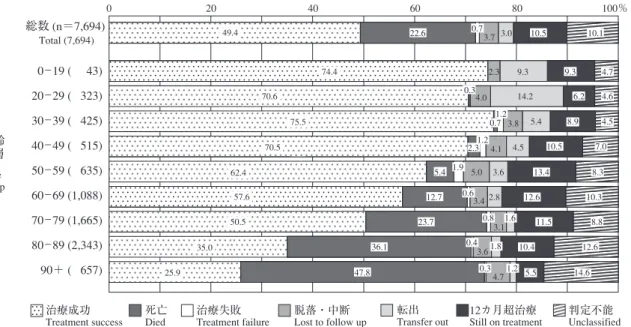
( 8 )年齢階層別治療成績(図 4 )
図 4 は,2012 年に登録された喀痰塗抹陽性初回治療者
7,694 人について,年齢階層別に治療成績を比較したも
のである。年齢階層別の「死亡」割合では,30 歳代で
0.7%,40 歳代で 2.3% であるが,70 歳代,80 歳代,90 歳
以上ではそれぞれ 23.7%・36.1%・47.8% と,高齢層ほど
「死亡」割合が高くなっている。「12 カ月を超える治療」
の割合は 50 歳代から 70 歳代で高く,治療中の他保健所
への「転出」の割合は 20 歳代で最も高く,14.2% であっ
た。
転帰と死亡
( 9 )転帰(表 8 )
表 8 は,2012 年と 2013 年の結核登録者情報システム
年報情報を用いて,2011 年と 2012 年に新規登録された
全結核患者と潜在性結核感染症治療対象者について,そ
れぞれ 2012 年末と 2013 年末までの登録除外状況をみた
ものである。喀痰塗抹陽性肺結核患者では「死亡」で除
外 さ れ る 割 合 が 高 く,初 回 治 療 者 で そ れ ぞ れ 29.3%,
31.3%,再治療者でそれぞれ 30.4%,25.0% であった。
「登
録中の再登録」(結核登録者情報システム登録中に再排
菌等で再治療となり,改めて登録されるもの)の割合
は,喀痰塗抹陽性肺結核の初回治療では,それぞれの年
で 0.8% と 0.6%,再治療では 0.5%,1.6% と低率を維持し
ていた。
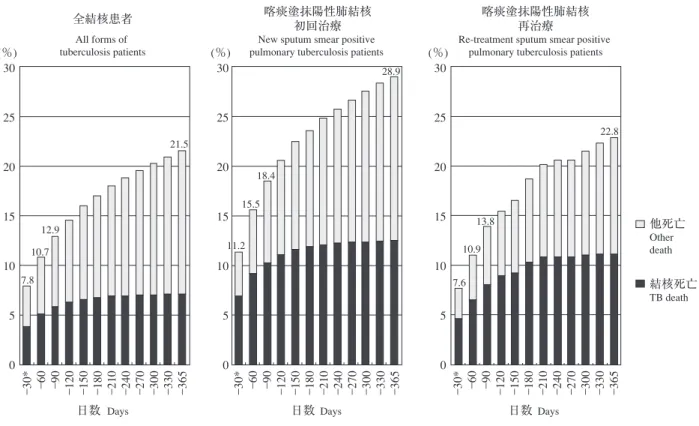
(10)死亡(図 5 )
図 5 は,表 8 における 2012 年新登録全結核患者 21,221
人を対象に,治療開始時から 1 年(365 日)後までの月
表 7 治療成績区分と定義および新登録喀痰塗抹陽性初回治療肺結核患者の治療成績(率),2007∼2012 年コホート
Table 7 Treatment outcomes of newly notifi ed sputum-smear positive pulmonary tuberculosis patients, 2007_2012 year cohorts (%)
治療成績
Treatment outcomes
定義
Defi nition2007 2008 2009 2010 2011 2012
n= 9,421 8,999 8,772 8,242 7,736 7,694
1. 治癒
Cure
標準治療期間を満たして 12 カ月以内に治療を完遂し,培養検査で
の陰性確認を 2 回以上できた( 1 回は治療終了前 3 カ月以内)場合
A patient who completed treatment within 12 months and whose sputum culture tests were negative at least two times (one of the negative culture results was within three months before the completion of treatment).
16.9
%17.6
%20.7
%20.1
%20.0
%18.4
%2. 治療完了 1
Treatment
completed 1
標準治療期間を満たして 12 カ月以内に治療を完遂したが,培養検
査の陰性確認は 1 回のみの場合
A patient who completed treatment within 12 months but had only one negative sputum culture result.
24.9 26.8 27.2 27.4 20.7 20.9
3. 治療完了 2
Treatment
completed 2
標準治療期間を満たして 12 カ月以内に治療を完遂したが,培養検
査での陰性確認がなかった場合
A patient who completed treatment within 12 months but did not have a negative sputum culture result.
3.8 3.4 3.9 4.5 9.9 10.1
4. 死亡
Died
治療中に死亡した場合(理由は問わない)
A patient who died for any reason during the course of treatment.
18.4 19.1 19.3 20.8 21.6 22.6
5. 治療失敗
Treatment failure
治療開始後 5 カ月目以降 1 年以内に培養検査が陽性であった場合
A patient whose sputum culture was positive at 5 months or later during the course of treatment.
1.0 1.1 0.9 0.7 0.7 0.7
6. 脱落 1
Lost to follow up 1
連続 60 日以上あるいは 2 カ月以上治療を中断した場合
A patient whose treatment was interrupted for 60 days (or 2 consecutive months) or more.
0.7 0.6 0.8 0.6 1.1 1.4
7. 脱落 2
Lost to follow up 2
治療は完遂とされているが,標準治療期間に満たなかった場合
A patient whose physician stopped treatment but the amount of treatment days did not fulfi l the standard duration.
4.3 3.2 2.9 2.3 2.2 2.3
8. 転出
Transfer out
治療中に当該保健所管轄地域外へ転出した場合
A patient who has been transferred to another area of the public health center where the patient was registered.
3.2 2.8 3.3 3.0 3.2 3.0
9. 12カ月超治療 1
Still on treatment 1
治療開始から 12 カ月後も治療中(治療途中にイソニアジド(INH)
あるいはリファンピシン(RFP)の使用を中止し,その後未使用)
A patient who stopped Isoniazid (INH) and/or Rifampicin (RFP) and was still on treatment after 12 months.
1.7 1.4 2.0 1.6 1.8 1.9
10. 12カ月超治療 2*
Still on treatment 2*
治療開始から 12 カ月後も治療中(INH あるいは RFP を全期間使用
したが,途中中断のために長期化した可能性あり)
A patient who has been on treatment with INH and/or RFP and was still on treatment after 12 months due possibly to treatment interruption
10.3 10.5 8.8 8.3 1.3 1.4
11. 12 カ月超治療 3
Still on treatment 3
治療開始から 12 カ月後も治療中(INH あるいは RFP を全期間使用
し,途中中断はなし)
A patient who has been on treatment with INH and/or RFP and was still on treatment after 12 months without treatment interruption.
4.1 4.0
12. 12 カ月超治療 4
Still on treatment 4
治療開始から 12 カ月後も治療中(上記 12 カ月超治療 1 ∼ 3 以外の
理由)
A patient who has been on treatment with INH and/or RFP and was still on treatment after 12 months due to unknown reasons.
3.9 3.2
13. 判定不能 1
Unclassifi ed 1
治療しなかった場合(主な理由は,治療開始前の死亡あるいは死亡
後の結核登録)
A patient who did not start tuberculosis treatment (due mostly to early death).
1.9 2.2 2.1 2.1 0.7 2.4
14. 判定不能 2
Unclassifi ed 2
治療開始時の化療内容が未入力の場合
A patient whose initial treatment regimen was unknown.
4.3 3.9 1.4 1.2 1.0 0.6
15. 判定不能 3
Unclassifi ed 3
治療開始時の化療内容が標準治療以外の場合
A patient whose treatment regimen was other than the standard.
2.5 2.7 2.5 2.7 4.1 3.6
16. 判定不能 4
Unclassifi ed 4
12 カ月以内に治療を完遂したが,治療途中に INH あるいは RFP の
使用を中止して以後未使用の場合
A patient who stopped INH and/or RFP but completed treatment within 12 months.
1.1 1.1 1.3 1.1 0.4 0.4
17. 判定不能 5
Unclassifi ed 5
上記いずれにも該当しない場合(主な理由は情報不十分)
A patient whose information was insuffi cient for classifying treatment outcome.
5.1 3.8 2.9 3.5 3.1 3.1
* 2010 年までは,12 カ月超治療について,12 カ月超治療 1 と 12 カ月超治療 2(12 カ月超治療 1 以外)のみの集計であったが, 2011 年以降は,2010 年までの 12 カ月超治療 2 を細分化して 12 カ月超治療 1 ∼ 4 で集計している。
表 8 2011 年・2012 年における新登録結核患者と潜在性結核感染症登録患者の次年末時(2012 年末・2013 年末)登録除外状
況および除外理由,総合患者分類別
Table 8 Number (proportion) of patients excluded from tuberculosis registration by the end of years (in 2012 and in 2013) among those
newly notifi ed tuberculosis patients and LTBI patients in the previous years (in 2011 and in 2012, respectively) by patient classifi cation
新登録活動性結核 Newly notifi ed tuberculosis patients
(別掲) 潜在性結核 感染症 LTBI patients (Not included in the total) 肺結核 Pulmonary tuberculosis 肺外結核 Extra-pulmonary 総数 Total 肺結核計 Sub-total (Pulmonary tuberculosis) 喀痰塗抹陽性
Sputum-smear positive 他結核菌陽性Other bacteriologically positive 結核菌陰性 Bacteriologically negative 初回治療 New Re-treatment再治療 2011 年新登録結核患者数 *
Newly notifi ed tuberculosis cases in 2011*
22,508 (100%) 17,449 (100%) 7,736 (100%) 747 (100%) 6,049 (100%) 2,917 (100%) 5,059 (100%)10,096 (100%)
2012 年末時までの除外者計
Total number of patients excluded from tuberculosis registration by the end of 2012
観察不要 No need for follow-up
死亡 Died
結核死 Tuberculosis death
結核外死 Other death
転出 Transfer out
登録中の再登録
Re-treatment during registration
その他の理由 Other reasons 6,385 (28.4) 136 ( 0.6) 5,050 (22.4) 1,502 ( 6.7) 3,548 (15.8) 983 ( 4.4) 138 ( 0.6) 78 ( 0.3) 5,045 (28.9) 48 ( 0.3) 3,994 (22.9) 1,258 ( 7.2) 2,736 (15.7) 828 ( 4.7) 118 ( 0.7) 57 ( 0.3) 2,710 (35.0) 5 ( 0.1) 2,267 (29.3) 932 (12.0) 1,335 (17.3) 354 ( 4.6) 65 ( 0.8) 19 ( 0.2) 279 (37.3) 1 ( 0.1) 227 (30.4) 80 (10.7) 147 (19.7) 47 ( 6.3) 4 ( 0.5) 0 ( 0.0) 1,532 (25.3) 16 ( 0.3) 1,206 (19.9) 184 ( 3.0) 1,022 (16.9) 255 ( 4.2) 34 ( 0.6) 21 ( 0.3) 524 (18.0) 26 ( 0.9) 294 (10.1) 62 ( 2.1) 232 ( 8.0) 172 ( 5.9) 15 ( 0.5) 17 ( 0.6) 1,340 (26.5) 88 ( 1.7) 1,056 (20.9) 244 ( 4.8) 812 (16.1) 155 ( 3.1) 20 ( 0.4) 21 ( 0.4) 1,240 (12.3) 465 ( 4.6) 65 ( 0.6) 0 ( 0.0) 65 ( 0.6) 592 ( 5.9) 51 ( 0.5) 67 ( 0.7) 2012 年新登録結核患者数 **
Newly notifi ed tuberculosis cases in 2012**
21,221 (100%) 16,411 (100%) 7,694 (100%) 579 (100%) 5,656 (100%) 2,482 (100%) 4,810 (100%) 8,768 (100%)
2013 年末時までの除外者計
Total number of patients excluded from tuberculosis registration by the end of 2013
観察不要 No need for follow-up
死亡 Died
結核死 Tuberculosis death
結核外死 Other death
転出 Transfer out
登録中の再登録
Re-treatment during registration
その他の理由 Other reasons 6,244 (29.4) 84 ( 0.4) 4,989 (23.5) 1,490 ( 7.0) 3,499 (16.5) 1,001 ( 4.7) 133 ( 0.6) 37 ( 0.2) 4,947 (30.1) 38 ( 0.2) 3,948 (24.1) 1,265 ( 7.7) 2,683 (16.3) 827 ( 5.0) 107 ( 0.7) 27 ( 0.2) 2,822 (36.7) 6 ( 0.1) 2,406 (31.3) 961 (12.5) 1,445 (18.8) 360 ( 4.7) 45 ( 0.6) 5 ( 0.1) 185 (32.0) 1 ( 0.2) 145 (25.0) 64 (11.1) 81 (14.0) 27 ( 4.7) 9 ( 1.6) 3 ( 0.5) 1,466 (25.9) 11 ( 0.2) 1,137 (20.1) 194 ( 3.4) 943 (16.7) 265 ( 4.7) 41 ( 0.7) 12 ( 0.2) 474 (19.1) 20 ( 0.8) 260 (10.5) 46 ( 1.9) 214 ( 8.6) 175 ( 7.1) 12 ( 0.5) 7 ( 0.3) 1,297 (27.0) 46 ( 1.0) 1,041 (21.6) 225 ( 4.7) 816 (17.0) 174 ( 3.6) 26 ( 0.5) 10 ( 0.2) 880 (10.0) 206 ( 2.3) 77 ( 0.9) 1 ( 0.0) 76 ( 0.9) 506 ( 5.8) 41 ( 0.5) 50 ( 0.6)
*2012 年結核年報データによる Based on the annual report database in 2012.
**2013 年結核年報データによる Based on the annual report database in 2013.
LTBI : Latent Tuberculosis Infection
図 4 2012 年新登録肺結核喀痰塗抹陽性初回治療者の年齢階層別コホート法による治療成績(%)
Fig. 4 Treatment outcomes of newly notifi ed sputum-smear positive pulmonary tuberculosis patients by age group,
2012 year cohort (%)
. . . .
. . . .
. . . .
. . . .
. . . .
. . . .
. . . .
. . . .
. . . .
. . . .
...
..
...
総数 (n=7,694)
0 _ 19 ( 43)
20 _ 29 ( 323)
30 _ 39 ( 425)
40 _ 49 ( 515)
50 _ 59 ( 635)
60 _ 69 (1,088)
70 _ 79 (1,665)
80 _ 89 (2,343)
90+ ( 657)
年齢
階層
0 20 40 60 80 100% 治療成功Treatment success 死亡Died 治療失敗Treatment failure 脱落・中断Lost to follow up 転出Transfer out 12カ月超治療Still on treatment 判定不能Unclassified Age group Total (7,694) 25.9 35.0 50.5 57.6 62.4 70.5 75.5 70.6 74.4 49.4 5.5 10.4 11.5 12.6 13.4 10.5 8.9 6.2 9.3 10.5 14.6 12.6 8.8 10.3 8.3 7.0 4.5 4.6 4.7 10.1 2.3 0.7 22.6 0.3 0.4 0.8 0.6 1.9 1.2 1.2 0.3 0.7 4.7 3.6 3.1 3.4 5.0 4.1 3.8 4.0 2.3 3.7 1.2 1.8 1.6 2.8 3.6 4.5 14.2 9.3 3.0 47.8 36.1 23.7 12.7 5.4 5.4
図 5 2012 年新登録結核患者中治療開始後 1 年以内死亡者の時期別・死因別累積死亡割合(%)
Fig. 5 Cumulative proportion of deaths among newly notifi ed tuberculosis patients in 2012, by period from the
beginning of treatment and by cause of death through one year
_30*: 死亡後登録・治療前死亡を含む _30*: Includes patients who died before the commencement of treatment.
TB: tuberculosis
日数
Days(%)
30
25
20
15
10
5
0
_ 30* _
60 _ 90
_ 120 _ 150 _ 180 _ 210 _ 240 _ 270 _ 300 _ 330 _ 365
日数
Days(%)
30
25
20
15
10
5
0
_ 30* _
60 _ 90
_ 120 _ 150 _ 180 _ 210 _ 240 _ 270 _ 300 _ 330 _ 365
日数
Days(%)
30
25
20
15
10
5
0
_ 30* _
60 _ 90
_ 120 _ 150 _ 180 _ 210 _ 240 _ 270 _ 300 _ 330 _ 365
他死亡
Other death結核死亡
TB death全結核患者
All forms of tuberculosis patients喀痰塗抹陽性肺結核
初回治療
New sputum smear positive pulmonary tuberculosis patients
喀痰塗抹陽性肺結核
再治療
Re-treatment sputum smear positive pulmonary tuberculosis patients
7.8 10.7 12.9 21.5 11.2 15.5 18.4 28.9 22.8 13.8 10.9 7.6