修 士 論 文
A Study of the Performance of Skylights:
Computational Simulation Analysis by Photon Mapping of Skylights Using Glass Balls
(天 窓 の 性能 の 研 究
一 ガ ラ ス ボ ー ル を 用 い た 天 窓 の フ ォ トン マ ッ ピ ン グ 法 に よ る コ ン ピ ュ ー タ解 析 シ ミ ュ レー シ ョン ー)
平 成29年 度
指 導 教 員VerlAdams
(学 修 番 号)16893508
堅 山 明樹
首都大学東京大学 院
システ ムデザイ ン研 究科 博士前期課程 イ ンダス トリアル アー ト学域
提 出 目:2018年1.月25日
天 窓 の 性 能 の 研 究
一 ガ ラ ス ボ ー ル を 用 い た 天 窓 の フ ォ トンマ ッ ピ ン グ 法 に よ る コ ン ピ ュ ー タ 解 析 シ ミ ュ レー シ ョ ンー
要 旨
本 稿 で は 、 ガ ラ ス ボ ー ル を 用 い た 天 窓 の 照 明 性 能 、 これ らの 建 物 の 天 窓 の 実 用 性 、 内 装 材 の 明 度 が ど の よ うに天 窓 の 照 明 性 能 に 影 響 す るか を述 べ る。
こ の 研 究 で は 、 国 立 研 究 評 議 会 カ ナ ダ(NRC)、 ハ ー バ ー ド大 学 とオ ー トデ ス ク に よ っ て 検 証 され た フ ォ トンマ ッ ピ ン グ の ア ル ゴ リズ ム を使 用 して 、 ガ ラ ス ボ ー ル に 入 射 す る 直射 日光 の 軌 跡 を分 析 した 。
こ の 実 験 で は 、4つ の 異 な る種 類 の ス カ イ ラ イ トと6種 類 の 異 な る 内 装 材 の 組 み 合 わ せ を 分 析 した 。 照 明 性 能 を 計 算 す る た め の2つ の 分 析 方 法 を使 用 した 。1つ 目 の 方 法 は 、 レ ン ダ リ ン グ 画 像 と照 度 分 布 画 像 を 作 成 す る こ とで あ る 。 も う一 つ の 方 法 は 照 度 の 数 値 測 定 で あ る。
そ の 結 果 、 天 窓 の ガ ラ ス ボ ー ル の 量 が 多 い ほ ど光 が 均 一 に 広 が る こ と が わ か っ た 。 ま た 、 壁 材 の 色 の 明 度 が 高 い ほ ど平 均 照 度 及 び 均 斉 度 が 向 上 し、 マ ッ ト材 で は 光 沢 材 に 比 べ て 明 度 の 違 い に よ る 照 明 性 能 の 差 が 大 き か っ た。
本 研 究 に お い て 、 ガ ラ ス ボ ー ル を 用 い た 天 窓 に よ っ て 、 照 度 、 均 斉 度 を 高 め る た め に 、 内 装 材 と し て 明 度 の 高 い 材 料 を 用 い る方 が 良 い こ とが 分 か っ た 。 さ ら に 、 本 研 究 の 大 き な 成 果 は 、 屈 折 材 料 に よ る光 の 照 明 効 果 の 分 析 が 、 フ ォ トン マ ッ ピ ン グ を 用 い た コ ン ピ ュー タ 照 明 分 析 に よ っ て 可 能 に な っ た こ とで あ る 。
:JAM
'P -1V got 0)
--LK•ctax-2kfak-3 ,-Jk-*x--'t
, v.!! 111.-i3—J, • • 't ,
;•,, • •Jit I '.!t -.; •-• - • ';•1,".-1.:•1-11
; 1.,•; (k1
- • 1
;11(itti“. •I•fc.i'",
1 i i• t ,) 0.'1;3 1.. ,L1,1:!:
I [1110 .1, 1- 114 - L. '
• .• r. 3 :I? \' • •
.( ' •
• 161 - I •
•z , - - • 1, - ; t. • , - : ,••••• ;
11 -2
$.
,•
.1 • • • \-Jt ,:;•
- ' • .` Orin. *b •••
A Study of the Performance of Skylights:
Computational Simulation Analysis by Photon Mapping of Skylights Using Glass Balls
Summary
This paper examines lighting performances of skylights using glass balls, the practicality of these types of skylights for buildings, and how the color of the interior materials affects the
lighting performance of the skylights.
In this research the algorithm for photon mapping, which has been validated in a collaborative effort between the National Research Council Canada (NRC), Harvard University and Autodesk, was used to analyze the phenomenon of direct sunlight entering the glass balls, refracting and diffusing.
In this experiment, each combination of four different types of skylights and six different interior materials were analyzed. Two analysis methods for calculating uniformity were used. One method was making realistic rendered images and illuminance distribution images. The other method was taking numeric illuminance measurements.
The results showed that the larger amounts of glass balls in the skylights increased the uniformity of the light distribution. Moreover, the higher the value of the color of the wall material increased the average illuminance and uniformity, and in matte materials the difference in lighting performance due to the difference of value of color was larger than that in glossy materials.
In this study, it was found that it is better to use a material with a high value of color as an interior material in order to bring about a higher illuminance and a higher uniformity using skylights with glass balls. Moreover, a big achievement of this research was that an analysis of the lighting effect of light through refractive materials was made possible by computer lighting analysis using photon mapping.
1
:24dg if vA to JortBrirmit 15(1 rIi10 ybuie A
mfg 1\012 lo gill qqa1V1 noorf ‘tcl Ef IA umi2 IBuoiterugrrioD 211cEJepfilD ,13ni 13
-1:113 flit
'1!ftri'M'Ant- .1.A.t.r .J1E:ft 3`.)111;In i(riTi( ,urfori44ii JTtHhI7) 1)( errIT
1'hr CI ¶JdI 1010D `Jr!} ti 11; 101 ; 11 • ,
If le! 'Al 10 4.Y_MCV1r:t121C1 I1 •iI
fi'Jt)(1 k/:11 )lit/; V51 froT
bir-,,.ruJ I 1}1)11i.01. I : 'A] •)111ael ;1 ! fl.A1
E)•?0, Cif AV.41100, ,f1'.. ,J1 1-A4).,.1J ri U.if! .1
La11": tlt!
a J r. le, yr, !i1 A"! • ri Hi] _
/
1(;;; F,: • liii !-•l•1•Jilki
ir7`J ,M:1;11 ..4 )
_a J111;!;irmr 11 Jur): 11110 ' rd./ !,!'vArr
Ii f' If.if • •
r1.1•: ;
. r7;1' fp af ,11111rt,:11) jrf Jrir II. ' :e
.t;•.
..tii •i
.11 b:rr, /I; I ;JI^CitaaiCI
!, Ii JiJi • t.,f' ,fi
tfri r.• .1(1 ti .
L? t II 1/:11; 1)1.11 il:// •.,1.),1•! ,!1
:L I ; ':;illi! la14!.. '21111 ri
1;11, •P. t •!.![ „ viff Pr.)]
! a • ./ ri 1 fr: ' ii.:11;f1; ".4-`!rai..(1 111.'411 U11•01)
'211.
Table of Contents
Summary 1. Introduction
1.1 Background 1.2 Purpose 2. Methods
2.1 Creating Analysis Models
2.1.1 Settings of Analysis Space and Skylight 2.1.2 Modeling Skylights with 4 Different Patterns
1 4 4 7 8 8 8
2.2 Settings for Analysis 2.2.1 Material Settings
2.2.1.1 Material Setting of Glass Balls and Skylight's Glass 2.2.1.2 Material Setting of Floor, Walls and Ceiling
2.2.2 Algorithm Setting 2.2.3 Setting of Sunlight
2.2.3.1 Setting of Measurement Area
2.2.3.2 Setting of Measurement Dates and Times 2.2.4 Analysis Method
2.2.4.1 Making Images
2.2.4.2 Measurement and Calculation of Illuminance 3. Results...
3.1. Results in Spring 3.2. Results in Summer 3.3. Results in Winter..
4. Discussion
4.1 Difference for Each Skylight
4.2 Difference for Each Measurement Date 4.3 Difference for Each Interior Material ...
4.4 Evaluation Based on JIS
11 13 13 13 14 17 17 17 17 20 20 23 24 25 31 37 43 43 43 43 44
5. Conclusions
5.1 Conclusion of Analysis Results.
5.2 Conclusion of Analysis Method 5.3 About Works of This Research., 6. Acknowledgments
7. References...
8. Appendices
8.1 Images of Results 8.2 Numeric Data of Results
48 48 48 48 56 57 59 59 205
1. Introduction
1.1 Background
A history of skylights dates back to Pantheon of the ancient Roman Empire. Figure 1-A illustrates a hemispherical dome of the Pantheon that was constructed around 27 B.C. The dome is extremely heavy, with a wall thickness of 1.5 m to 5.9 m and a volume of 53.000 cubic meters.
At the top of this dome, a round opening (or oculus) with an area of about 63 square meters was installed, and this skylight illuminates the space [1].
Figure 1-B is a photograph of the Kimbell Art Museum built in 1972. This building is based on a vault space using a cycloid curve, and incorporates natural light from a gap at the top and reflectors. By vaulted ceiling of exposed concrete, the natural light taken in is diffused and reflected. This creates a soft light and prevents direct sunlight from reaching the artworks.
Therefore, it prevents deterioration of artworks while brightening the space with naturaI light [2].
Another similar example is given. Figure 1-C which shows a lighting element's section view of the Menil Collection museum designed by Renzo Piano which was built in 1987. By using sun louvers in the building, indirect natural light can be reflected uniformly into the exhibition rooms, while blocking direct light [3].
Figure 1-A [1]
1,4,0071:
Figure 1-B [4]
4
1'1/'/-'/;
Figure I -C [4]
As a general lighting rule, it is prescribed that skylights are 3 times more effective in daylighting performance, compared to side windows [5]. However, in summer and around noon, direct sunlight is very strong and interior spaces are not illuminated uniformly . There are countermeasures that can be taken, such as making the window glass corroded glass , or setting a roll screen on the skylight [5]. Figure 1-D indicates an example using corroded glass in an exhibition room of Kunsthaus Bregenz. Figure 1-E indicates an example of using a roll screen in an office building in Yokohama. But there are problems with these designs that result in a reduction of daylighting effects.
W
"IfW,
ris"
r..
: n,
Figure 1-D [5]Figure 1-E [6]
Some special examples of solving this problem with refractive materials will be introduced here . The first is Figure 1-F [6], a skylight in the Tokyo Midtown building. It is a skylight to receive natural light into an underground space. Water is flowing on the surface of this skylight , and the sunlight entering the underground space is diffused by the refraction of the water . In Addition, due to the heat insulating properties of water, the insulation of the skylight is improved [6] . The second example is Figure 1-G, "I Proj ect Skylight" designed by Ove Arup & Partners Japan Ltd and KUME SEKKEI Co. Ltd. The main feature of this building is the skylight at the top of
5
the colonnade. Prism louvers, that refract and diffuse light, are installed in this skylight and introduce a level of brightness into the space so that it does not feel underground. In this skylight design, a geometric analysis of the amount of light diffusion of the louvers was done by Grasshopper, which is a plugin of Rhinoceros. In addition, a one-ten scale physical model was made and measurements were taken using the physical model and actual sunlight [7].
The third example is Figure 1-H, the glass floor of the observation deck in the Marunouchi- Building in Tokyo, which incorporates the spreading of glass balls as decoration [6]. The deck is structured so that direct sunlight, incident on the glass floor, is sufficiently refracted and diffused by the glass balls and taken into the space below.
i\
^ 6.
'
Figure 1-F [61
* 114,1Pilik
7,17 IIP
.•,:
• .
Figure 1-H [6]
. -./... I I. I 1.
1. ow& , 15 1" , it
...,L,
A ri" , C 4-4
$
t, * it
ta,.•
4: SKI
Figure 1-G [8]
4 ,
a - •
6
1.2 Purpose
Among the above examples, using glass balls as refracting materials not only improves indoor lighting but it is also effective as ornament. Therefore, I considered this method to be optimal for improving the lighting environment in public spaces and commercial spaces.
The purpose of this study is to propose skylights that refract and diffuse direct sunlight using glass balls. In addition, the performances of the skylights are analyzed using computational simulation analysis.
However, there is a problem analyzing skylights that use refractive materials.
The lighting analysis tool generally used in the field of building environmental engineering is
"Radiance" . The algorithm of "Radiance" is Radiosity [9]. Radiosity is a lighting algorithm to calculate lighting effect by only reflection and diffuse reflection of light . Therefore, diffuse reflection of light can be analyzed, but refraction of light cannot be analyzed [10] . For this reason, we cannot analyze lighting performance of skylights using refractive materials with this method . In this study, "Exposure lighting analysis" is used for lighting analysis. This is a lighting analysis tool add-on for 3 dsMax which has been validated in a collaborative effort between the National Research Council Canada (NRC), Harvard University and Autodesk [11]. This lighting analysis algorithm is Mental Ray's photon mapping [12]. Therefore, it is possible to analyze phenomena (caustics) in which light refracts and transmits through transparent substances such as glass. For this reason, it is possible to analyze the phenomenon of direct sunlight entering the glass balls and refracting and diffusing.
This paper examines the lighting performances of skylights using glass balls and the practicality of the skylights for buildings, mainly commercial facilities. In addition, considering a relationship between reflectance and value of color [13], this research examines how the color of the interior material affects the lighting performance of the skylights.
7
2. Methods
2.1 Creating Analysis Models
Software : Rhinoceros 5 (Robert McNeel & Associates)
2.1.1 Settings of Analysis Space and Skylight
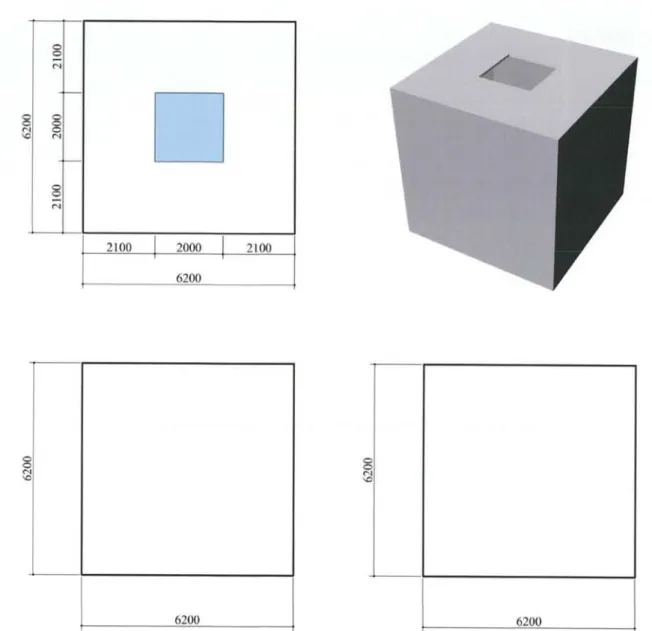
First, analysis spaces were set. Figure 2-A indicates an analysis space model. The inside dimensions of the model are 6 meters width, depth and height. A skylight is placed at the center of the top surface of the model. Figure 2-B indicates a section view of the model and a detail of the skylight. The skylight is composed of double 3 mm thick sheets of glass.
(In this analysis, a detailed structure of the window is simplified for analysis. The structure of the skylight is not considered.)
8
8
2000 6200
ry~~
8 tN
6200 6200
Figure 2-A. Draft of the Analysis Model
9
^
6200
^ ^
- ^^ -
Pp 2000 20002000IS)
;7:
Figure 2-B. Section View of the Model
10
2.1.2 Modeling Skylights with 4 Different Patterns
In this research, four different skylights were modeled. They are as follows.
• •
•
•
A Skylight without Glass Balls
A Skylight with One Layer of Glass Balls A Skylight with Two Layers of Glass Balls A Skylight with Three Layers of Glass Balls
Figure 2-C-1 to Figure 2-C-4 indicate the 4 different types skylights. The first(2-C-l) is a skylight without glass balls. The second one(2-C-2) is a skylight with one layer of glass balls , each with a radius of 10 mm. The third one (2-C-3) is a skylight with two layers of the glass balls. The fourth one (2-C-4) is a skylight with three layers of the glass balls.
11
.,
,l
•I.'
Figure 2-C-1 Figure 2-C-2
> .F
> . ~,
A
z
LLJJk'~'yt-ti'$j~} .;'.
.'.',",.
t*4~
V\.,,
....k4
,e.ck:.i,41
'...L'
6,,,, ,
,‘,,sy„,-1 ,,,
,x-,:k* * a s
.
):1`T. e1,Ycx~„_"a~:
'->: v;
Figure 2-C-3 Figure 2-C-4
12
2.2 Settings for Analysis
Software: Autodesk 3 dsMax 2017
2.2.1 Material Settings
Materials of the models were set up in Mental Ray Arch & Design software.
2.2.1.1 Material Setting of Glass Balls and Skylight's Glass
Table 2-1 shows the material setting of the glass balls and skylight's glass. This on a template of "Glass (Physical)" in Mental Ray Arch & Design. In addition number of refractions were increased for accurate analysis.
Table 2-1. Material Setting - Glass
setting is based , the maximum
Main Material Parameters Diffuse Reflected Light
Diffuse Level Color
Roughness
R:0.5 G:0.5
0.0 B:0.5
0.0 Reflection
Reflectivity Color Glossiness
R:1.0 G:1.0
1.0 B:1.0
1.0 Refraction
Transparency Color Glossiness IOR
R:1.0 G:1.0
1.0 B:1.0
1.0 1.54 Advanced Rend ering O Lions
Advanced Transparency Glass • Translucency
Refraction - Max Trace Depth Transparent Objects
Solid 100 Generate Caustics
13
2.2.1.2 Material Setting of Floor, Walls and Ceiling
In this research, in order to examine how the color of the interior material affects the lighting performance of the skylights, six materials with a different value of color and glossiness were created and the results of using each material as structures (floor, walls and ceiling) were compared. The six materials are as follows.
• Matte — White
• Matte — Gray
• Matte — Black
• Glossy -- White
• Glossy — Gray
• Glossy — Black
From Table 2-2-1 to Table 2-2-6 show the detailed settings of the frames. These setting are based on templates of "Matte Finish" and "Glossy Finish" in Mental Ray Arch & Design.
Table 2-2-1. Material Setting - Structure-Matte-Gray
Main Material Parameters Diffuse Reflected Light
Diffuse Level Color
Roughness
R:0.5 G:0.5
1.0 B:0.5 0.2 Reflection
Reflectivity Color Glossiness
R:1.0 G:1.0
0.0 B:1.0
0.9 Refraction
Transparency Color Glossiness
IOR
R: I.0 G:1.0
0.0 B:1.0 0.0
1.00
14
Table 2-2-2. Material Setting - Structure-Matte-White
Main Material Parameters Diffuse Reflected Light
Diffuse Level Color
Roughness
R:0.8 0:0.8
1.0 B:0.8 0.2 Reflection
Reflectivity Color Glossiness
R:1.0 G:1.0
0.0 B:1.0
0.9 Refraction
Transparency Color Glossiness IOR
R:1.0 G:1.0
0.0 B:1.0
0.0 1.00
Table 2-2-3. Material Setting - Structure-Matte-Black
Main MateriaI Parameters Diffuse Reflected Light
Diffuse LeveI Color
Roughness
R:0.2 G:0.2
1.0 B:0.2
0.2 Reflection
Reflectivity Color Glossiness
R:1.0 G:1.0
0.0 B:1.0
0.9 Refraction
Transparency Color Glossiness IOR
R:I.0 G:1.0
0.0 B:1.0
0.0 1.00
Table 2-2-4. Material Setting - Structure-Glossy-Gray
Main Material Parameters Diffuse Reflected Light
Diffuse Level Color
Roughness
R:0.5 G:0.5
1.0 B:0.5
0.0 Reflection
Reflectivity Color Glossiness
R:1.0 0:1.0
0.75 B:1.0 0.9 Refraction
Transparency Color Glossiness IOR
R:1.0 0:1.0
0.0 B:I.0
0.0 1.00
15
Table 2-2-5. Material Setting - Structure-Glossy-White
Main Material Parameters Diffuse Reflected Light
Diffuse Level Color
Roughness
R:0.8 G:0.8
1.0 B:0.8
0.0 Reflection
Reflectivity Color Glossiness
R:1.0 G:1.0
0.75 B:1.0 0.9 Refraction
Transparency Color Glossiness
IOR
R:1.0 G:1.0
0.0 13:1.0 0.0 1.00
Table 2-2-6. Material Setting - Structure-Glossy-Black
Main Material Parameters Diffuse Reflected Light
Diffuse Level Color
Roughness
R:0.2 G:0.2
1.0 B:0.2
0.0 Reflection
Reflectivity Color Glossiness
R:1.0 G:1.0
0.75 B:1.0 0.9 Refraction
Transparency Color Glossiness IOR
R:1.0 G:1.0
0.0 B:1.0
0.0 1.00
16
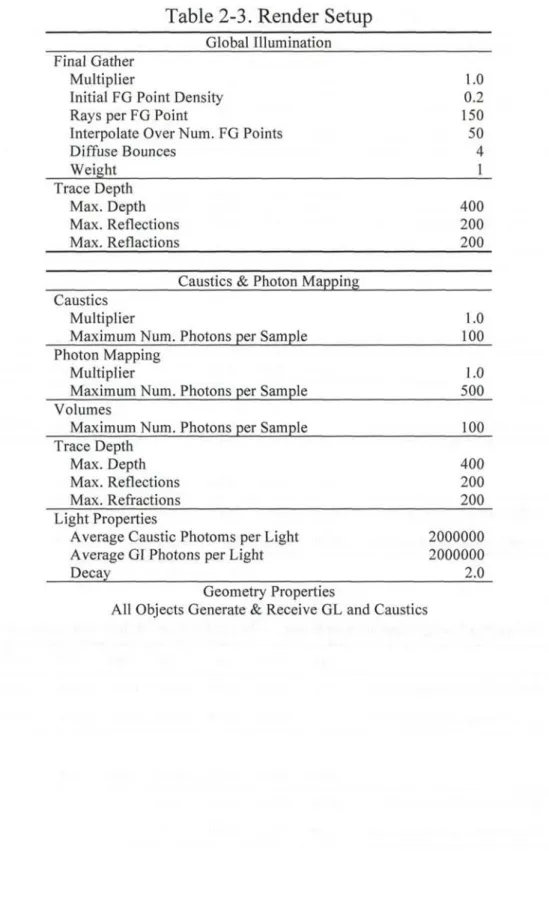
2.2.2 Algorithm Setting
Table 2-3 shows the algorithm setting in this research. The setting of Final Gather was based on a tutorial of lighting analysis in 3dsMax 2017. (Final gather is a technique for estimating global illumination for a given point by either sampling a number of directions over the hemisphere over that point, or by averaging a number of nearby final gather points [14] .) In addition, to be as close to reality as possible, the maximum numbers of reflections and refraction were increased . As for
photon mapping, Trace Depth and the number of photons were increased.
2.2.3 Setting of Sunlight
In this research, weather data on the website of the US Department of Energy was used for the lighting analysis [15].
2.2.3.1 Setting of Measurement Area
The measurement area is Hyakuri airfield in Ibaraki that is the nearest area to Tokyo in all measurement area.
2.2.3.2 Setting of Measurement Dates and Times
The analysis was done for three times of the year, spring, summer and winter . The measurement times are for Sunny days (the days when direct normal illuminance is high) before and after the summer solstice, spring equinox and winter solstice. The measurement dates are as follows .
• Measurement Date — Spring: March 20
• Measurement Date — Summer: June 22
• Measurement Date — Winter: December 21
The analysis times are every hour from 6 a.m. to 6 p.m. on the dates. Table 2-4 shows the sunlight data of measurement dates in the area.
17
Table 2-3 . Render Setup
Globa 1 Illumination Final Gather
Multiplier
Initial FG Point Density Rays per FG Point
Interpolate Over Num. FG Points Diffuse Bounces
Weight
1.0 0.2 150 50 4 1 Trace Depth
Max. Depth Max. Reflections Max. Reflactions
400 200 200 Caustics & Photon Mannin
Caustics Multiplier
Maximum Num. Photons er Sample
1.0 100 Photon Mapping
Multiplier
Maximum Num. Photons er Sample
1.0 500 Volumes
Maximum Num. Photons er Sample 100
Trace Depth Max. Depth Max. Reflections
Max. Refractions
400 200 200 Light Properties
Average Caustic Photoms per Light Average GI Photons per Light
Decay
2000000 2000000 2.0
Geometry Properties
All Objects Generate & Receive GL and Caustics
18
Table 2-4 : Sunlight Data for Anal ysis
EnergyPlus Energy Simulation Software : TOKYO Hyakuri Summer - June 22
6:00 7:00 8:00 9:00 10:00 11:00 12:00
Diffuse Horlz: Illuminance(lx) Direct Normal: Illuminance(lx)
24400 14200
25000 5800
39600 6400
45400 4000
49100 6000
51300 6100
40000 61900
13:00 14:00 15:00 16:00 17:00 18:00
Diffuse Hor1z: Illuminance(lx) Direct Normal: Illuminance(lx)
24000 79400
23800 73000
21800 62900
22000 31900
8600 0
1100 0
EnergyPlus Energy Simulation Software : TOKYO Hyakuri : Spring - March 20
6:00 7:00 8:00 9:00 10:00 11:00 12:00
Diffuse Horlz: Illuminance(Ix) Direct Normal: l]luminance(Ix)
5100 0
16700 4200
26900 8900
38500 6800
45400 6900
42500 4300
39600 27300
13:00 14:00 15:00 16:00 17:00 18:00
Diffuse Horlz: Illuminance(lx) Direct Normal: Illuminance(lx)
42700 26100
24300 59900
14400 65100
13100 25900
2100 0
0 0
EnergyPIus Energy Simulation Software : TOKYO Hyakuri : Winter - December 21
6:00 7:00 8:00 9:00 10:00 11:00 12:00
Diffuse Horlz: Illuminance(lx) Direct Normal: Illuminance(lx)
100 0
5500 6000
13400 32700
16500 55100
15000 68600
13900 76500
12800 76300
13:00 14:00 15:00 16:00 17:00 18:00
Diffuse Horlz: Illuminance(lx) Direct Normal: Illuminance(lx)
17300 53000
11300 8700
7400 9700
600 0
0 0
0 0
19
2.2.4 Analysis Method
In this research, two methods were used as representation methods of the analysis results. The first is making images. The second is the measurements and calculations of illuminance.
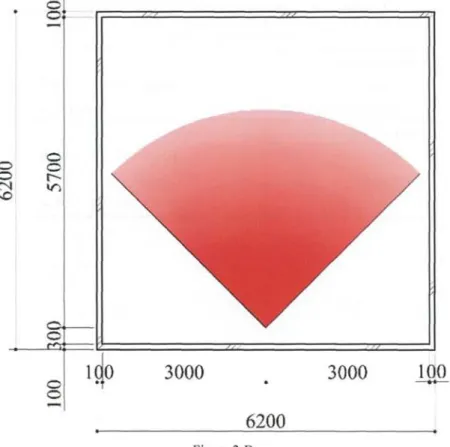
2.2.4.1 Making Images
Figure 2-D indicates a planar image of the camera installation in the model. A camera was installed at 1600 mm above the floor of the indoor space. Using this camera, images of realistic rendered images and illuminance distributions were rendered. Table 2-5 shows the main setting of the camera. Table 2-6 shows the setting of the image output environment.
d C
C E~
(mil
7
l
0
1 aio 3000
6200
3000 100
Figure 2-D
Two types of images, a perspective image and an illuminance distribution image, were made.
Table 2-7-1 shows the setting of exposure control for making the perspective images. Table 2-7-2 shows the setting of exposure control for making the illuminance distribution images.
20
Table 2-5. Setting of the Camera
Free Camera Parameters
Lens FOV
20.0 mm 83.974 deg Environment Range
Near Clip Far Clip
0.0 mm 10000.0 mm
Target Distance 1600.0 mm
Other Settings are Default
Table 2-6. Environment of the Camera
Common Parameters Background
Color
Environment Map
R:0.0 G:0.0 B:0.0 Not Use Global Lighting
Tint Level Ambient
R:1.0
R:0.0
G:1.0
0:0.0
B:1.0 1.0 B:0.0
21
Table 2-7-1 . Exposure Control for Making Images
mr Photographic Exposure Control Exposure
Exposure Value 9.0
Image Control Highlight(Burn) Mid tones Shadows Color Saturation White point Vignetting
0.25 1.0
0.2 1.0 6500 Kelvin
0.0
Physical scale Physical Units: (cd / m2)
Gamma / LUT Settings
Display Gamma Enabled 2.200000
Table 2-7-2. Exposure Control for Making Illuminance Distributions
Pseudo Color Exposure Control
Display Type Quantity Style Scale
Illuminace Colored
Linear Display Range
Min Max
0.0 lx 4000 lx
Physical Scale 1500 cd
22
2.2.4.2 Measurement and Calculation of Illuminance
The second method is to set 121 illuminance measuring points in the space and measure illuminance at each point. Figure 2-E-I and Figure 2-E-2 indicate a planar image and an isometric image of the measurement points' arrangement. Purple circles in Figure 2-E-1 and Figure 2-E-2 are points at which illuminance is measured. Illuminance measurement points were arranged at 500 mm intervals on a floor at a height of 800 mm and illuminance values were measured at each point in the model. Based on the measurement data, the following 4 items were calculated.
•
•
•
•
Maximum Illuminance Minimum Illuminance Average Illuminance Uniformity
Uniformity is the standards [16].
ratio of the minimum illuminance to the average illuminance, based on JIS
• • • • • • • • • • •
• • • • • • • • • • •
• • • • • • • • • • •
5
• • • • • • • • • • •
• • • • • • • • • • •
• • • • • • • • • • •
• • • • • • • • • • •
• • • • • • • • • • •
• • • • • • • • • • •
• • • • • • • • • • •
• • • • • • • • • • •
low sort son 1 .50 50{, 5410. sno 1 =nn r.~ ups i
6200
Figure 2-E-1 Figure 2-E-2
23
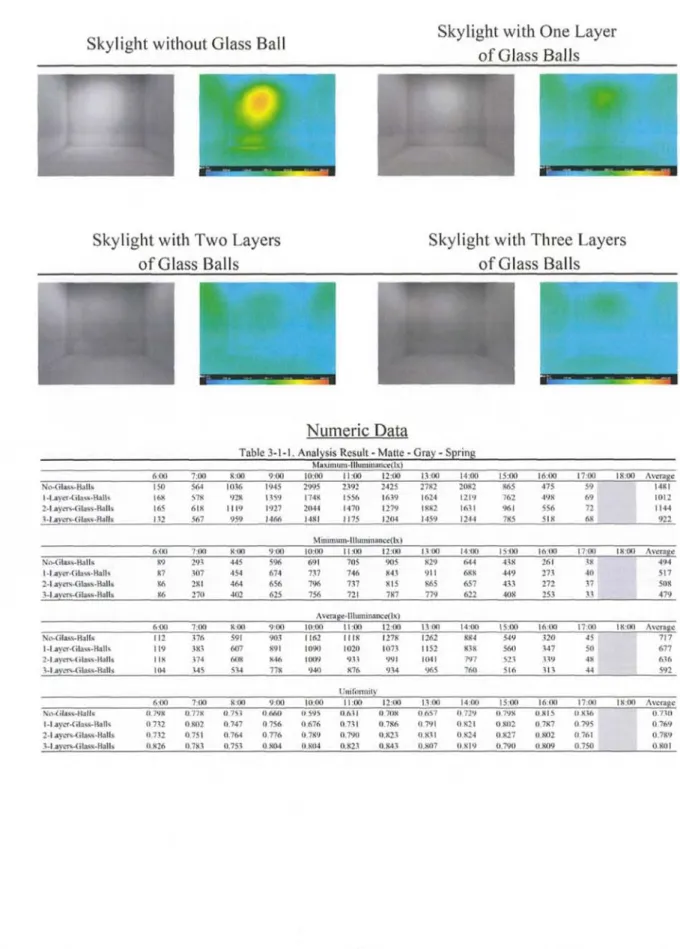
3. Results
The analysis data with each skylight were shown in the following format.
In this chapter, images of realistic rendered images and illuminance distributions at 11 a.m. on each measurement date are shown. Moreover, the above items (Maximum Illuminance, Minimum Illuminance, Average Illuminance and Uniformity) from 6 a.m. to 6 p.m. on each measurement date are shown. The images from 6 a.m. to 6 p.m. and more detailed numeric analysis data are included in chapter 8. Appendices in this paper.
Skylight without Glass BallSkylight with One Layer of Glass Balls
Realistic Rendered
Image
Illuminance Distribution
Realistic Rendered image
Illuminance Distribution
Skylight with Two Layers of Glass Balls
Skylight with Three Layers of Glass Balls Realistic
Rendered Image
Table 3-0.
Illuminance Distribution
Realistic Rendered Image
Numeric Data
Analysis Result - "Rime or GluuA" - "Color" - "tiieaiiireoorin Date'
Illuminance Distribution
\LaIlr um. IIkIlnIMl10Cl Ixi
61507 1k1 51009.011 10 00 11 111 12 1.10 11(10 14 1111 15 1)0 51, (Ml 171X1 IN 1111 Aarra.e
Ir0-1,llrss-I1a111.
1 -Io,--1ilI1.•lialli.
2-1 .-[i1a,.-lt•ll.
1-1 alrraCilr..-RN11.
MuumunrII1um10 001toI
11011 71k1 1S (01 91.111 10101 11 01 12110 11170 1-1 11E1 15 00 11.00 k' 1117 l X 011 Avrra11
NC 1,1ms-LiaIll .Layei •CI Gn.-11X 11s 2 -l.tv.YS-C i IXSr-11a1 ic 1.1 JWTVCi IA44-111111.
A.rTarr-11 iuelrmrwd 1a 1
h 911 7 00 010i 990 111 111. 1 1 111 1 7 1111 11 119 I-I IM 1 co 11.1111 17 IC 1111(1 As era
Ns^•C 1h .t-ISAC, I.1 awl -S.1A.11-11111.
2-LXVCn-1.1[10,-11a11 s .1-Lavcr sd;lsss-llalls
1'19050001
001 7111 011 9.1111 11110 11914 1211[] 11 101 14111 1 5 01 10111 1'10 111011 Amair
No•s114.. Halt.
1-1400-1-51.r..•Rall.
24 s0.0(..1 i1....1ip11s 1-l.55vrl ,.111,1,.•ll a l l,
24
3.1 . Results in Spring
Results with Matte White Material
Skylight without Glass Ball Skylight with
of Glass
One Layer Balls
Skylight with Two Layers of Glass Balls
Skylight with Three Layers of Glass Balls
Numeric Data
Table 3-1-2. Anal sis Result - Matte - White - S rin Ma ximum•I11urinnnce(1x)
6:01) 7:11D 13:011 9:00) 10:0n 11:00 12:00 13: D11 14:1X) i 5.1111 10:00 17:00 1E:00 Averuue
No-Olu s%-Halls f•i ayt r-[ifa~wfid(Is 2-1.ayer%-[i1os.K-Ho110 3-1.jvei .-(ilass•Ha11s
336 355 337 278
1233 II8S) 1I63 1064
2117 1934 2092 1799
3554 2819 3359 2752
5049 3426 3798 31145
4(91 3171 3009 2531
4996 7746 3226 2946
5428 3674 4019 3331
5055 3398 3869 3254
2524 2290 2651 2337
1164 1222 1181 1143
137 14R 141 135
2974 2280 2403 20.51 Minimum• I I l uminuneellx 1
6:0n 7:181 8t011 9:1x) 103x) 11:00 12:00 13:00 14:1x) I5311) 16:1x) 37.04) (6:111) Av
Nn-[ilas%-1;a1144 1-l.4tyer-[ilu449-11a11s 2- l .ay ers-(1 l a%%- )1 11.4s 3-1 .nvers-L ilassls-H al f!s
262 257 240 229
896 866 909 761
1391) 1398 1344 I205
1871 21)22 18941 1900
2250 23118 23118 2246
2149 2274 21)26 21116
3092 2831) 2673 2.367
2926 2949 2696 2471)
2762 2650 2476 2292
1939 1823 1778 1672
915 9410 839 767
114 112 105 93
1714 169#
1599 1495 Avern e-Illuininunce(lx)
6:1x) 7a01 B:01) 9:1x) 10:1x) I I :1x1 12:1111 13:4141 14:f10 15:[x) 16.00 1p191 I8:00 Avers2e
No-[ila%s-13a11%
1 •I.aycr-(11asa-14alla 2-I ayer%-[ilnas-Halls 3-l.avers-thn o-H211s
291 291 282 247
1009 952 9[15 831)
1611 1576 1494 1343
2272 2271 2105 1972
2837 2704 2583 2447
2706 2564 22147 2225
3798 3124 28147 2595
3479 3136 2916 2695
3126 2823 2695 25114
21414 1956 1932 11S65
992 988 9241 959
122 125 117 106
2033 11476 (762 1641 I ;lll lornll ly
6:01) 7:1x3 8:1x) 9:00 10:1X) 11:00 12:1x) 13:4x) 14:1x1 15.10 16:1x) 17'1x1 18:1x3 Average
No-[ilms-13a11ss I -l.aycr-[ ilasa- Hall s 2-l.uycrs-[ ilas%-Ho11y 3 -l.ayen)-[ i1aos-Hallo
0.900 0.8143 41.879 0.929
11.885 0.910 0.1194 0.917
(1.R6)1 11.887 0.899 0.897
4).824 0.990 0.898 0.913
41.793 0.954 11.994 41.919
41.794 0.1487 0.886 0.906
11.811 0.906 0.926 0.9213
0.942 0.909 11.918 0.916
41,884 11.939 0.919 0.915
0.903 0.932 0.920 0.1197
0.922 0.911 0.912 0.1493
0.935 0.898 0.894 0.979
0.864 0.900 0.903 (1.9i16
25