JAXA Special Publication
The Second Open Competition for the Hayabusa Asteroidal Sample
Preliminary Examination Team (HASPET)
Edited by
Tetsuo YAMAMOTO
The Institute of Low Temperature Research, Hokkaido University
Ikuo KUSHIRO
The University of Tokyo (Emeritus)
Akira FUJIWARA and Hajime YANO
The Institute of Space and Astronautical Science, Japan Aerospace Exploration Agency
March 2006
Japan Aerospace Exploration Agency
This document is provided by JAXA.
CONTENTS
Preface: The Second HASPET Open Competition and Its Test Analog Samples
‥‥‥‥‥‥‥‥‥‥‥Tetsuo YAMAMOTO, Ikuo KUSHIRO, Akira FUJIWARA and Hajime YANO ‥‥‥‥ 1
Mineralogy of 100 μg-Powder Test Samples II: Evolved Procedures for the Initial Analysis of Regolith Materials of the Asteroid Itokawa
‥‥‥‥‥‥‥‥‥‥‥Tomoki NAKAMURA, Takaaki NOGUCHI, and Masahiko TANAKA ‥‥‥‥‥‥‥‥ 5
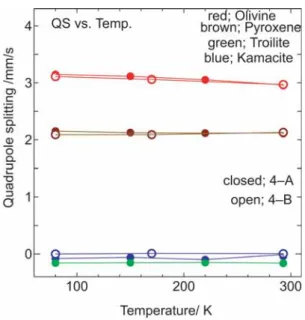
Mössbauer Spectroscopic Characterization of Iron Species in the Test Samples of 4A and 4B for the Second HASPET Competition
‥‥‥‥‥‥‥‥‥‥‥Yoichi SAKAI and Yoshitaka MINAI ‥‥‥‥‥‥‥‥‥‥‥‥‥‥‥‥‥‥‥‥‥75
Test Samples for the Hayabusa Sample Return Mission: Mineralogy and Petrology
‥‥‥‥‥‥‥‥‥‥‥Kazushige TOMEOKA, Ichiro OHNISHI, Naotaka TOMIOKA,
Mitsuhiro SUGITA and Kouji ADACHI ‥‥‥‥‥‥‥‥‥‥‥‥‥‥‥‥‥‥‥‥84
Hayabusa Analogue Samples Using Synchrotron Imaging
‥‥‥‥‥‥‥‥‥‥‥Akira TSUCHIYAMA, Kentaro UESUGI and Tsukasa NAKANO‥‥‥‥‥‥‥‥‥‥102
List of Authors and Co-authors ‥‥‥‥‥‥‥‥‥‥‥‥‥‥‥‥‥‥‥‥‥‥‥‥‥‥‥‥‥‥‥‥‥‥‥146
This document is provided by JAXA.
1. HAYABUSA MISSION UPDATES
Hayabusa has landed and flown again. On the smooth terrain Muses-C Regio of the near Earth asteroid (25143) Itokawa, the Japanese engineering demonstration spacecraft attempted the touch-and-go sampling twice in November 2005 (Yano, et al., 2006).
It was the first sample return mission from another celestial body surface other than the Moon in human history. Due to multiple malfunctions of the attitude control devices, the fate of its successful sampling will not be revealed until the Hayabusa spacecraft can eventually return to the earth.
Since its recovery from temporal communication loss in January 2006, the Hayabusa operation team successfully managed to restore most of the spacecraft capabilities for attitude control by alternatives, to recharge surviving battery cells and to transfer the sample cacther to the Earth return capsule. From the spring of 2007, Hayabusa will reignite its ion engines and manage three-axis stability with one remaining reaction wheel with solar radiation pressure and IES gimbal control. The spacecraft will be then on its way back home in June 2010, three years later than the original plan of the landing on the desert of Australia.
Hayabusa employed an impact sampling system consisted of projectors, a deployable “horn”, cylindrical/conical concentrator to receive and deflect ejected fragments, and a sample catcher, with separate rooms for each sampling, and a transfer mechanism to the capsule (Yano, et al., 2002). During the sampling sequence, as soon as its touchdown is autonomously detected, a Ta metal projectile of 5-g mass is shot at velocity of 300 m/s. Impact of the projectile produces fragment ejecta, which are concentrated through the horn toward the catcher. Expected amount of the samples from results of 1G and microgravity impact tests for monolithic targets, mm-sized pebble/gravel targets and regolith simulants are all around several hundred mg to several g per shot of fine grained particles, rather than large pieces of rocks. Even without firing the projectile, recent microgravity simulations suggested that small amount of slowly uplifted samples might have reached inside the catcher during an unexpected landing of the spacecraft at the MUSES-C Regio about a half hour in the first touchdown.
2. HASPET OPEN COMPETITIONS
JAXA has pledged that, as long as amount of returned samples are enough for such purposes, Itokawa samples will be distributed to qualified researchers all over the world for maximizing its scientific output. However, such detailed analysis proposals must rely on general characteristics of the samples during the initial analysis phase. The Hayabusa Asteroidal Sample Preliminary Examination Team (HASPET) is therefore formed under the Hayabusa Joint Science Team and, should consist of JAXA scientists, NASA and Australian Co-Is based on each bilateral agreement, and Japanese researchers from outsourcing institutions, who are selected in respective disciplines through this open competition scheme.
The HASPET is, in principle, responsible for characterizing general features of the bulk and some of major samples. They
Akira FUJIWARA3, and Hajime YANO3
1 Hokkaido University, Sapporo, Hokkaido, Japan 2 University of Tokyo (Emeritus), Bunkyo-ku, Tokyo, Japan
3 Institute of Space and Astronautical Science, Japan Aerospace Exploration Agency, Sagamihara, Kanagawa, Japan
This document is provided by JAXA.
functioned well for NASA’s cometary coma dust sample return mission STARDUST, which successfully brought cometary dust to ground laboratories in 2006 (Brownlee, et al., 2006).
The first HAPSET competition was conducted in 2000-2001 and the MUSES-C Sample Advisory Committee endorsed the final recommendation in 2002. Among eleven applicants, six teams were recognized as qualified to join the preliminary examination team as of 2002 (Kushiro, et al, 2003). After the spacecraft launch, the second open competition was repeated in 2004-2005 and two teams out of five applicants were recommended for the final HASPET membership by the now-called Hayabusa Sample Advisory Committee in early 2006.
This document is a compilation of some of analysis reports in the second HASPET open competition, permitted to publish by respective applicants. Therefore, each report focuses on specific suitability for general characterization of the returned samples;
yet neither new discoveries nor scientific achievements of the report are objectives of their writing. Instead, the authors demonstrate how much their technical capabilities, analytical precision, and usefulness of the derived results for subsequent detailed analyses are worth being included in the Hayabusa initial analysis. This document may also serve as a source book for JAXA to construct an astromaterial curation and initial analysis facility, which will be completed in 2008.
3. TEST ANALOG SAMPLES
In this round of the competition, each applied team received two kinds of “asteroid sample analogs”, meteoritic samples that no applicant knew what they were in advance, to conduct proposed analysis with self-claimed amount of samples (the maximum of 100 mg each) in self-claimed duration (the maximum of 6 months). This is the same rule as the first competition. One major distinction between the first and the second competitions is that, at the time of their applications, the second round applicants should know that Itokawa is an S-type asteroid (e.g., Fujiwara, et al., 2006) as well as major results of the NEAR-Shoemaker mission to the S-type asteroid Eros (Veverka, et al., 2001). Therefore, the Selection Committee chose a unique H-“ordinary”
chondrite Burnwell as the analog samples at this time.
The simulant samples are kindly provided to JAXA by Dr. E. Jarosewich of the Smithsonian National Museum of Natural History, U.S.A. via Dr. M.E. Zolensky of NASA/JSC, one of the two NASA-selected HASPET members. At first, the samples were separated to two size fractions (ID-A and B) as shown in Table 1 by sieving at the Smithsonian. Then both samples were divided to 100 mg each by only using the Al foils approved by the NASA/JSC Lunar Sample Laboratory, wrapped with them and sealed in a borosilicate glass vial (thus the samples only touched the Al foil but not the interior of vials) by HY at an ISAS clean room for distribution.
The Burnwell meteorite fell as a single stone of 1.504 kg mass in Burnwell, Pike County, Kentucky, U.S.A. (37o37'19"N 82o14'14"W) at 15:45 EDT (19:45 UT) on September 4, 1990. Classification and mineralogy were determined by T. McCoy, R.
Ash, G. Jarosewich and S. Russell at the Smithsonian Institute. According to Russell et al. (1998), this meteorite has lower Fa in olivine (15.8 mol%), Fs in orthopyroxene (13.4 mol%), Co in kamacite (0.36 wt%), FeO from bulk chemical analysis (9.43 wt%), and △17O(0.51 ±0.02 %), and higher Fe, Ni, Co metal (19.75 wt% from bulk wet chemical analysis) than observed in H chondrites. This meteorite plots on extensions of H-L-LL chondrite trends for each of these properties towards more reducing
Catalog Number Sample ID Sieve Mesh Size (μm) Mass Fraction
USNM7073 **A <100 (Small) 78.49 wt%
USNM7073 **B >100 (Large) 21.51 wt%
Table 1: Test Analog Samples Conditions
This document is provided by JAXA.
an equilibrated fall that exhibits no evidence for reduction”.
For these reasons, keys of analyzing these samples are to notice that (1) this is not a typical ordinary chondrite although its spectral information may suggest some similarities to Itokawa (i.e., bright albedo for S-type asteroid) and (2) samples A and B actually came from the same meteorite but sorted by size such that metal percentages may vary between the two samples.
REFERENCES
Brownlee, D., Tsou, P., Aléon, J., Alexander, C.M.O'D., Araki, T., Bajt, S., Baratta, G.A., Bastien, R., Bland, P., Bleuet, P., Borg, J., Bradley, J.P., Brearley, A., Brenker, F., Brennan, S., Bridges, J.C., Browning, N.D., Brucato, J.R., Bullock, E., Burchell, M.J., Busemann, H., Butterworth, A., Chaussidon, M., Cheuvront, A., Chi, M., Cintala, M.J., Clark, B.C., Clemett, S.J., Cody, G., Colangeli, L., Cooper, G., Cordier, P., Daghlian, C., Dai, Z., D'Hendecourt, L., Djouadi, Z., Dominguez, G., Duxbury, T., Dworkin, J.P., Ebel, D.S., Economou, T.E., Fakra, S., Fairey, S.A.J., Fallon, S., Ferrini, G., Ferroir, T., Fleckenstein, H., Floss, C., Flynn, G., Franchi, I.A., Fries, M., Gainsforth, Z., Gallien, J.-P., Genge, M., Gilles, M.K., Gillet, P., Gilmour, J., Glavin, D.P., Gounelle, M., Grady, M.M., Graham, G.A., Grant, P.G., Green, S.F., Grossemy, F., Grossman, L., Grossman, J.N., Guan, Y., Hagiya, K., Harvey, R., Heck, P., Herzog, G.F., Hoppe, P., Hörz, F., Huth, J., Hutcheon, I.D., Ignatyev, K., Ishii, H., Ito, M., Jacob, D., Jacobsen, C., Jacobsen, S., Jones, S., Joswiak, D., Jurewicz, A., Kearsley, A.T., Keller, L.P., Khodja, H., Kilcoyne, A.L.D., Kissel, J., Krot, A., Langenhorst, F., Lanzirotti, A., Le, L., Leshin, L.A., Leitner, J., Lemelle, L., Leroux, H., Liu, M-C., Luening, K., Lyon, I., MacPherson, G., Marcus, M.A., Marhas, K., Marty, B., Matrajt, G., McKeegan, K., Meibom, A., Mennella, V., Messenger, K., Messenger, S., Mikouchi, T., Mostefaoui, S., Nakamura, T., Nakano, T., Newville, M., Nittler, L.R., Ohnishi, I., Ohsumi, K., Okudaira, K., Papanastassiou, D.A., Palma, R., Palumbo, M.E., Pepin, R.O., Perkins, D., Perronnet, M., Pianetta, P., Rao, W., Rietmeijer, F.J.M., Robert, F., Rost, D., Rotundi, A., Ryan, R., Sandford, S.A., Schwandt, C.S., See, T.H., Schlutter, D., Sheffield-Parker, J., Simionovici, A., Simon, S., Sitnitsky, I., Snead, C.J., Spencer, M.K., Stadermann, F.J., Steele, A., Stephan, T., Stroud, R., Susini, J., Sutton, S. R., Suzuki, Y., Taheri, M., Taylor, S., Teslich, N., Tomeoka, K., Tomioka, N., Toppani, A., Trigo-Rodríguez, J.M., Troadec, D., Tsuchiyama, A., Tuzzolino, A.J., Tyliszczak, T., Uesugi, K., Velbel, M., Vellenga, J., Vicenzi, E., Vincze, L., Warren, J., Weber, I., Weisberg, M., Westphal, A.J., Wirick, S., Wooden, D., Wopenka, B., Wozniakiewicz, P., Wright, I., Yabuta, H., Yano, H., Young, E.D., Zare, R.N., Zega, T., Ziegler, K., Zimmerman, L., Zinner, E. and Zolensky, M., 2006, Comet 81P/Wild 2 Under a Microscope, Science, 314, 1711-1716.
Fujiwara, A., Kawaguchi, J., Yeomans, D.K., Abe, M., Mukai, T., Okada, T., Saito, J., Yano, H., Yoshikawa, M., Scheeres, D.J., Barnouin-Jha, O., Cheng, A.F., Demura, H., Gaskell, R.W., Hirata, N., Ikeda, H., Kominato, T., Miyamoto, H., Nakamura, A.M., Nakamura, R., Sasaki, S. and Uesugi, K., 2006, The rubble-pile asteroid Itokawa as observed by Hayabusa, Science, 312, 1330-1334.
Kushiro, I., Fujiwara, A. and Yano, H (eds.), 2003, The First Open Competition for the MUSES-C Asteroidal Sample Preliminary Examination Team, ISAS Report SP-16.
Russell, S.S., McCoy, T.J., Jarosewich, E. and Ash, R.D., 1998, The Burnwell, Kentucky, low-FeO chondrite fall: Description, classification and origin, Meteoritics and Planetary Science, 33, 853-856.
Veverka, J., Thomas, P.C., Robinson, M., Murchie, S., Chapman, C., Bell, M., Harch, A., Merline, W.J., Bell III, J.F., Bussey, B.,
This document is provided by JAXA.
NEAR: Evidence for a Complex Regolith, Science, 292, 484-487.
Yano, H., Hasegawa, S., Abe, M. and Fujiwara, A., 2002, Asteroidal surface sampling by the MUSES-C spacecraft, Proc.
Asteroids, Comets and Meteors 2002, ESA SP-500, 103-106.
Yano, H., Kubota, T., Miyamoto, H., Okada, T., Scheeres, D., Takagi, Y., Yoshida, K., Abe, M., Abe, S., Barnouin-Jha, O.S., Fujiwara, A., Hasegawa, S., Hashimoto, T., Ishiguro, M., Kato, M., Kawaguchi, J., Mukai, T., Saito, J., Sasaki, S. and Yoshikawa, M., 2006, Touch-down sites of the Hayabusa spacecraft at the Muses Sea area on asteroid 25143 Itokawa, Science, 312, 1350-1355.
This document is provided by JAXA.
Tomoki NAKAMURA1, Takaaki NOGUCHI2, and Masahiko TANAKA3
Abstract: Applying a combined analytical method specialized for cosmic-dust research, we have characterized mineralogy of individual mineral particles in 2A and 2B powder test samples that were prepared for the second analysis competition of the Hayabusa mission. Thirty-eight mineral particles mostly less than 300 μm in diameter and ten fine-grained mineral aggregates less than 200 μm in diameter were picked out from the test samples.
Individual samples were X-rayed using synchrotron radiation to have powder X-ray diffraction patterns for identification of constituent minerals. The relative abundances of major constituent minerals in individual samples were determined by applying the Rietveld refinement to diffraction patterns. The X-rayed samples were polished and analyzed by a scanning electron microscope (SEM) for imaging and an electron-probe microanalyzer (EPMA) for quantitative concentrations of thirteen elements. Finally, ten selected samples were thinned by ultramicrotomy, argon ion bombardment, or focused ion beam (FIB) method for detailed mineralogical characterization by transmission electron microscopy (TEM). Small plagioclase compositions are determined by analytical electron microscopy (AEM) using a cold sample stage. The bulk mineralogy, chemical composition, and nano-scale textures were all obtained from a single small particles less than 300 μm and the total mass of each test sample we used for the present study was only 100 μg. Therefore, we can accomplish complete mineral characterization using very small quantity of regolith materials of the asteroid Itokawa, when the initial analysis of the returned samples is undertaken.
The results showed that 2A powder sample consists mainly of olivine (Fa15.1±0.6 on an average), low-Ca pyroxene (Fs13.9±0.7on an average), plagioclase, troilite, and kamacite with minor amounts of high-Ca pyroxene, taenite, chromite, Ca-phosphate, and alkali feldspar. The compositions and compositional variations of silicates and the minor element abundances in FeNi metals indicate that the 2A sample bears a close resemblance to H chondrites with petrologic type 4 to 5. Fe/Mg ratios of both olivine and low-Ca pyroxene in the 2A sample correspond to the lowest-end of Fe/Mg variation for H chondrites, suggesting that it is a sample of most reduced type of H chondrites.
In addition, the 2A samples contain small amounts of artificial contamination such as quartz-calcite composites, Ni- free Mn-bearing iron metals, and carbonaceous particles like epoxy resin. These particles probably got mixed during preparation of the 2A sample powder from a meteorite. The 2B sample is coarse particles that are composed mainly of metallic phases such as kamacite. Olivine and low-Ca pyroxene are also contained, but metal/silicate ratio of the 2B test sample is apparently higher than that of the 2A test sample. However, Mg/Fe ratios of silicate (Fa15.8±0.5 and Fs14.4±0.7on an average) and the presence of well-defined chondrules suggest that the 2B sample is also similar to H chondrites with petrologic type 4 to 5. All mineralogical characteristics, except for the mode of occurrence of FeNi metals, are very similar between 2A and 2B test samples. This may indicate that the two test samples were prepared from the same meteorite. The high metal/silicate ratio of the 2B test sample is therefore artifact, most probably the
1 Department of Earth and Planetary Sciences, Faculty of Sciences, Kyushu University, Hakozaki, Fukuoka 812-8581, Japan 2 Department of Materials and Biological Sciences, Ibaraki University, Bunkyo 2-1-1, Mito, Ibaraki 310-8512, Japan 3 WEBRAM, National Institute for Materials Science, SPring-8, Kouto Mikazuki-cho 1-1-1, Sayo-gun, Hyogo 679-5198, Japan
This document is provided by JAXA.
Surface materials of the asteroid Itokawa will be collected in 2005 and recovered to the Earth in the summer of 2007, only two years ahead from the present. The recovered samples will be powders consisting of particles ranging in size from submicron to submillimeter, analogous to cosmic dust and fine-grained constituents of brecciated regolith meteorites. Characterization of fine particles is extremely difficult and differs completely from that of coarse-grained crystalline meteorites. In addition, individual particles on the asteroidal regolith are not always fragments of the host asteroid, because many particles from other asteroids and comets are deposited there, as is commonly observed in many meteorites from the asteroidal regolith. Ultimately, individual particles in the powder regolith samples are different in origin. Therefore, the powder regolith samples need to be characterized on particle-basis, like characterization of cosmic dust such as micrometeorites and interplanetary dust particles. According to above principles of characterization, we set goals of the mineralogical investigation of the powder regolith samples: (1) evaluation of basic mineralogy of the host asteroid, and (2) identification of foreign particles coming from other planetary bodies. In the present paper, we have characterized powder test samples 2A and 2B to uncover these two essential properties.
As we claimed in the previous report (Nakamura and Noguchi, 2003), the amounts of the test samples allocated to us were very large, which is never expected for the initial characterization of the true sample recovered from the asteroid Itokawa. The most important point we think for the initial characterization is to characterize mineralogy using minimum quantity of the samples.
From this viewpoint, only small amounts of test samples, less than 100 μg of each test sample, were used for our characterization and most parts of the samples were left unprocessed. Thus, the remaining samples can be provided for other scientific purposes.
Our mineralogical techniques applied in the present investigation are those developed mainly for characterization of Antarctic micrometeorites (Nakamura et al., 1999; 2001a; 2001b; 2003; Noguchi and Nakamura, 2000; Noguchi et al., 2002; Nakashima et al., 2003). A main protocol of the analysis for a single particle consists of synchrotron X-ray diffraction technique for bulk mineralogy and transmission electron microscopy for detailed mineralogy.
2. SAMPLES AND EXPERIMENTAL PROCEDURES
2.1. Sample selection and preparation
2A test sample is a powder, consisting of a variety of minerals and mineral composites ranging in size from submicron to 300 μm. We have picked out twenty eight single particles from 50 to 300 μm in diameter showing different optical characteristics under a high-resolution stereomicroscope. These coarse particles are referred hereafter as 2AC1 to 2AC28. For very fine particles, we gathered them using a small amount of acetone-soluble resin on the top of a thin glass fiber to make a fine-grained mineral aggregate. Ten aggregates were prepared from the 2A test sample and referred hereafter as 2AF1 to 2AF10.
2B test sample is also a powder but consists of relatively coarse particles ranging from 100 to 800 μm in diameter. We selected 10 particles showing different optical characteristics and hereafter refer them as 2BC1 to 2BC10. Analyses of multiple disciplines were performed on these 48 particles, 38 from the 2A sample and 10 from the 2B sample, and the experimental procedures for each sample particle are summarized in Table 1.
2.2. Synchrotron X-ray diffraction analysis
Synchrotron radiation was applied for X-ray diffraction analysis of individual sample particles, because strong synchrotron X- rays, whose intensity is higher at least three orders of magnitudes than that of a normal X-ray generator, induce strong diffractions from small minerals in a sample particle. The experiment was performed at the beam line 3A of the Photon Factory, High energy accelerator research organization, Tsukuba, Japan. A gandolfi X-ray camera, which can obtain a powder X-ray pattern from a single mineral particle with diameters from 5 to 500 μm, was used for the analysis. The synchrotron X-ray was monochromated to
This document is provided by JAXA.
2.161 +/- 0.002 Å using a monochromator and focused at the sample particle in the gandolfi camera using a focusing mirror. The wavelength of X-ray was precisely determined from a diffraction pattern of a standard Si particle. The monochromated X-ray gives sharp X-ray reflection peaks with very low background level. Each sample particle was mounted on a thin glass fiber with 5 μm in diameter with a very small amount of glue and exposed to synchrotron X-ray for 10 to 40 minutes, depending on the size of the particle.
The diffracted X-rays from samples are recorded on a high-resolution imaging plate (IP) set in the gandolfi camera. IP has a wide dynamic range of recordable X-ray intensity compared with films and shows a better linearity between X-ray intensity and blackness on the IP. We had used films in the previous report (Nakamura and Noguchi, 2003), but in the present report we successfully utilizes IP. After exposure to X-ray, IP was scanned by an IP reader BAS 2500 with angle resolution of 0.05°. The read data were converted to diffraction patterns and analyzed for integrated intensities and peak center positions of diffractions using an original software GanCon2 that we have developed.
2.3 Rietveld analysis
The relative abundances of the major four crystalline minerals, olivine, low-Ca pyroxene, plagioclase and troilite, in 2AF1 to 2AF10 samples were obtained through the Rietveld quantitative phase analysis of the powder X-ray diffraction data. In the multi- phase Rietveld refinement, the scale factors are in proportion to the amount of included crystalline phases. And the mass weight ratio is calculated from a following formula,
xn= ( snZnMnVn) / ( ΣisiZiMiVi)
Where x is the mass weight ratio, s is the scale factor, Z is the chemical number, M is the molecular weight and V is the unit cell volume. The mass weight ratio is determined by evaluation of s values with Rietveld method. The Rietveld structure refinement program, PFLS (Toraya, 1998), was used for Rietveld analysis and this program carries out the quantitative phase analysis, above- mentioned method, as structure refinements. In principle, when quantitative phase analysis by Rietveld method is carried out, all of the component minerals in the sample should be included in calculation. But in this analysis the minor minerals, such as kamacite or taenite, were neglected. Because the amounts of these minerals are little and if these minerals were included in refinement calculation, the refinement cycles had not been convergence and solutions could not be obtained. Starting crystal structure models for each mineral were obtained from references (Morimoto and Guven, 1970, Prewitt et al., 1976, Tokonami et al., 1972, Birle et al., 1968). Isotropic temperature factors, which were also adopted from the same references, were used and the values were fixed through out the refinements. The chemical compositions determined by EPMA analysis were used and these values also fixed through out refinements. The chemical compositions of each crystalline phase were assumed to be homogeneous.
As concerns olivine, pyroxene and plagioclase, the scale factors, the lattice constants, the atomic positions and the peak profile parameters were refined. But in troilite case, the scale factor was only refined. The Rietveld least square cycles were also hard to
2AC27 ~ 2AC28 ○ ○
2AF1 ~ 2AF5 ○ ○ ○ ○ ultramicrotomy
2AF5 ~ 2AF10 ○ ○ ○ ○ ○
2BC1 ~ 2BC5 ○ ○ ○ ○
2BC6 ~ 2BC7 ○ ○ ○ ○ ○ Ar bombardment
2BC8 ~ 2BC9 ○ ○ ○ ○ Ar bombardment
2BC10 ○ ○ FIB
* synchrotron X-ray diffraction
# optical microscope
This document is provided by JAXA.
assumptions such as neglect of minor minerals, neglect of variation of chemical composition of each mineral phase, use of estimated absorption coefficient and neglect of difference of crystal quality of each mineral phase and so on.
2.4. EPMA analysis
The X-rayed sample particles were embedded in a small amount of epoxy resin and polished using the micro-diamond paste, and analyzed by an EPMA (JEOL JXA-733 superprobe) equipped with a wave-length-dispersive X-ray spectrometer (WDS).
WDS quantitative analyses were performed at 15 kV accelerating voltage and 10 nA beam current with a focused beam 2 μm in diameter. Quantitative chemical compositions of oxides SiO2, TiO2, Al2O3, FeO, MnO, MgO, CaO, NaO, K2O, Cr2O3, NiO, P2O5, and SO3 for silicates and elements Ni, Fe, Mn, Co, Cr, S, and P for sulfides and metals were obtained via the ZAF correction method. Special care was taken for the analysis of FeNi metals. In the analysis of FeNi metals, Co concentrations were obtained through correction of Fe-Kß contribution on Co-Kα. The X-ray energy of Fe-Kß is very close to that of Co-Kα, therefore the contribution from Fe-Kß need to be corrected especially for the minerals rich in Fe such as FeNi metals. We analyzed pure Fe metal and found that the contribution of Fe-Kß from 100% Fe on Co abundance is 0.15 wt%. We corrected Co concentrations of FeNi metals in both 2A and 2B test samples according to the Fe content in the metals.
2.5. TEM observation 2.5.1. Sample preparation
Subsequent to X-ray diffraction analysis, selected samples were processed to have thin plates for TEM observation. Three methods for thinning were applied, ultramicrotomy, Ar ion bombardment, and focused Ga ion beam sputtering (Table 1). The former was applied for fine-grained samples of 2AF1 to 2AF5. The latter two methods were applied for metal-rich coarse 2B samples, 2BC6, 2BC7, 2BC8, 2BC9, and 2BC10.
Ultramicrotomy:A sample made of fine-grained mineral fragments bounded of acetone soluble resin were disaggregated on one sharp end of a rod made of consolidated EMbed 812 epoxy resin by a small drop of acetone. After disaggregation of the fine- grained fragments, the fragments were covered by a small drop of epoxy resin. The sample was cured at 70 oC for 48 hrs.
Embedding was performed in a clean bench (class 100) set in a clean room (class 1000) at Ibaraki University to prevent contaminant mixing with the sample. The cured samples were microtomed by Leitz-Reihert Super Nova ultramicrotome. The thickness of each section was ~ 70 nm. Only one ultra-thin section among serial sections on a Cu grid was used to prevent multiple analyses of the same mineral grains. TEM observation of the ultramicrotomed sample revealed that one section contains more than 150 individual grains.
Ar ion bombardment:Conventional Ar bombardment method was used for coarse 2B test samples (Table 1). Four samples were prepared by using this method. Polished thin sections of the samples were demounted from glass slides after EPMA analysis.
The demounted samples were attached to single-hole Mo grids by epoxy resin. Argon bombardment was performed by using GATAN model 600 ion milling machine. Accelerating voltage and current were 2.5 kV and 1.0 mA.
Focused Ga ion beam sputtering:FIB thining system (Hitachi FB 2000) was applied for the TEM sample preparation of 2BC10 that consists mainly of FeNi metal. The FIB is an appropriate method for thinning a sample with a variety of mineralogy.
Gallium ion beam with accelerating voltage 30 KeV and beam current 9.5 μA has exposed on a thin sample slice that was placed on a single-hole Mo grid. The thickness of the sample slice before FIB sputtering was 20 μm and that of the sputtered sample was approximately 100 nm with an area of 10 x 10 μm. The thinning takes 5 hours to complete.
This document is provided by JAXA.
dispersive X-ray spectrometer. Although the analysis was based on Cliff-Lorimer approximation, the effects by absorption were considered by regarding k factors. K factors have been already determined by one of the authors (T. Noguchi) using many mineral standards. For K factors of silicate analysis, we determined 12 factors. K factors for Na, Mg, Al, Cl, K, Ca, and Fe were determined by using ultramicrotomed mineral standards. K factors for S, Ti, Cr, Mn, and Ni were determined by using ion thinned mineral standards. K factors for Fe-Ni metals and sulfides were determined by using ultramicrotomed mineral standard.
For the analysis of feldspar minerals in the fine-grained 2AF series samples, we used liquid nitrogen cooled analytical stage, Gatan model 633. The sample was cooled to -173 oC during observation and analysis of feldspars. As shown later, the cooling greatly lessens the compositional change of feldspars during analysis and the decomposition rates of crystal structures during observation under high magnifications.
3. RESULTS OF ANALYSIS
The results of SEM observation, EPMA analysis, and X-ray diffraction analysis of all sample particles except for 2BC10, which was examined only by TEM, are summarized in Appendix so as to show textural, mineralogical, and compositional characteristics of individual samples.
3.1. 2A test sample - host mineralogy
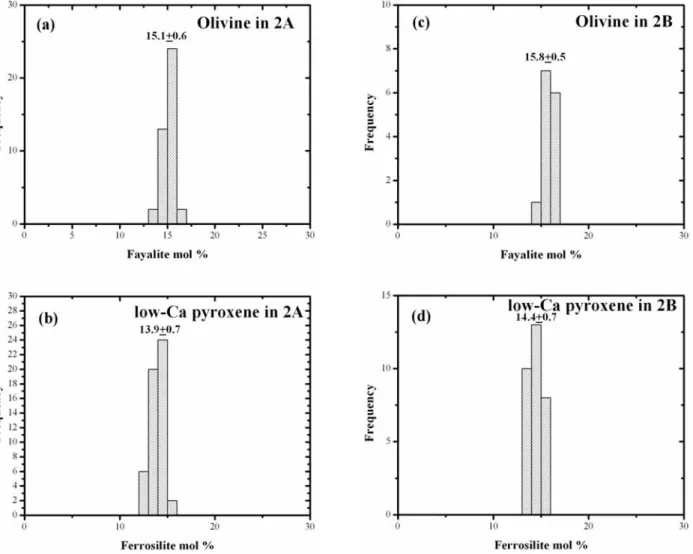
Coarse particles, 2AC1 to 2AC28, show a variety of mineralogical properties. Only 8 particles are dominated by a single phase (see Appendix): olivine (2AC10, 2AC24, and 2AC25), troilite (2AC7 and 2AC8), kamcite (2AC1 and 2AC15), and taenite (2AC18). The presence of the single-phase particles indicates that the largest crystal size of these minerals exceeds 100 μm. The other 20 particles are composites of several kinds of minerals. Among 28 sample particles, most abundant mineral is olivine and next is low-Ca pyroxene. Olivine has a homogeneous Fe/Mg ratio with Fa 15.1 ±0.6 (Fig. 1a). CaO and MnO concentrations in olivine are less than 0.1 wt% and from 0.4 to 0.6 wt%, respectively (Fig. 2a). Low-Ca pyroxene also has a homogeneous Fe/Mg ratio with Fs 13.9 ±0.7 (Fig. 1b). But Ca/(Mg+Fe) ratio is not homogenized between grains (Fig. 3a). Both MnO and Cr2O3
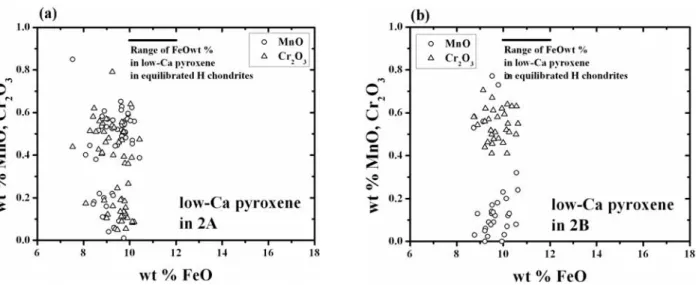
concentrations in low-Ca pyroxene varies from < 0.1 to 0.8 wt% (Fig. 4a). TiO2and Al2O3concentrations are both less than 0.4 wt% (Fig. 5a).
High-Ca pyroxene and plagiocalse are also contained in the 2A samples. Wo content varies from 12 to 48, while Mg/Fe ratio is relatively constant (Fig. 3a). MnO concentration is similar to that of low-Ca pyroxene, but Cr2O3is higher than that of low-Ca pyroxene (Fig. 6a). TiO2, Al2O3, and Na2O concentrations are from 0.3 to 1.4, from 1.3 to 5.5, and < 1.1, respectively. Plagioclase is contained in many 2A test particles based on the X-ray diffraction patterns, but only a few samples have regions more than 10 μm rich in plagiocalse. In such a region, tiny grains of olivine, pyroxene, and FeNi metal are present together with plagioclase.
Therefore, chemical composition of plagioclase is difficult to obtain by EPMA analysis and thus it is determined by AEM method using a cold sample stage, as shown later.
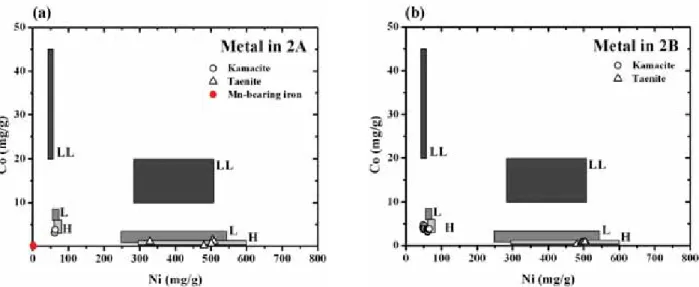
Troilite and FeNi metals occur in abundance in the 2A test samples. They are commonly present with silicates. Troilite is the only sulfide contained in the 2A sample. FeNi metals are kamacite with Ni content up to 6 wt% and taenite with Ni from 33 to 50 wt% (Fig. 7a). Chromite, typically less than 10 μm but occasionally up to 30 μm, occurs together with troilite and FeNi metals in samples such as 2AC8, and 2AC20. Calium phosphate from 10 to 20 μm in size also occurs in samples 2AC14 and 2AC19. 2AC4 shows signatures of melting (Appendix 2AC4). The sample contains many small gas bubbles indicative melting of silicates. X-ray diffraction petterns of this sample indicates the presence of magnetite (Appendix 2AC4). This suggests that the sample was melted at elevated oxygen fugacity and thus it may be a fragment of the fusion crust that was formed during atmosoheric entry of the test- sample meteorite.
This document is provided by JAXA.
Samples being composed of fine particles, 2AF1 to 2AF10, show X-ray diffraction patterns similar to each other (see Appendices 2AF1 to 2AF10). Major phases are olivine, low-Ca pyroxene, plagioclase, and troilite. Based on the intensity ratio of some strong diffractions of low-Ca pyroxene between 38 and 45 diffraction angle (see Appendix section in Nakamura et al., Figure 1.Histograms showing distributions of Fs and Fa contents. (a) Fa of olivine in the 2A sample. (b) Fs of low-Ca pyroxene in the 2A sample. (c) Fa of olivine in the 2B sample. (d) Fs of low-Ca pyroxene in the 2B sample.
Figure 2.CaO and MnO concentrations in olivine in the 2A sample (a) and that in the 2B sample (b).
This document is provided by JAXA.
troilite, Rietveld analysis was performed on the X-ray diffraction data of 2AF1 to 2AF10. Figure 8 shows the results of the Rietveld refinement of the 2AF6 sample and Table 2 shows the results of quantitative phase analysis of 2AF1 to 2AF10. The magnitude of errors is considered to be several percents. Samples, 2AF1 to 2AF10, show X-ray diffraction patterns similar to each other, and accordingly the relative mineral abundance is basically similar to each other (Table 2). All sample particles contain major minerals in the order of olivine > low-Ca clinopyroxene > plagioclase >> troilite. The results demonstrate that the Rietveld analysis is an appropriate method to obtain the relative mineral abundance and, in our knowledge, this is the first report of application of the Rietveld refinement to the fine-grained extraterrestrial material.
TEM observation was performed on 5 samples, 2AF1 to 2AF5. Detailed TEM observation was performed on one sample 2AF2, because bulk mineralogy of these five samples was basically the same, as was revealed by X-ray diffraction analysis, and because more than 150 mineral grains could be investigated using only one sample. Low-Ca pyroxene is composed of areas of both ortho- and clinopyroxene (Fig. 9a). Weak intensities of diffraction spots from orthopyroxene suggest that clinopyroxene is
Figure 3.Pyroxene compositions of the 2A sample (a) and the 2B sample (b).
Sample No. Olivine
Low-Ca
Pyroxene Plagioclase Troilite ( wt% )
2AF1 60.8 24.0 13.1 2.1
2AF2 46.3 31.6 18.1 4.0
2AF3 61.6 23.2 14.9 0.3
2AF4 58.8 26.4 12.6 2.3
2AF5 52.2 32.6 13.8 1.5
2AF6 70.5 17.1 11.5 0.9
2AF7 50.5 30.5 16.5 2.6
2AF8 54.3 29.2 14.6 1.8
2AF9 56.5 27.2 14.0 2.3
2AF10 52.0 32.8 12.3 2.9
Table 2. The results of quantitative phase analysis of olivine, low-Ca pyroxene, plagioclase and troilite, by Rietveld analysis
This document is provided by JAXA.
Figure 4.MnO and Cr2O3concentrations in low-Ca pyroxene in the 2A sample (a) and the 2B sample (b).
Figure 5.TiO2and Al2O3concentrations in low-Ca pyroxene in the 2A sample (a) and the 2B sample (b).
Figure 6.MnO and Cr2O3concentrations in high-Ca pyroxene in the 2A sample (a) and the 2B sample (b).
This document is provided by JAXA.
more abundant than orthopyroxene. Plagioclase is less than several microns diameter. AEM analysis showed that most plagioclase has compositions between An9Ab86Or5 and An13Ab83Or4, but there are also some alkali feldspar enriched in potasium with compositions from An1Ab33Or66 to An0Ab47Or53(Fig. 10). Alkali feldspar (Fig. 9b) coexists with albitic plagioclase. Troilite is often observed, but kamacite is rare (Fig. 9c). Chromite occurs in both olivine and low-Ca pyroxene (Fig.
9d). Iron hydroxides lepidocrosite was found in a vein where 6-line ferrihydrite occurs together with lepidocrosite (Figs. 9e and f).
The presence of iron hydroxides suggests that the 2A test sample is a “find” meteorite.
Optical microscope observation showed that olivine and low-Ca pyroxene crystals in both 2AC and 2AF samples such as 2AC18 (major phases are olivine and low-Ca pyroxene), 2AC22 (olivine and low-Ca pyroxene), 2AC23 (olivine and low-Ca pyroxene), 2AC24 (olivine), 2AF8, 2AF9, and 2AF10 exhibit wavy extinction, indicative of shock effects.
Figure 7.Co and Ni concentrations in FeNi metals in the 2A sample (a) and the 2B sample(b).
Figure 8.The result of Rietveld analysis of sample of 2AF6. The green cross is observed intensity, the blue line is calculated intensity and the red line is error. Some errors are still remained around strong diffraction peaks but the observed and calculated diffraction patterns are basically corresponded.
This document is provided by JAXA.
they are “xenolith” materials coming from other planetary bodies.
Quartz-calcite composite:this strange material is detected in the four samples 2AC26, 2AC27, 2AC28, and 2AF2. The former three samples are dominated by quartz-calcite composite as is indicated by X-ray diffraction analysis (see Appendices 2AC26, 2AC27, and 2AC28), while the latter sample contain several tiny quartz particles that are detected only by TEM observation. SEM observation of 2AC26 indicates that the quartz-calcite composite also contains small amounts of dolomite CaMgCO3, sillimanite Al2SiO5, corundum Al2O3, and carbonaceous materials (Appendix 2AC26). Sillimanite crystals occur in the form of lath-like acicular morphology. X-ray diffraction patterns of 2AC27 and 2AC28 are very similar to that of 2AC26, suggesting the same mineralogy. The quartz-calcite composite is probably a constituent of terrestrial metamorphic rocks. TEM observation of 2AF2 showed that the sample contains a single quartz crystal (Fig. 9g). It may be a fragment of larger quartz-calcite composites such as 2AC26.
Ni-free Mn-bearing Fe metal:the sample of 2AC15 is a particle of Fe metal (Appendix 2AC15). The features set this Fe metal apart from metals in other sample particles are the complete absence of both Ni and Co and the presence of approximately 1 wt% of Mn. These compositional features have never observed in FeNi metals in primitive chondritic meteorites. A nickel-cobalt diagram of FeNi metals in the 2A test sample (Fig. 7a) indicates that only Fe metal of 2AC15 is plotted on the origin (free of Ni and Co), out of the compositional trend of other FeNi metals. In addition, small amounts of magnetite are also present together with Fe metal based on the X-ray diffraction pattern (Appendix 2AC15). The presence of Mn and the coexistence of magnetite suggest that 2AC15 is a piece of factory-produced Fe metal, probably a fragment of some metallic tools.
Carbonaceous materials:the samples of 2AC2 and 2AC6 consist mostly of carbonaceous material. Interesting feature of the samples is that small grains of silicates and sulfides stick to surface of the carbonaceous materials (Appendices 2AC2 and 2AC6).
X-ray diffraction analysis uncovers that the carbonaceous materials are amorphous and small silicates are olivine, low-Ca pyroxene, and plagioclase. Individual mineral particles are too small to be analyzed by EPMA. But the silicate mineralogy is similar to that of the other sample particles based on the X-ray diffraction patterns. Under an optical microscope, the carbonaceous materials are pale yellow similar to the color of epoxy resin. Therefore, the two samples 2AC2 and 2AC6 are probably pieces of epoxy resin that has cemented the test-sample meteorite.
3.3. 2B test sample
2B test sample consists of relatively coarse particles and all particles shows magnetism. X-ray diffraction analysis showed that 2BC1, 2BC2, and 2BC3 samples are dominated by FeNi metals, but rest of the samples contain silicates and sulfides as well as FeNi metals (see appendices 2BC1, 2BC2, and 2BC3). Both kamacite and taenite occur and the former contains Ni up to 7 wt%, while the latter contains Ni approximately 50 wt% (Fig. 7b). Cobalt concentrations in kamacite (~ 0.5 wt %) is higher than those in taenite (~ 0.2 wt %) (Fig. 7b). The anti-correlation of Ni and Co in metals is consistent with the properties of metallic grains in ordinary chondrites, especially equilibrated H chondrites (Fig. 7b). Troilite is also abundant. Chromite up to 20 μm in diameter occurs in 2BC4 and 2BC5. Compositional features of both major and minor elements in chromite again match those of chondrites, especially equilibrated H chondrites (Figs. 11a, b, and c). Calcium phosphate up to 20 μm is present in 2BC7 and 2BC8 samples.
Most of them are whitlockite. Varieties and occurrence of metals, sulfide, and accessory minerals are similar to those of the 2A test sample.
X-ray diffraction analysis indicates that major silicates in the 2B sample are olivine, low-Ca pyroxene, and plagioclase (see Appendix). High-Ca pyroxenes such as augite and pigionite also occur, but less abundant. Many silicate crystals are included in FeNi metals. Important textural evidence was found in a sample of 2BC9, where a well-defined radial pyroxene chondrule is present in contact to a large FeNi metal (Appendix 2BC9 and Fig. 12). Blebs of troilite occur in the periphery of the chondrule.
The presence of the chondrule suggests that the 2B sample is a chondrite, in spite of metal-rich mineralogy.
This document is provided by JAXA.
sample are in agreement with those of 2A sample within 1-sigma variation. Ca/(Mg+Fe) ratio of low-Ca pyroxene is not homogenized between grains (Fig. 3b). Both MnO and Cr2O3concentrations varies from < 0.1 to 0.8 wt% (Fig. 4b). TiO2and Al2O3concentrations are both less than 0.5 wt% (Fig. 5b). Minor element concentrations in olivine and low-Capyroxene in the 2B sample are also similar to those of the 2A sample. High-Ca pyroxene and plagiocalse occur in minor amounts in the 2B samples.
Wo content varies up to 47 with constant Mg/Fe ratios (Fig. 3b). Both MnO and Cr2O3concentrations are similar to those of low- Ca pyroxene (Fig. 6b). TiO2, Al2O3, and Na2O concentrations range from 0.3 to 1.0, from 0.5 to 3.0, and < 1.0, respectively.
Based on the X-ray diffraction patterns, plagioclase occurs in many 2B samples such as 2BC7. Grain size of plagioclase is less than 5 μm, similar to the plagioclase in the 2A samples.
TEM analysis was carried out on samples of 2BC6, 2BC7, 2BC8, 2BC9, and 2BC10. Intensive observation was done on 2BC7, 2BC8, and 2BC9 thin sections prepared by Ar ion bombardment and a 2BC10 thin section prepared by FIB method.
Olivine in 2BC7 contains abundant dislocations with the density is 3.8 x 109 cm-2(Fig. 13a). Their straight and parallel occurrences are typical for olivine grains in shocked meteorites. Low-Ca pyroxene is a mixture of ortho- and clinopyroxene (Fig.
13b). Some low-Ca pyroxenes contain numerous stacking faults and unit dislocations, suggesting that they are impacted (Fig.
13c). Like 2A samples, both sodic plagioclase (Fig. 13d) and alkali feldspar (Fig. 13e) occur. Both feldspars are very small ranging in size from 0.5 to 3 μm. The sodic plagioclase shows albite twin (Fig. 13d), while the alkali feldspar and coexisting plagioclase shows albite-Carlsbad twin (Fig. 13e). High-Ca pyroxene pigionite in both 2BC8 and 2BC9 samples contain exsolution lamellae of augite (Figs. 13f and g). High-resolution imaging shows that an augite lamella has coherent boundaries to the host pigionite (Figs. 13h and i). In contrast to the 2BC7, 2BC8, and 2BC9 samples, 2BC10 sample consists predominantly of elongated domains of FeNi metals (Fig. 13j).
4. DISCUSSION
A combination of multidiscipline analyses revealed that whole- and local-scale mineralogy of individual test sample particles.
The procedures used in the present study are basically similar to those used in the previous technical report for the Hayabusa mission (Nakamura and Noguchi, 2003), but the procedures have evolved in the last four years through the study of cosmic dust.
The main achievements are (1) application of Rietveld refinements to determination of the relative mineral abundance from synchrotron X-ray diffraction data, and (2) sample preparation techniques for TEM including ultramicrotomy for fine-grained aggregates and FIB method for single particles.
2A sample particles have mineralogy quite similar to H chondrites with petrologic type late 4 to early 5. Evidence for H chondrite classification is (1) Fe/Mg ratios of olivine and low-Ca pyroxene (Fig. 14), (2) CaO and MnO concentrations in olivine (Fig. 2a), and (3) Co and Ni distributions in FeNi metals (Fig. 7a). The Fe/Mg ratios of both olivine and low-Ca pyroxene in the 2A sample correspond to the lowest-end of the Fe/Mg variations for H chondrites (Fig. 14), suggesting that it is a sample of most reduced type of H chondrites. Evidence for the petrologic type 4-5 classification is (1) well equilibration of Fe/Mg ratios of both olivine and low- and high-Ca pyroxene, (2) the presence of crystalline plagioclase with several microns in size, (3) the presence of taenite with Ni concentration higher than 20 wt%, and (4) the variation of Wo contents in high-Ca pyroxenes. The former three criteria are well-known classification scheme defined by Van Schmus and Wood, but the last one is derived from TEM observation (Noguchi et al., 1992; Noguchi, 2005, unpublished data). One sigma variations of Wo contents in high-Ca pyroxene decrease with an increase of petrologic type (Fig. 15). The variation of the pyroxenes in the 2A test samples is plotted in a region where many type 4 and 5 ordinary chondrites are plotted (Fig. 15, also see 3a), which verifies the classification of the 2A sample to petrologic type 4-5. However, high abundance of low-Ca clinopyroxene is inconsistent with the petrologic 4-5 classification. This can be explained due to mechanical conversion from orthopyroxene to clinopyroxene under high pressures during shock metamorphism.
This document is provided by JAXA.
thermal metamorphism on the H4-5 parent body and moreover such composites have never been reported even in chondritic regolith breccias. The Ni-free Mn-bearing Fe metal is also a strange component, as is clearly shown in a Co-Ni diagram (Fig. 7a).
The Co and Ni contents of this metallic particle are out of regions for typical equilibrated H chondrites (e. g., Brearley and Jones, 1998). The carbonaceous materials show yellow in color and ductile properties, which differs black and brittle carbonaceous materials occasionally present in chondrites with low petrologic types. All these considerations suggest that the three kinds of materials are probably artificial contaminants.
2B test sample completely differs from the 2A test sample in appearance: the former is larger, magnetic, and dull in color.
However, the mineralogy is very similar between the two test samples, including minor and major element concentrations of olivine, low- and high-Ca pyroxene, FeNi metals, sulfide, and chromite. The only difference is that 2B sample is richer in metals than 2A sample. Therefore, we suggest that 2A and 2B test samples may be prepared from the same meteorite and that 2B sample may be a concentrate of metallic particles. The similarity in mineralogy between the two test samples suggests that 2B test sample is also H chondrite with petrologic type 4-5. The Wo variation of low- and high-Ca pyroxene in 2B sample is similar to that in 2A sample (Figs. 3b and 15). In addition, pigeonite in 2B sample exsolved augite lamellae with thickness of < 50 nm (Figs. 13f and g). The augite lamellae were formed during thermal metamorphism of the meteorite parent body and thus the occurrence and thickness of the lamellae reflect thermal regime of the host pigionite. TEM observation of pigeonites in ALH77208 H4 and Jilin H5 chondrite (Noguchi et al., 1992; Noguchi, 2005, unpublished data) indicates that the pigeonites contain augite exsolution lamellae with thickness of < 50 and < 200 nm, respectively (Figs. 16a and b). The occurrence and thickness of the augite lamellae in the 2B test samples are similar to those in the two H chondrites, confirming the classification of the 2B sample to H chondrites with petrologic type 4-5.
Primitive achondrites such as acaplucoites and lodoranites are next candidate for source materials of both 2A and 2B samples, although the possibility is quite low considering some mineralogical features of primitive achondrites as discussed below.
Primitive achondrites, acaplucoites and lodoranites, consist of olivine, low- and high-Ca pyroxene, plagioclase, FeNi metals, like 2A and 2B test samples. Their textures are basically granular except for rare relict chondrules in acaplucoites. It is difficult to reconstruct original textures before crushing of 2A and 2B test samples, but, at least the 2B test sample seems to have contained some chondrules based on SEM observation of textures of some 2B sample particles.
Averages Fe/Mg ratios of olivine and low-Ca pyroxene are Fa15.1and Fs13.9, respectively, for the 2A test sample and Fa15.8and Fs14.4, respectively, for the 2B test sample. On the other hand, in acaplucoites, compositional ranges of olivine and low-Ca pyroxene are Fa4.2-13.3and Fs6.5-12.6, respectively (McCoy et al., 1996; 1997a, b). Their compositions are more magnesian than both 2A and 2B test samples. In lodoranites, these minerals are more magnesian than acaplucoites and show reverse zoning due to reduction during thermal metamorphism. No ferromagnesian mineral with such reduction was not found in both 2A and 2B samples. In addition, grain size of plagioclase correlates with intensity of thermal metamorphism. Plagioclase crystals in both 2A and 2B samples are very small less than 5 μm in diameter, which is far smaller than plagioclase in acapulcoites (more than 100 μm in diameter: McCoy et al. 1996). This indicates that thermal effects on plagioclase in both 2A and 2B test samples much weaker than those in acaplucoites. These data strongly suggest that both 2A and 2B samples are not fragments of primitive achondrites.
Another supporting evidence of this interpretation is relative mineral abundances between olivine and low-Ca pyroxene in the 2A sample obtained by the Rietveld method. As shown in Table 2, olivine is always more abundant than low-Ca pyroxene in the 2A test sample, which is contrary to the case of acaplucoites (McCoy et al. 1996).
This document is provided by JAXA.
Figures 9(a) and (b)
This document is provided by JAXA.
Figures 9(c) and (d)
This document is provided by JAXA.
Figures 9(e) and (f)
This document is provided by JAXA.
Figure 9(g)
Figure 9.TEM images of 2AF2 sample particle. (a) High-resolution image of a low-Ca pyroxene fragment in 2AF2 sample down to the c* direction. Selected area electron diffraction (SAED) pattern of this area shows that this low-Ca pyroxene is composed of areas of both ortho- and clino- low-Ca pyroxene (ortho- and clinobronzite based on AEM data). Weak intensities of diffraction spots from orthobronzite suggest that clinobronzite is more abundant than orthobronzite. (b) High-resolution image of an alkali feldspar fragment in 2AF2 sample.
We encountered several such feldspar grains. In this case, EDS analysis shows that it has compositional variation from An0.8Ab32.9Or66.2to An0.0Ab47.0Or53.0. SAED pattern shows that there are diffraction spots from both triclinic and monoclinic forms. However, there are no remarkable exsolution lamellae shown in perthite. Photomicrograph shows that there are modulations in this feldspar. They were probably caused by incomplete transformation from orthoclase to microcline. (c) Bright-field image of a kamacite fragment in 2AF2 sample. Kamacite is quite rare in 2AF2 sample. Only this fragment was discovered among the observation of 150 individual grains. SAED pattern of this fragment clearly shows that this kamacite grain was deformed during ultramicrotomy. (d) Bright-field image of a chromite fragment in 2AF2 sample. The occurrence of chromite as a single mineral fragment is rare. Most of them occur as inclusions in ferromagnesian silicates. (e) One fragment contains 0.5-micrometer vein. SAED pattern of this vein has four discontinuous diffraction rings. All of them coincide with diffraction peaks of 6-line ferrihydrite. However, high-resolution images of the vein (insets) revealed that the vein contains thin (< 20 nm) fibrous minerals. Their fringes are various from 1.23 to 1.79 nm. It is clear that these fibrous minerals are not ferrihydrite. They may be mixtures of lepidocrosite and clay minerals. And the interstices of these fibrous minerals are filled by ferrihydrite. (f) Another high-resolution image of the same vein shown in Fig. 9e. In this photomicrograph, Fe-predominant mineral grains partially keep tabular shapes. High-resolution images (insets) show that ferrihydrite replaces the tabular mineral. (g) We found one silica mineral grain in 2AF2 sample. SAED pattern of the grain shows that it is alpha-quartz.
Figure 10.Plagioclase compositions of the 2AF2 sample, showing the presence of both sodic plagioclase and alkali feldspar.
This document is provided by JAXA.
Figure 12.An enlarged view of a radial pyroxene chondrule in the 2B sample. Many troilite inclusions occur at the outer portions of the chondrule. A whole view of this chondrule is shown in Appendix 2BC9.
Figure 11.Major and minor element concentrations in chromite in the 2B sample. TiO2and MnO contents (a), Cr2O3and FeO contents (b), and Al2O3and MgO contents (c).
This document is provided by JAXA.
Figures 13(a) and (b)
This document is provided by JAXA.
Figures 13(c) and (d)
This document is provided by JAXA.
Figures 13(e) and (f)
This document is provided by JAXA.
Figures 13(g) and (h)
This document is provided by JAXA.
Figures 13(i) and (j)
Figure 13.(a) Olivine in this sample contains abundant dislocations. Their straight and parallel occurrences are typical for olivine grains in shocked meteorites. Dislocation density of this grain is 3.8 x 109cm-2. (b) High-resolution image of low-Ca pyroxene in 2BC7 sample.
Low-Ca pyroxene of this sample is composed of abundant areas with orthorhombic structure and less abundant monoclinic structure.
There is also some stacking disorder between the boundaries between ortho- and monoclinic- areas. (c) TEM image of a low-Ca pyroxene grain in 2BC9 sample. SAED pattern of this grain clearly shows that the majority of the grain is composed of orthopyroxene although TEM image shows that it contains abundant stacking disorder between ortho- and clino-areas. Some unit dislocations are also observed.
(d) Bright-field image of sodic plagioclase grains in the interstices of low-Ca pyroxene and olivine large grains in 2BC7 sample. Sodic
This document is provided by JAXA.
augite lamellae continue although the host pigeonite is twinned. It means that augite lamellae exsolved before twining of pigeonite. The twining of pigeonite is probably related transformation from pigeonite to orthopyroxene during thermal metamorphism. (g) Dark field- image of augite lamellae-bearing pigeonite in 2BC8 sample (g=402A). Many bright augite lamellae with thickness < 20 nm can be seen.
They are continuous although there are some stacking disorder and twins in the host pigeonite. (h) High-resolution image of lamellae- bearing pigeonite and low-Ca pyroxene in BC9 sample. Upper SAED pattern shows that low-Ca pyroxene is composed of a mixture of orthorhombic and monoclinic structures. In pigeonite, an augite lamella has coherent boundaries between host pigeonite. The lamella has a sigmoidal shape. The augite lamella is intermitted by stacking disorders in pigeonite. (i) High-resolution image of an augite lamella and the host pigeonite in 2BC8 sample. The boundaries between the lamella and the host are coherent although the direction of elongation of the lamella gradually changes. (j) Low magnification TEM image of a metallic grain in a fragment of 2BC10. This sample was prepared by FIB method. This metallic region is composed of elongated kamacite grains. Their high aspect ratios suggest that these grains experienced deformation probably due to shock. Grain boundaries of each kamacite grain are not thinned preferentially as often encountered when using conventional ion bombardment method.
Figure 14.A correlation of Fs content in low-Ca pyroxene and Fa contents in olivine in ordinary chondrites. Fs and Fa contents of both 2A and 2B samples are located at the lowest-end of H chondrite compositional region.
Figure 15.A correlation between variations of Wo contents and variations of Fs contents in high-Ca pyroxene in H and L chondrites with various petrologic types. Regions a, b, c, and d correspond to petrologic type 3-4, 4-5, 5-6, and 6, respectively. High-Ca pyroxenes in both 2A and 2B samples are plotted in the region of petrologic type 4-5.
This document is provided by JAXA.
Figure 16.(a) Dark-field image of augite lamellae-bearing pigeonite in ALH 77208 H4 chondrite. The thickness of the lamellae is < 50 nm. The lamellae are continuous although there are some stacking disorder and twins in the host pigeonite.
(b) Dark-field image of low-Ca pyroxene core and augite lamellae-bearing rims in Jilin H5 chondrite. Low-Ca pyroxene core is composed of orthorhombic areas with a lesser amount of monoclinic areas. Pigeonite is twinned and augite lamellae are affected by the twining of the host pigeonite. The thickness of the lamellae is < 200 nm.
This document is provided by JAXA.