熊本大学学術リポジトリ
Mobile monitoring along a street canyon and stationary forest air monitoring of
formaldehyde by means of a micro gas analysis system
journal or
publication title
Journal of Environmental Monitoring
volume 14
number 5
page range 1462‑1472
year 2012‑05
URL http://hdl.handle.net/2298/29688
doi: 10.1039/c2em10935b
Journal of Environmental Monitoring
Cite this: DOI: 10.1039/c0xx00000x www.rsc.org/xxxxxx
Dynamic Article Links ►
PAPER
This journal is © The Royal Society of Chemistry [year] [journal], [year], [vol], 00–00 | 1
Mobile monitoring along a street canyon and stationary forest air monitoring of formaldehyde by means of a micro gas analysis system
Kei Toda,*a Wataru Tokunaga, a Yosuke Gushiken, a Kazutoshi Hirota, a Teppei Nose, a Daisaku Suda, a Jun Nagai a and Shin-Ichi Ohira a
Received (in XXX, XXX) 20th November 2011, Accepted Xth XXXXXXXXX 20XX
5
DOI: 10.1039/b000000x
A micro gas analysis system (μGAS) was developed for mobile monitoring and continuous measurements of atmospheric HCHO. HCHO gas was trapped into an absorbing/reaction solution continuously using a microchannel scrubber in which the microchannels were patterned in a honeycomb structure to form a wide absorbing area with a thin absorbing solution layer. Fluorescence was monitored after reaction of
10
the collected HCHO with 2,4-pentanedione (PD) in the presence of acetic acid/ammonium acetate. The system was portable, battery-driven, highly sensitive (limit of detection = 0.01 ppbv) and had good time resolution (response time 50 s). The results revealed that the PD chemistry was subject to interference from O3. The mechanism of this interference was investigated and the problem was addressed by incorporating a wet denuder. Mobile monitoring was performed along traffic roads, and elevated HCHO
15
levels in a street canyon were evident upon mapping of the obtained data. The system was also applied to stationary monitoring in a forest in which HCHO formed naturally via reaction of biogenic compounds with oxidants. Concentrations of a few ppbv-HCHO and several-tens of ppbv of O3 were then
simultaneously monitored with the μGAS in forest air monitoring campaigns. The obtained 1-h average data were compared with those obtained by 1-h impinger collection and off site GC-MS analysis after
20
derivatization with o-(2,3,4,5,6-pentafluorobenzyl) hydroxylamine (PFBOA). From the obtained data in forest, daily variations of chemical HCHO production and loss are discussed.
Introduction
Formaldehyde (HCHO) is an important volatile compound in the atmosphere, as well as in indoor air.1 In urban areas, HCHO is
25
primarily emitted from vehicles. For example, Zhao et al.2 reported that a gasoline engine vehicle emits HCHO at a rate of 0.6 mg km-1. On the other hand, HCHO is formed in rural and natural ecosystems via photochemical reaction of biogenic volatile organic compounds (BVOCs).3 , 4 Gaseous HCHO is
30
decomposed by photolysis and OH radicals.5 HCHO is also a precursor to HO2 radical and ozone in gas phase reactions,6 as well as to formic acid in aqueous reactions such as aerosols and rain drops.7-9 Thus, HCHO is formed via several pathways and has multiple fates. Indeed, HCHO is a hub-compound of
35
atmospheric reactions, which makes HCHO analysis extremely attractive to promote further understanding atmospheric chemistry and its risks to human health.
Currently, the most popular method for analysis of gaseous HCHO is collection using a silica gel cartridge impregnated with
40
2,4-dinitrophenylhydrazine (DNPH) followed by organic solvent extraction and high performance liquid chromatography (HPLC).4,10,11 Although the DNPH-HPLC method is convenient for obtaining spot data for indoor analysis, it requires a long
a Department of Chemistry, Kumamoto University, Kurokami 2-39-1, Kumamoto 860-8555, Japan. Tel: +81-96-342-3389; Email:
collection time and is not suitable for atmospheric trace level
45
analysis. Gu et al. recently proposed a novel method in which a HCHO was trapped directly by a new sorbent known as a metal–
organic framework, after which thermal desorption was used to introduce the trapped HCHO to the gas chromatograph.12 A good limit of detection (0.5 ppbv) was obtained by 10 min of sampling
50
and laboratory instrumental analysis using this technique. Many continuous methods for detailed analysis have been reported.
These methods utilize continuous collection devices such as coil denuders,13-16 and membrane based annular diffusion scrubbers with Nafion tubes,17 porous polypropylene tubes,18 or porous
55
polytetrafluoroethylene (PTFE) tubes.19 HCHO is extremely sticky and easily collected into aqueous absorbing solution due to its high Henry’s law constant of 5020 M atm-1 at 25oC.20 Chemical determinations of HCHO collected in the aqueous phase are conducted using DNPH,19 3-methyl-2-benzothiazolone
60
(MBTH)21 for spectrophotometric analysis and 2,4-pentanedione (PD) (acetyl acetone),22 , 23 1,3-cyclohexanedione (CHD),24 and 5,5-dimethylcyclohexane-1,3-dione (dimedone) 25 for fluorometric analysis. Dasgupta et al. examined several reactions for HCHO analysis and favored PD chemistry.26 In this study, we
65
propose a novel micro gas analysis system (μGAS) to determine trace levels of HCHO in the field using PD chemistry. The portable μGAS was developed for field measurement of H2S and SO227
and on site medical diagnostics28 and treatments.29 Special techniques for μGAS analysis have been developed including
70
pneumatic/electroosmotic flow control30 and on-site calibration with a micro standard gas generator.31 Miniaturized gas analyzers
2 | Journal Name, [year], [vol], 00–00
are currently of considerable interest, and their applications range from atmospheric monitoring to medical diagnosis and counterterrorism.32,33
In this study, HCHO analysis using the μGAS was investigated and applied to mobile analysis in a street canyon.
5
Stationary simultaneous analyses were repeated in two years in a forest for isoprene, monoterpenes, organic acids, NOx and O3,34 together with HCHO. During the forest study, slight interference from O3 was observed, and this interference was not negligible during trace HCHO analysis when the O3 concentration was high,
10
as in situations when oxidant or photochemical smog warnings
were occurring. In this work, the mechanisms of O3 interference and countermeasures for this problem were investigated. The compensated HCHO results in a few ppbv levels agreed well with data obtained by conventional 1 h collection followed by
15
derivatization with o-(2,3,4,5,6-pentafluorobenzyl) hydroxyl- amine (PFBOA) and gas chromatography mass spectrometry (GC-MS). Based on the results obtained for the forest, the contributions of each reaction of BVOC with an oxidant to form HCHO are discussed. Daily variations in the HCHO formation
20
and loss are also estimated.
Experimental
Reagents
Working absorbing/reaction solution was prepared from two
25
stock solutions, 0.03 M PD (Tokyo Kasei, Tokyo, Japan), and 0.75 M acetic acid + 6 M ammonium acetate (both from Nacalai Tesuque, Kyoto, Japan). The working solution was prepared immediately before use by mixing the two stock solutions and milli-Q water (1: 1: 1) to give final concentrations of PD, acetic
30
acid and ammonium acetate of 0.01, 0.25 and 2 M, respectively.
HCHO test gas was prepared as previously described.21 Briefly, HCHO aqueous solution (0.1~1 mM, 40 mL) in an impinger was placed in a 20°C water bath and then bubbled with purified air applied at a rate of 200 mL min-1. The bubbler
35
temperature was set lower than the ambient temperature to prevent water condensation in the air line. Dong and Dasgupta demonstrated a concrete relationship between vapor pressure PHCHO (atm) and aqueous concentration [HCHO] (M) as a function of the absolute temperature T as eq. 1 in the range from
40
0.01 mM (3.3 ppbv) to 6.9 mM (1.3 ppmv).35 [HCHO] = 10(4538/T−11.34)
× PHCHO(252.2/T+0.2088)
(1) Note that the exponential relationship fits to their experimental, not linear relationship, due to formation of hydrated gem-diol.36 According to eq. 1, 0.10 ppmv HCHO vapor was obtained by
45
bubbling 0.53 mM HCHO solution at 20°C and 1.0 atm. The outlet gas was diluted just after the impinger with purified dry air to obtain the desired concentration. It should be noted that the aqueous HCHO concentration decreases very gradually due to the vaporization; specifically, the HCHO generation rate decreases
50
0.25% h-1 under these conditions. Therefore, the HCHO vapor generator solution was exchanged every 8 h or prepared immediately before use.
System setup and procedure
Diagrams of the systems for mobile and stationary monitoring are
55
shown in Fig. 1a and b, respectively. HCHO gas was collected into the absorbing/reaction solution using a microchannel scrubber28 in which the microchannels (220 μm in width and 100 μm in depth, 600 μm in length on each side of hexagon) were arranged in a honeycomb pattern (HMCS) and covered with a gas
60
permeable membrane (Pereflon® HP-045-30, t 30 μm, pore size 0.45 μm) made of porous polytetrafluoroethylene (pPTFE) obtained from Sumitomo Fine Polymer, Osaka, Japan. Sample gas was aspirated through the scrubber block at 200 mL min-1 by a miniature airpump (mAP), CM-15-12 (Enomoto Micropump,
65
Tokyo), while controlling the flow rate with a needle valve equipped with a flow meter (AFC; RK200-V-B-6H-AIR- 0.5L/min, Kojima Instruments, Kyoto). The absorbing solution
was pumped (100~150 L min-1) into the microchannel of the scrubber using a microring pump (mRP) (RP-Q1-N-P20A-DC3V,
70
Aquatech, Osaka) equipped with Norprene® tubing (1.2 mm × 2.5 mm) for mobile analysis. In the case of stationary analysis, a peristaltic pump (Minipuls 3, Gilson, Middleton, WI) with 0.25 mm i.d. PVC tubing was used to pump the liquid. After passing through HMCS, the solution was passed through a reaction tube
75
(PTFE, 0.38 mm i.d. × 65 cm) coiled around a 47-Ω porcelain enamel register powered to be 70°C. The coil was wrapped with an aluminum tape and a micro thermocouple was inserted (621- 2158, RS-Components, Yokohama, Japan).
The fluorescence was monitored using a commercial
80
fluorescence spectrophotometer (FP-2020 Plus, Jasco, Tokyo) with excitation and emission wavelengths of 410 and 510 nm, respectively, and slits of excitation and emission of 18 nm and a gain of 1000×. For mobile analysis, a miniature fluorescence detector with a UV-LED (emission maximum 405 nm, 99405,
85
Led-On, Sagamihara, Japan) was developed. The LED was driven by a constant current of 20 mA. A glass capillary (i.d. 1.1 mm × t 0.2 mm; Chase Scientific Glass, Rockwood, TN) was used as the fluorescence cell. A 1.0 mm quartz optical fiber (MK- 08, Sumitomo Electric Industries, Osaka) was inserted into the
90
cell to introduce fluorescence to the photodiode OPT301 obtained from Texas Instruments. A color filter (SC46, Fujifilm, Tokyo) was pasted on the optical window of the photodiode to eliminate the scattering light (< 460 nm). The photodiode current was converted to voltage with a 470 MΩ resistor in a preamplifier
95
board and the signal was further amplified 100 times in the main circuit board of the μGAS.
Sample air was introduced via a shortcut bypass to obtain measurement signal or a column packed with activated charcoal produced from coconut shells (Nacalai Tesque) to produce a
100
blank signal. The measurement/blank was switched with a three- way solenoid valve (3SV) (MTB-3R-NN4 12VDC, Takasago Electric, Nagoya). The 3SV was off for 2 min for measurement signal and on for 3 min for blank signal (or 3.33 min and 6.67 min) in cyclic mode to obtain data every 5 or 10 min. The system
105
also has a continuous mode, which provides a signal continuously.
The former was advantageous to trace analysis, while the latter was advantageous to mobile monitoring.
If there was concern regarding interference from O3, another 3SV with a wet scrubber composed of a Nafion tube (TT-
110
110; i.d. 2.18 mm × o.d. 2.74 mm × effective length 200 mm;
Perma Pure, NJ) jacketed with Teflon tubing (4 mm i.d. × 6 mm o.d.) was added (shown in a dashed line rectangle of Fig. 1b).
Pure water was introduced in the gap between the Nafion and jacket tubes at a flow rate of approximately 1 mL min-1. HCHO
115
gas was removed completely using the wet scrubber, while O3
was allowed to pass through.
This journal is © The Royal Society of Chemistry [year] Journal Name, [year], [vol], 00–00 | 3
Fig. 1 Flow diagram of μGAS for mobile monitoring (a) and stationary trace measurement (b). RB: reagent bottle; mRP: microring pump; HMCS:
honeycomb patterned microchannel scrubber; mHR: miniature heated reactor; mFD: miniature fluorescence detector; PD: photodiode; CF: color filter
5
sheet; OF: optical fiber; WB: waste bottle; 3SV: three-way solenoid valve; AC: activated charcoal column; WS: wet scrubber; AFC: air flow controller;
mAP: miniature airpump; PP: peristaltic pump; FD: commercial fluorescence detector; WS: wet scrubber.
Field application and validation
Mobile monitoring along a street. Mobile monitoring was
10
performed in Kumamoto, which is a typical moderate sized city in western Japan. The entire system was placed into an aluminum box (35 cm × 29 cm × 17 cm), including the miniature airpump and a motorcycle battery. Measurements were taken in continuous mode and data were logged into the memory of the
15
circuit board after being converted into the HCHO concentration.
The ambient HCHO level was monitored by walking along a city street with the instrument. The instrument position was monitored using a global positioning system (eTrex Legend obtained from Garmin, KS) during the survey.
20
Forest air monitoring. HCHO in forest air was monitored in a laboratory located at Tatsuta Mountain, Kumamoto (N 32o 49’, E 130o 44’), which is part of the Forestry and Forest Products Research Institute. Cars are restricted from entering the area in which the laboratory is located. Outside air was aspirated into the
25
laboratory via a manifold and then applied to a NOx monitor (model 42i, Nippon Thermo, Kyoto), portable GC (RGM-1, Round Science, Kyoto) and our original instrument, a single column trapping/separation–chemiluminescence detection (SCTS-CL) system for isoprene analysis.37 - 39 An O3 monitor
30
(model 49i, Nippon Thermo) aspirated air separately because its high aspiration rate interfered with samplings of the other instruments. A PTFE filter (47 mm) (PF020, Advantec, Tokyo) was placed at the inlet of the gas sampling line. The filter was covered with a polyethylene terephthalate bottle with the bottom
35
removed to protect it from wet and dry depositions. The inlet filter and the instruments were connected with a 1/4” tube (20 m) made of PTFE–perfluoroalkoxyethylene (PFA) copolymer. The reagent solution for HCHO analysis was renewed every three days, and signals of fluorescence obtained by the commercial
40
detector were stored every second by the data logger (Midi logger GL200, Graphtec, Yokohama) together with NOx and O3 data.
Validation of the proposed method. Validation of the μGAS HCHO analysis was conducted during the forest air monitoring campaign. The μGAS data were compared with those
45
collected by another method based on impinger collection followed by derivatization with o-(2,3,4,5,6-pentafluorobenzyl) hydroxylamine (PFBOA) and GC-MS analysis. Sample air was passed through an impinger containing 20 mL of water at a flow rate of 1.0 L min-1 for 60 min using a mass flow controller. The
50
impingers were arrayed and the sampling impinger was changed automatically every hour using a collection changer circuit board that was made in house. The circuit board controlled a 24 piece array composed of a three-way solenoid valve (VQ-110-6G) on two manifold blocks (VV3Q12-12) that were both from SMC,
55
Tokyo. After collection, the absorbing solution in each impinger was transferred into a 50-mL separating funnel and 1.2 mL of 0.1% PFBOA aqueous solution was added. After 2 h of reaction in the dark, 0.32 mL of 9 M H2SO4, 8 g of NaCl, and 2 mL of n- hexane were added. The funnel was then shaken for 5 min, after
60
which the samples were allowed to stand for 10 min. The aqueous phase was drained and 1 mL of the organic phase was placed in a GC vial. Next, 2 μL of the extracted sample were injected into the GC (Trace GC Ultra, Thermo, Yokohama) in splitless mode and passed through a capillary column (Inert Cap 5MS/Sil, 0.25 mm
65
i.d. × 30 m, GL Sciences, Tokyo) with helium carrier applied at 1.0 mL min-1. The column oven temperature was initially set at 50°C for 3 min, after which it was ramped up to 120°C at 15°C min-1, and then to 260°C at 20°C min-1, where it was held for 2.5 min. The eluted compounds were monitored using a mass
70
analyzer (DSQ, Thermo) at m/z 181 and 195 for quantitative analysis and qualification, respectively, and the peak appeared at a retention time of ca. 7 min.
Batch-wise analysis of products from PD and O3. Products obtained by passing O3 gas through PD solution were
75
examined under five conditions: (a) HCHO bubbling through PD solution, (b) O3 bubbling through PD solution, (c) O3 bubbling through water, (d) air bubbling through PD solution, (e) air bubbling through water. In the case of test (a), 2 ppmv HCHO was passed through 10 mL of 0.03 M PD solution for 30 min.
80
The solution was then mixed with 0.75 M acetic acid + 6 M ammonium acetate solution (AA) and Milli-Q water (1:1:1) and heated in hot water for 10 min to enable the reaction to proceed.
The same procedure was performed using 65 ppmv O3 (b) or purified air (d) instead of HCHO gas. In cases in which O3 was
85
used, purified air was subsequently bubbled through the solution for 10 min to remove the dissolved O3. The products were then analyzed by HPLC-FL-ESI-MS (HPLC: Ultimate 3000, Dionex,
4 | Journal Name, [year], [vol], 00–00
Sunnyvale, CA; FL: FP-2020 Plus, Jasco; ESI-MS: MSQ Plus, Thermo). The ESI conditions were as follows: probe temperature
350°C, cone voltage 75V, and dwell time 0.20 s in positive mode while applying 3 kV to the needle.
5
Results and discussion
Reactor temperature
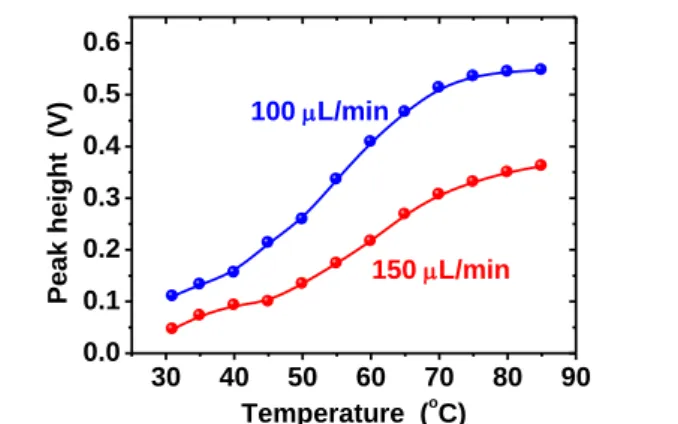
The effects of the reactor temperature were examined and the obtained data are shown in Fig. 2. The response intensity was small at room temperature, but increased dramatically as the
10
reactor temperature increased from 40°C to 70°C, after which the change in intensity was small. While the peak height differed with different liquid flow rates, similar temperature effects were observed for both conditions at 100 and 150 μL min-1. Above 80°C, the baseline became noisy due to bubble formation. Based
15
on these results, 70°C was selected for further experiments. The reaction coil was effectively heated by a small resistor as described in the Experimental section and the reaction was achieved with a short reaction time (reaction coil passing time: 45 s at 100 μL min-1 and 30 s at 150 μL min-1). The normal power
20
consumption required to maintain the reactor temperature at 70°C at a room temperature of 25°C was only 0.37 W.
Performance of the µGAS system for measurement of HCHO The response chart produced by the μGAS is shown in Fig. 3.
HCHO gas at 0 to 20 ppbv was measured in cyclic mode, after
25
which the test gas was passed through a bypass column and an active carbon column alternatively to obtain the signal and the baseline, respectively. The repeatability of the responses was good, and the deviations were 2.5, 1.5, 1.0, 0.78 and 0.44% for 4,
8, 12, 16 and 20 ppbv HCHO, respectively. The calibration curve
30
obtained from the data was linear and the correlation coefficient (R2) was 0.9992. The calibration curve was linear to 100 ppbv with an R2 of 0.9975. The delay from the change in gas concentration to the start of the signal change was 60 s, while that from the start of the signal change to attaining 90% of the final
35
value was 50 s. The estimated limits of detection (LODs) from the results were 0.01 ppbv with the commercial fluorescence detector and 0.2 ppbv with the miniature fluorescence detector.
The system was suitable to measure ppbv levels of HCHO, which are the levels found on city streets and in forest air.
40
Fig. 2 Effect of reactor temperature on the response signal obtained for 20 ppbv HCHO. Note that bubbles formed above 80°C.
45
Fig. 3 Response chart obtained in the cycle mode with the commercial detector. In the test, 3SV was on for 3 min to obtain baseline and off for 2 min for response.
Mobile monitoring of atmospheric HCHO
Detailed spatial variations in atmospheric HCHO were analyzed
50
using the μGAS. The device was light enough to walk with (5.0 kg including a 2.6-kg battery) and measurements could be made along a city street. The results of one of the measurement events (September 28, 2008) are shown in Fig. 4. During this measurement event, the operator started walking near Kumamoto
55
Castle and walked down the castle hill to the downtown area along a castle moat. The middle of the campaign area was in the center of the city (Tori-cho), where many cars were moving
slowly or stopped at traffic signals and both sides of the road were surrounded with high buildings. After leaving the city center,
60
the operator crossed a bridge. The HCHO levels near the castle and the bridge were obviously lower (1~5 ppbv) than those in the center, which was likely because there were fewer emission sources and wind was able to blow without interference from buildings in these areas. Conversely, high HCHO levels
65
(maximum 32.5 ppbv) were observed in the center downtown area. Even though Kumamoto is not a large city, high HCHO levels were found in this area. The main source of HCHO was likely vehicles stopping in the street, since gases accumulated in the area surrounded by buildings. High concentrations of
70
30 40 50 60 70 80 90 0.0
0.1 0.2 0.3 0.4 0.5 0.6
100 L/min
150 L/min
Peak height (V)
Temperature (oC)
0
0.1 V
16
20 ppbv
8 4
20 min
12
This journal is © The Royal Society of Chemistry [year] Journal Name, [year], [vol], 00–00 | 5 pollution gases were sometimes observed in such street
canyons.40 The downtown HCHO levels were above the allowable limit (27 ppbv) determined for indoor air 8-h exposure in California.41 Overall, the results presented here demonstrate
that the HCHO level can vary dramatically in a short distance,
5
and that the HCHO level may become high enough to be a concern to human health in downtown areas.
Fig. 4 Results of mobile monitoring of HCHO along a street in Kumamoto.
10
Measurement of trace HCHO under elevated O3 conditions Interference from O3. While relatively high concentrations of HCHO were observed during downtown mobile
15
monitoring, all measurements of forest air revealed only trace levels of HCHO. Specifically, the HCHO level was normally between 1 and 5 ppbv. In previous studies of trace HCHO levels, agreement between the data obtained using a coil denuder- Hantzsch reaction-HPLC and DOAS was not good, resulting in
20
uncertainty regarding the HCHO measurements.42 , 43 In the beginning of this study, the HCHO concentration was found to vary with time in a fashion similar to that of O3. Synchronized changes of HCHO and O3 concentrations were thought to be caused by the formation of HCHO from the reaction of
25
hydrocarbons with O3 and OH. The formed HCHO was one of the sources of oxidants and a reaction cycle occurred in the atmosphere between O3 and HCHO, but O3 was not believed to interfere with the HCHO analysis. However, subsequent testing of the μGAS in the laboratory revealed that O3 resulted in a small
30
and positive effect on the measured HCHO levels. This positive error was likely from a fluorescent product formed with O3 during analysis. This is opposite to the negative error usually obtained in the conventional DNPH cartridge sampling caused by O3. The positive O3 interference was likely due to formation of
35
HCHO in the absorbing solution. Kozai and Matsumoto investigated aqueous reactions of PD and O3 and found that when 5 mM PD (250 mL) was treated with 9000 ppmv O3 (200 mL min-1), HCHO was identified as 0.27 mM, even after 5 min (the first sampling).44 These findings indicate that HCHO was formed
40
from aqueous PD and dissolved O3 in a short reaction time, which was likely the same reaction that occurred in the microchannel scrubber in the present study.
The above hypothesis were confirmed by bubbling 2 ppmv HCHO, 65 ppmv O3 and purified air separately through 20 mL of
45
water and PD solution. After bubbling, the PD, acetic acid/ammonium acetate (AA) and water were mixed and heated in hot water for 10 min, and the compounds in the solutions were analyzed by HPLC-FL-ESI-MS. In the mass spectra, signals at m/z 100 (the base peak) and 101 were observed in all experiments,
50
which corresponded to enol and keto forms of PD, respectively.
Both HCHO and O3 treated PD samples produced a signal at m/z 194 as in Fig. 5ab to indicate the production of 3,5-diacetyl-1,4- dihydrolutidine (DDL), while the same mass signal was not observed in the other samples as Fig. 5c (O3 bubbled water, air
55
bubbled PD, and air bubbled water). The mass spectrum data suggest that HCHO was produced by the reaction of PD with O3. The HCHO production from O3 and PD likely occurred because the scrubbing was into PD solution directly. However, the single reagent system was simple and easier to operate and obtain a
60
stable baseline.
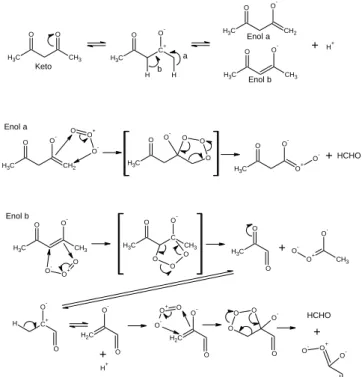
The di-ketone compound, PD, exists in aqueous solution as keto and enol forms as in Scheme 1. One of the enol forms is a terminal olefin (enol a), which reacts with O3 to produce HCHO via molozonide. Ozonide may be an intermediate produced from
65
the molozonide to generate HCHO. The other (enol b) is a major enol that also reacts with ozone to give two fragments, one of which might produce HCHO upon further reaction with O3. These are possible mechanism to produce HCHO from PD and O3 in our experiments and the previous work by Kozai and
70
Matsumoto.44
6 | Journal Name, [year], [vol], 00–00
Fig. 5 Mass spectra of HCHO and O3 treated PD solutions. First, five sets of PD solution, AA solution and milli-Q water were prepared. HCHO, O3 5
or purified air was then bubbled through the PD solution or the water.
Next, the tested solution was mixed with the remaining solutions (AA and the water or the PD solution) to give a final ratio of 1:1:1. There were five combinations of gas and absorbers (a)–(e), which are described in the Experimental section. There was no obvious peak at m/z 194 in (d) and
10
(e), which was the same as in (c).
C
H3 CH3
O O
C H3
C+ O O-
H H H3C CH3
O O- C
H3 CH2
O O-
H+
C
H3 CH3
O O-
O+ O
O- O
O C H3
C CH3 O O-
O H3C
O
O
O-
O+ CH3 O-
+
C+
O H
O-
C H2
O O-
H+
C H2
O O- O+ O-
O
O O
O O- O
+
O+
O O- O-
+
+
C
H3 CH2
O O- O O+ O-
C H3
O O- O O
O C
H3 O+
O O- O-+
Keto
Enol a
Enol b a
b
Enol a
Enol b
HCHO
HCHO
Scheme 1 Equilibrium of PD in aqueous solution and its reaction with ozone to produce HCHO.
15
C
H3 CH2
O O- I+ I
I
C
H3 CH2
O O
O H2
H H C H3
O O
O+
H C H3
O O
O C H3
CH2 O O-
+ H2C O
H O H Enol a
20
Scheme 2 Possible mechanism of HCHO formation from PD and I2.
Countermeasure for O3 interference. Although there was little interference from O3, we decided that the interference must be removed when the O3 level was higher than ten times the
25
HCHO level. To accomplish this, selective removal of O3 was examined using columns packed with solid KI. The tested columns removed O3 quantitatively, which was confirmed by introducing 380 ppbv O3 into the columns and using the O3
monitor. However, the μGAS response to O3 only decreased by
30
40–50%. I2 was formed in the KI column and then likely vaporized and was then captured in the absorbing solution, where it reacted with PD. When test air was passed through a bubbler containing iodine or hypochlorous acid solution before introduction to the gas channel of the microchannel scrubber, a
35
positive response was obtained. This result indicated that in addition to O3, Cl2 and I2 reacted with PD to generate HCHO in the absorbing solution. Furthermore, loss of HCHO from the KI
column was a concern during long term monitoring, and this loss might not be negligible in the case of trace HCHO measurements.
40
The mechanism of HCHO formation with I2 is less certain, but can be explained as follows. Iodine acts as a Lewis acid in the aqueous phase. An electron from an enol oxygen attacks the positively charged iodine atom, resulting in connection of the atoms. The iodide then absorbs the electron to make the terminal
45
CH2 positive, so that the H2O is able to bind to and remove the terminal carbon. As a result, HCHO is released from the compound (Scheme 2). Thus the KI column did not eliminate the positive O3 interference.
Next, removal of HCHO was examined using a cylindrical
50
wet scrubber because the KI column could not eliminate the positive errors. Henry’s law constant of HCHO is 5 x 10⁵ times higher than that of O3 (1.1 x 10⁻² M atm-1). Therefore, HCHO was quantitatively removed by a short wet scrubber composed of a
50 100 150 200
0 1x10⁵
2x10⁵ (a) HCHO bubbling via PD
then mixed with AA & water
DDL PD
50 100 150 200
0 1x10⁵ 2x10⁵ 3x10⁵ 4x10⁵
(b) O3 bubbling via PD then mixed with AA & water
PD DDL
50 100 150 200
0 1x10⁵ 2x10⁵ 3x10⁵ 4x10⁵
(c) O
3 bubbling via water then mixed with PD & AA
PD
This journal is © The Royal Society of Chemistry [year] Journal Name, [year], [vol], 00–00 | 7 Nafion tube surrounded with pure water. On the other hand, half
of the O3 passed through the wet scrubber. HCHO was not detected by the μGAS when the Nafion wet scrubber was placed before the microchannel scrubber. The removal efficiency of the wet scrubber was estimated to be 99% based on the spreadsheet
5
developed by Berg et al.,45,46 assuming that the Nafion surface acted as a perfect sink for HCHO. The low levels of HCHO and high levels of O3 could be measured using PD chemistry with treatment of the air sample by two three-way solenoid valves, the active carbon column and the wet scrubber (Fig. 1b and Fig. 6).
10
The fluorescence intensities observed when the sample gas passed through the active carbon, the wet scrubber and the bypass corresponded to the signals of the blank, O3, and O3 + HCHO, respectively. The concentrations of O3 and HCHO were obtained from the following equations based on the data presented in Fig.
15
6:
O3 (ppbv) = 16.3 SIGwet (mV) – 5.2 (2) HCHO (ppbv) = 0.0521 SIGbypass (mV)
– 0.0224 O3 (ppbv) – 1.05 (3) SIGwet and SIGbypass were obtained when the air sample passed
20
through the wet scrubber and bypass, respectively. The calibrations were performed immediately before each forest air monitoring event.
Fig. 6 Responses of the µGAS to HCHO and O3.
25
Simultaneous measurements of HCHO and O3 were previously performed by Possanizini and Palo47 and Uchiyama et al.48,49 using annular denuder sampling and cartridge sampling, respectively, both followed by HPLC analysis. They used well-
30
designed chemical reactions of the two analytes. On the other hand, in this study, HCHO and O3 were simultaneously analyzed in near-real time without chromatographic separations.
Comparison of data with those obtained with other methods. The simultaneous HCHO/O3 measurement method was
35
validated using other methods. First the O3 data were compared with those obtained using a commercial O3 monitor based on UV absorption (Fig. 7). Both signals matched each other well.
Additionally, the results obtained using both methods clearly demonstrated that the O3 levels were very low on November 14,
40
when the yellow sand aerosols came from China. During this period, O3 was likely consumed by catalytic reactions on the surface of the aerosols. Thus, the O3 level varied from 2.1 to 48.3 ppbv in the 73 h period. The relationship of the O3 data obtained by the two methods for every 10 min can be expressed as follows:
45
O3 by μGAS (ppbv) = 0.9995 O3 by UV (ppbv) + 0.7975 R2 = 0.8048 (4) Although there were deviations, there was a good relationship between the data obtained using the two methods. As a result, PD chemistry followed by fluorescence detection can be used for O3 50
monitoring as well.
HCHO was also measured by derivatization with PFBOA followed by GC-MS analysis as described in the Experimental section. Salthammer and Mentese showed good agreement of data obtained using the PD chemistry and by the DNPH
55
method.50 In our experiments, sensitivity of the DNPH method was not sufficient for forest HCHO monitoring so that the PFBOA method was used. The results are compared in Fig. 8.
The HCHO levels measured using the modified μGAS agreed well with those measured using PFBOA-GC-MS, but the μGAS
60
had a better time resolution. Specifically, the time resolution of the μGAS was 10 min during the forest monitoring, while PFBOA-GC-MS required 1 h to obtain the same sensitivity. The data were obtained from measurements taken in the forest and an experiment in our laboratory in which outside air was
65
continuously introduced through a window. The relationship between the data obtained using the μGAS and PFBOA-GC-MS systems for the forest and laboratory experiments is shown in panel b. The following equation described the relationship between these datasets:
70
HCHO by μGAS (ppbv) = 1.033 HCHO by GC (ppbv) – 0.0886 n = 36, R2 = 0.9195 (5) Although the principles involved in these methods differed, the results obtained using them agreed well. The measurement in which the μGAS was used with O3 compensation was simple and
75
provided data in near real time, while the HCHO data at trace levels agreed with those obtained by PFBOA-GC-MS.
Fig. 7 Comparison of O3 data obtained using the modified-µGAS system and commercial O3 monitoring based on UV-absorption.
SIGwet SIGbypass
150 ppbv 50 100
12 ppbv 8
4
0.1 V
30 min
HCHO O3
11/12 11/13 11/14 11/15
0 20 40 60 80
Yellow sand aerosol
UV-absorption O
3
GAS O
3
O
3(p pb v)
8 | Journal Name, [year], [vol], 00–00
Fig. 8 Validation of the HCHO data using the PFBOA-GC-MS method; changes in HCHO level with time obtained in the forest by the μGAS (●) and PFBOA-GC-MS (▬) in panel (a) and relationship of the data obtained using the two methods to analyse air sampled from outside the laboratory (□) and the forest (○)(b); values on the y-axis in (b) are averages of six data points obtained using the μGAS during 1-h of PFBOA sampling. Solid symbols in (b) indicate data obtained without wet scrubber compensation.
5
Production and loss of formaldehyde in forest air
Air monitoring was performed in the forest. Daily and seasonal variations of isoprene were shown in a previous study34 in which HCHO data were presented as one of the related compounds.
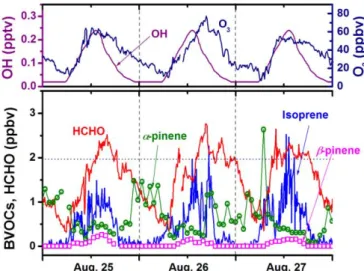
Typical time variations in HCHO are shown in Fig. 9 together
10
with biogenic volatile organic compounds (BVOCs) and O3 obtained August 25–27, 2009. The time variation of emission and loss of isoprene in the same day were discussed in a previous paper. In the present study, the production and loss of HCHO in the forests is discussed based on data obtained in the same
15
campaign.
HCHO is formed by oxidation of volatile organic compounds.
Therefore, the HCHO production rate, PHCHO, can be expressed by eq. 6, which includes the VOC concentrations [BVOC]j, oxidant concentrations [Oxidant]i, reaction rate constants kij and
20
yields of HCHO in the reactions γij.51,52
∑ ∑ ( [ ] [ ]) (6) For estimation of the HCHO production rate, isoprene, α-pinene, and β–pinene were considered as the BVOCs that were primarily observed in the campaigns, and OH and O3 were the oxidants.
25
The OH concentration was estimated from a graph for summer OH in the literature53 as the manner of the previous work,54 and the other concentrations, ambient temperature and solar irradiation were measured simultaneously. The parameters, kij and γij, used are shown in Table 1. Variations in HCHO production
30
were estimated from these field results and detailed variations of the production via reaction of isoprene with OH radical are given in Fig. 10. The maximum production occurred around 2 pm every day because both of these compounds are formed with sunlight.
HCHO was primarily produced in the daytime. The daily
35
production rate was obtained by integration of the variation curve.
The daily production rates via the other reactions were estimated in the same way and summarized in Table 1. The total HCHO production was 11.0 ± 1.0 ppbv d-1. The major production process was isoprene/OH, which accounted for 70.4% of the total
40
production. The HCHO yield of the isoprene/O3 reaction was high (0.90) and the O3 concentration also affected the HCHO
production. The HCHO production from α-pinene with OH and O3 was comparable, being 0.89 ± 0.09 and 1.00 ± 0.24 ppbv d-1, respectively. The production from β–pinene/O3 was negligible.
45
Fig. 9. Diurnal variations in HCHO and the related compounds. The OH concentrations were from ref. 54.
50
Fig. 10. Diurnal variations in the HCHO production via isoprene/OH reaction and the HCHO loss by OH.
18 00 06 12 18
0 1 2 3
GAS
Time of day (h) PFBOA Forest
HCHO (ppbv)
0 1 2
0 1 2 3 4
Lab outside Forest
HCHO by PFBOA-GC-MS (ppbv)
HCHO by GAS (ppbv)
This journal is © The Royal Society of Chemistry [year] Journal Name, [year], [vol], 00–00 | 9 Table 1 Production and loss of HCHO by BVOC/oxidant reactions.
Reaction Rate constant, k (cm3 molecule-1 s-1) at 298K
Yield*
γ
HCHO production, PHCHO
Max ppbv h-1
Daily
ppbv d-1 %
Isoprene + OH 2.7×10⁻¹¹exp(390/T) 1.0×10⁻¹⁰ 0.55 2.80 7.74 ± 1.26 70.4 Isoprene + O3 1.03×10⁻¹⁴exp(-1995/T) 1.3×10⁻¹⁷ 0.90 0.15 0.53 ± 0.05 4.9 α-pinene + OH 1.2×10⁻¹¹exp(440/T) 5.3×10⁻¹¹ 0.19 0.14 0.89 ± 0.09 8.2 α-pinene + O3 6.3×10⁻¹⁶exp(-580/T) 9.0×10⁻¹⁷ 0.25 0.18 1.00 ± 0.24 9.3
β–pinene + OH – 7.8×10⁻¹¹ 0.51 0.21 0.73 ± 0.18 6.8
β–pinene + O3 – 1.5×10⁻¹⁷ 0.65 0.01 0.05 ± 0.02 0.5
Total 3.17 11.0 ± 1.0 100
Loss
HCHO + OH 5.4×10⁻¹²exp(135/T) 8.5×10⁻¹² – 0.41 –2.86 ± 0.15
* Yield is the mol ratio of produced HCHO to source compound BVOC.
The HCHO produced in the forest air decomposed via many
5
pathways, including photolysis, chemical reactions and dry deposition.3 In the chemical reactions, HCHO reacts with OH (k 8.5×10⁻¹² cm3 molecules-1 s-1),55 O3 (2.1×10⁻²⁴),56 NO3 (5.8×10-
16),55 and HO2 (5.0×10⁻¹⁴).55 The chemical decomposition rates estimated for typical oxidant concentrations (OH 0.2 pptv, O3 60
10
ppbv, NO3 3 pptv, HO2 4 pptv) had the following ratio: OH 1.3×10⁷: O3 1.0: NO3 1.4×10⁵: HO2 1.5×10⁶. Thus, decomposition with OH was dominant in the chemical reactions as Sumner et al.3 stated. Additionally, photolysis and dry deposition were the major fate of atmospheric HCHO during
15
daytime and nighttime, respectively, and the loss of HCHO (LHCHO) could be expressed by the photolysis rate constant J, the second order rate constant k, the dry deposition rate Vd (m s-1) and the height of the boundary layer H as follows:
LHCHO = J [HCHO] + k [OH][HCHO] + Vd [HCHO] H–1 (7)
20
There are two photolysis processes that produce (H· and HCO·) and (H2 and CO) (in both λ < 330 nm),52 and the respective rate constants, Jla and Jlb, are expressed with photosynthetically active radiation (PAR, μmol m-2 s-1) as follows (PAR can be driven by multiplying 4.57 to solar insolation (W m-2)):57
25
Jla (s-1) = –2.67×10⁻¹⁵(PAR)3 + 9.65×10⁻¹²(PAR)2
+ 6.47×10⁻⁸(PAR) – 1.25×10⁻⁸ (8) Jlb (s-1) = –3.25×10⁻¹⁵(PAR)3 + 8.12×10⁻¹²(PAR)2
+ 1.90×10⁻⁸(PAR) – 1.37×10⁻⁸
(9) We attempted to determine the daily variations in the HCHO loss.
30
However, many assumptions regarding the parameters for calculation of LHCHO were required and reasonable estimation was difficult. Nevertheless, it can be said that the first and second terms in eq. 7 occur during daytime and are generally proportional to the sunlight intensity. The last term, dry
35
deposition, was dominant during nighttime.
As mentioned above, the main chemical production and loss of HCHO were a result of reaction of isoprene with OH and chemical decomposition by OH, respectively, which are both proportional to the OH concentration. Although the OH level was
40
estimated from the literature, the ratio of production/loss by OH is not related to the OH concentration. Detailed data describing isoprene and HCHO are presented in this study and time variations with a good resolution were obtained as in Fig. 10.
During monitoring of the forest site, isoprene was the dominant
45
BVOC. While both the rates of production from isoprene/OH and loss by OH increased as the OH level increased, the production rate was higher than the loss rate. The three day data indicated
that the daily production and loss by OH were 7.74 ± 1.26 and 2.86 ± 0.15 ppbv d-1, respectively. While the OH radical
50
contributed to both the production and loss, the contribution to the HCHO production was three times greater than the HCHO loss. Isoprene is a reactive compound that contributes more to the production of HCHO than other BVOCs. These suggest that HCHO production may be greater in broad-leaved tree forests
55
than conifer forests.
Conclusions
A portable and highly sensitive device for atmospheric HCHO analysis was developed. The information obtained is itemized below.
60
The developed μGAS was suitable for mobile analysis of HCHO along a street in an urban area. The local HCHO levels in the downtown area varied dramatically in a short distance, and relatively high concentrations of HCHO were observed in
65
the street canyon, which may affect human health.
The results revealed that PD chemistry for HCHO detection at trace levels was subject to interference from high concentrations of O3. This was likely due to production of HCHO by the reaction of PD with O3 in the absorbing solution.
70
Although a KI cartridge removed the O3, the positive interference could not be removed by the cartridge owing to the formation of I2 that vaporized and moved into the absorbing solution to produce HCHO via its reaction with PD.
This interference was addressed by incorporation of a wet
75
denuder for selective HCHO removal.
The developed μGAS could be used to monitor trace levels of atmospheric HCHO in the forest every 10 min, and the data generated by the μGAS agreed with those obtained by the PFBOA derivatization-GC-MS conducted at 30 min intervals
80
and the offsite laboratory analysis.
Analysis of the data obtained in the forest revealed that the HCHO production by the isoprene/OH reaction and the HCHO loss by reaction with the OH radical increased during daytime.
The production was about three times higher than the chemical
85
loss during the summer measurement period.
The analytical device developed in this study is expected to be useful for monitoring of atmospheric and indoor HCHO.