pairs of adolescents with the Perceptual Crossing Experiment
Author Karlijn S. F. M. Hermans, Zuzana Kasanova, Leonardo Zapata‑Fonseca, Ginette Lafit, Ruben Fossion, Tom Froese, Inez Myin‑Germeys
journal or
publication title
Behavior Research Methods
year 2020‑02‑19
Publisher Springer Nature
Rights This is a post‑peer‑review, pre‑copyedit version of an article published in Behavior Research Methods. The final authenticated version is available online at:
http://dx.doi.org/10.3758/s13428‑020‑01378‑4 Author's flag author
URL http://id.nii.ac.jp/1394/00001390/
doi: info:doi/10.3758/s13428-020-01378-4
Title: Investigating real-time social interaction in pairs of adolescents with the Perceptual 1
Crossing Experiment 2
3
Authors: Karlijn S.F.M. Hermans1, Zuzana Kasanova1, Leonardo Zapata-Fonseca2,3,4, Ginette 4
Lafit1,5, Ruben Fossion3, Tom Froese3,6, Inez Myin-Germeys1 5
1KU Leuven, Department of Neuroscience, Center for Contextual Psychiatry, Leuven, 6
Belgium 7
2Plan of Combined Studies in Medicine (PECEM), Faculty of Medicine, National Autonomous 8
University of Mexico, Mexico City, Mexico 9
3Center for the Sciences of Complexity (C3), National Autonomous University of Mexico, 10
Mexico city, Mexico 11
4Section Phenomenological Psychopathology and Psychotherapy, Department of General 12
Psychiatry, Center of Psychosocial Medicine, University of Heidelberg, Heidelberg, 13
Germany 14
5KU Leuven, Department of Psychology, Research Group of Quantitative Psychology and 15
Individual Differences, Leuven, Belgium 16
6Department of Computer Science, Institute of Applied Mathematics and Systems Research, 17
National Autonomous University of Mexico, Mexico City, Mexico 18
19
Corresponding author: Karlijn Hermans, Center for Contextual Psychiatry, Department of 20
Neuroscience, Catholic University of Leuven, Kapucijnenvoer 33, blok h, 3000 Leuven, 21
Belgium; tel: +32-(0)16 3242 22; e-mail: [email protected] 22
23
Word count abstract: 170 24
Word count main text: 5945 (including Figure legends) 25
Abstract 1
The study of real-time social interaction provides ecologically-valid insight into social 2
behavior. The objective of the current research is to experimentally assess real-time social 3
contingency detection in an adolescent population, using a shortened version of the Perceptual 4
Crossing Experiment (PCE). Pairs of 148 adolescents aged between 12 and 19 were instructed 5
to find each other in a virtual environment interspersed with other objects by interacting with 6
each other using tactile feedback only. Across six rounds, participants demonstrated 7
increasing accuracy in social contingency detection, which was associated with increasing 8
subjective experience of the mutual interaction. Subjective experience was highest in rounds 9
when both participants were simultaneously accurate in detecting each other’s presence. The 10
six-round version yielded comparable social contingency detection outcome measures to a 11
ten-round version of the task. The shortened six-round version of the PCE has therefore 12
enabled us to extend the previous findings on social contingency detection in adults to an 13
adolescent population, allowing implementation in prospective research designs to assess 14
development of social contingency detection over time.
15 16
Key words social interaction – ecological validity – social contingency detection – virtual 17
paradigm - adolescence 18
19 20 21 22 23 24 25
1. Introduction 1
Research on the dynamics of social interaction and its assessment have been dominated by 2
studies with a key role for social cognition, focusing on cognitive processes within one 3
individual (Blakemore & Choudhury, 2006; Brizio, Gabbatore, Tirassa, & Bosco, 2015;
4
Hutto, Herschbach, & Southgate, 2011). These entail for example the ability to understand 5
others’ mental states, or ‘mentalizing’, studied in both normal development (Bosco, 6
Gabbatore, & Tirassa, 2014) and psychopathology (Penn, Sanna, & Roberts, 2008). However, 7
findings from laboratory research on social cognition have only partly been able to explain 8
social functioning (Fett et al., 2011; Simons, Bartels-Velthuis, & Pijnenborg, 2016), which 9
questions the assumption that social cognition is a prerequisite for social functioning 10
(Hermans et al., 2019; Schneider, Myin, & Myin-Germeys, 2019). Although many other 11
factors can be assessed to increase the explained variance in social functioning (Barch, 12
Pagliaccio, & Luking, 2016), it is argued that crucial information continues to be lacking if 13
these factors only relate to one individual, i.e. the observer. As an alternative to the observer’s 14
point of view, the interactor’s point of view reflects the ongoing interaction and constantly 15
changing dynamics in the environment (Schilbach et al., 2013). Therefore, paradigms 16
studying social interaction, using the mutual engagement of at least two parties, have been 17
gaining increased attention (De Jaegher & Di Paolo, 2008; Froese, 2018). In the assessment of 18
real-time interaction, both interactors engage at the same time, allowing to capture the 19
dynamics of social interaction itself. This goes beyond the study of social cognition as internal 20
mechanism, and instead focuses on basic capacities that constitute the dynamics of constantly 21
changing behavior in interaction with body and environment.
22
From a very early age, infants show engagement with others and responsiveness to 23
social cues (Reddy, 2010). The development of real-time responding to social cues and 24
maintaining a social interaction has been studied in two-month-old babies, showing that 25
infants could distinguish live from prerecorded interactions with their mother (Murray &
1
Trevarthen, 1985; Nadel, Carchon, Kervella, Marcelli, & Reserbat-Plantey, 1999). The study 2
of real-time successful interactive capacities has been continued in adults with the 3
development of the Perceptual Crossing Experiment (PCE) (Auvray, Lenay, & Stewart, 2009;
4
Auvray & Rohde, 2012). Within this experimental paradigm, interaction is defined as the co- 5
regulated coupling between two autonomous individuals within their environment (De 6
Jaegher, Di Paolo, & Gallagher, 2010). This is captured by the assessment of social 7
contingency detection, which is defined as the sensitivity to other people’s responsiveness to 8
one’s presence and behavior. Previous research has investigated social contingency detection 9
in terms of objective measures of the interaction process, such as detection accuracy and turn- 10
taking, and in terms of the participant’s subjective experience of interaction (Froese, Iizuka, &
11
Ikegami, 2014; Zapata-Fonseca, Dotov, Fossion, & Froese, 2016). Detection accuracy 12
entailed correct detection of the other based on real-time interaction with tactile feedback 13
only. Turn-taking reflected a strategy that participants employed in order to detect the other.
14
Subjective experience of interaction was measured with self-report, assessing the experience 15
of the interaction without being given feedback on detection accuracy.
16
The PCE has, to date, only been implemented in adults. These studies showed 17
evidence for accurate mutual awareness through sensorimotor coordination in a minimal 18
virtual environment (Auvray & Rohde, 2012; Deschamps, Lenay, Rovira, Le Bihan, &
19
Aubert, 2016; Froese et al., 2014; Kojima, Froese, Oka, Iizuka, & Ikegami, 2017; Zapata- 20
Fonseca et al., 2016). Positive associations have been found between the mutual interaction 21
process and subjective experience thereof, suggesting that co-regulation of interaction in real 22
time is necessary for successful detection of social contingency (Froese et al., 2014). Some 23
authors have even argued on the basis of the PCE that social interaction may constitute social 24
cognition (De Jaegher et al., 2010; Froese & Di Paolo, 2011). More recently, the PCE has also 25
shown to distinguish interaction patterns, measured as amount and variability of movement 1
towards each other, in individuals with high-functioning autism from those in controls 2
(Zapata-Fonseca et al., 2019; Zapata-Fonseca, Froese, Schilbach, Vogeley, & Timmermans, 3
2018). These studies, showing the ability to capture variability in capacities for social 4
contingency detection in populations with impairments in social functioning, provided further 5
evidence for the capacity of the PCE to investigate mechanisms of social interaction.
6
Although the development of social capacities starts from birth, the role of 7
interpersonal functioning is very important in adolescence, during which maturation of social 8
skills takes place (Smetana, 2010; Smetana, Campione-Barr, & Metzger, 2006). This is also 9
the age period in which disorders marked with changes in social behavior have their onset, 10
such as depression, anxiety, and psychosis (Kelleher et al., 2012; Schilbach, 2016). Early 11
detection of variability in social interaction styles associated with social impairments and their 12
development could enable timely prevention and intervention efforts. In adolescent 13
populations and prospective longitudinal designs, the rather extensive PCE previously used in 14
adults - fifteen rounds following a training phase, lasting up to one hour (e.g. Froese et al., 15
2014; Zapata-Fonseca et al., 2018) - may benefit from a considerably shortened design. We 16
therefore adapted and shortened the PCE to six rounds, and compared it with the original 17
fifteen-round design with regard to the ability to assess the learning of social contingency 18
detection. In addition, we conducted a ten-round version of the PCE in a subsample of 19
adolescents in order to test whether social contingency detection improves or asymptotes after 20
six rounds.
21 22
1.1 Research questions and hypotheses 23
The aim of this study is to assess the capacity for social contingency detection using a 24
modified, shortened version of the Perceptual Crossing Experiment (PCE) in adolescents.
25
Accordingly, the main research questions are: Does the modified six-round version of the 1
PCE assess 1) overall social contingency detection measured as amount of time spent 2
together, correct detection of the other, and subjective experience of interaction in all rounds, 3
and 2) learning of social contingency detection measured as an increase of levels of social 4
contingency detection across six rounds; and 3) in a ten-round version of the PCE, does the 5
average level of social contingency detection change in round seven to ten compared to round 6
one to six? Specific hypotheses are detailed in supplementary material A.
7 8
2. Methods 9
2.1 Sample 10
Data collection took place between February 2018 and May 2019. Participants were recruited 11
from the general population in Flanders, Belgium. This was done in secondary schools that 12
participated in a large longitudinal cohort study on adolescent mental health and development;
13
the SIGMA project (Kirtley et al., in preparation). Participation in the SIGMA project 14
included 100 minutes of completing questionnaires in groups of 20 to 24 adolescents, from 15
which eight were randomly selected to perform the PCE. The total number of participants was 16
148, of whom 116 completed six rounds and 32 completed ten rounds of the PCE (see 17
procedure). Participants received a 10 Euro voucher after full participation in the SIGMA 18
study. The exclusion criterion was an inadequate level of Dutch or English and therefore 19
failure to understand the instructions.Ethical approval was provided for the entire SIGMA 20
study protocol including the PCE (S6 1395). This study was registered prior to conducting the 21
analyses, after the data collection was finished, on the website of the Open Science 22
Framework (https://osf.io/jmbdr/?view_only=9206a27ca3834a7da8da116b6154d1ad). The 23
preregistration adheres to the disclosure requirements of this institutional registry.
24 25
2.2 Experimental setup 1
Participants played a game together with a randomly assigned partner. They were instructed 2
to imagine walking through a long, dark loop corridor with this partner. This is a virtual space 3
not visible to the participants, in which they could move an avatar on one axis back and forth 4
with their dominant hand, using a trackball. Their task was to find their partner’s (i.e. the 5
other) avatar in this space without communicating in any other way outside the interface. The 6
setup, in which participants sat back to back and listened to Brownian noise via a headphone, 7
prevented interactions outside the virtual space. Every time the participants’ avatar 8
overlapped with another entity in the virtual space, they received tactile feedback (i.e. a 9
vibration) on the hand moving the trackball. Within the virtual space, participants could not 10
only encounter the other avatar, but also a ‘chair’ and one ‘other moving entity’, which would 11
each give exactly the same tactile feedback during an encounter. The other avatar is an 12
animate, reactive entity. The ‘chair’ is an inanimate, non-reactive entity to be referred to as 13
static object. The ‘other moving entity’ is an animate, non-reactive entity moving exactly as 14
the other avatar but at a fixed distance of 150 pixels, to be referred to as the shadow. Each 15
avatar could sense only its own static object, not the other’s static object, which was 16
positioned in a different location in virtual space (Figure 1).
17
The experimental setup was based on a previous study using the PCE in adults (Froese 18
et al., 2014). The shared virtual space with connected endpoints consisted of 600 pixels and 19
the entities (static object, shadow and other avatar) were 4 pixels wide (Figure 1). On the 20
virtual line, the two static objects (one for each avatar) were fixed at 150 and 450 pixels. The 21
distance between the avatar and the shadow was 150 pixels. The tactile feedback indicating an 22
encounter involved vibration with a fixed intensity during the crossing of another entity, 23
making the duration of the vibration dependent on how much time the avatars’ pixels 24
overlapped with this entity. Without overlap the vibration was off.
25
1
Figure 1. The virtual one-dimensional space with connected endpoints and the relation between entities; avatar
2
A and B representing player A and B, respectively; shadow A and B representing the shadow of avatar A and B,
3
respectively; and each player’s static object.
4 5
2.3 Procedure 6
The total duration of the experiment was fifteen to twenty minutes. The first five minutes 7
were used for instruction (see supplementary material B). The experiment consisted of six or 8
ten one-minute rounds in which participants tried to complete the task of finding each other in 9
the virtual space, using tactile feedback only. They were instructed to press a button (i.e.
10
click) with their free hand at the moment that they were most confident of crossing the other 11
avatar. Participants could use the entire minute to explore the virtual space and could also 12
choose not to click in case they did not find the other avatar. They were instructed to stay in 13
the other avatar’s proximity after they clicked in order to help the other to complete the task in 14
this cooperative game. Each new round started with random starting positions for both 15
avatars. In order to find each other, participants were expected to distinguish between 16
inanimate and animate entities (static object vs. shadow and other avatar), and between non- 17
reactive and reactive entities (static object and shadow vs. other avatar). This was not 18
specified in the instruction to the participants. Each round was followed by three self-report 19
items on a tablet about participants’ subjective experience of interaction during that previous 20
round.
21
Participants did not receive any feedback on the behavior or clicking of their partner or 1
on their own performance during the experiment. They were debriefed about the purpose of 2
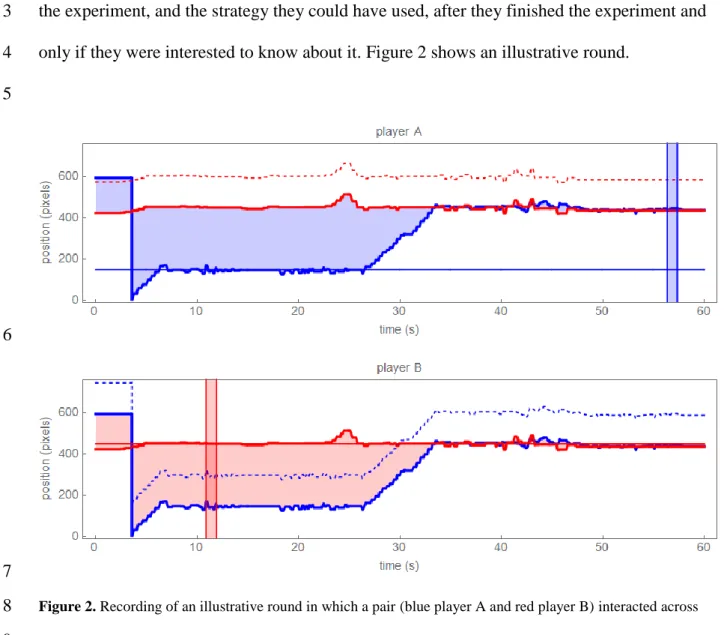
the experiment, and the strategy they could have used, after they finished the experiment and 3
only if they were interested to know about it. Figure 2 shows an illustrative round.
4 5
6
7
Figure 2. Recording of an illustrative round in which a pair (blue player A and red player B) interacted across
8
the virtual one-dimensional space (y-axis) over the 60 seconds (x-axis), represented for each player separately.
9
Solid bold blue and red lines represent the positions of the two players’ avatars. Dotted blue and red lines
10
represent the positions of their shadows, illustrated in the upper panel in red and in the lower panel in blue. Solid
11
light blue and red lines represent the location of each player’s static object. The vertical blue and red lines show
12
the clicks. Blue player A clicked correctly (click assigned to the other avatar) as shown in the upper panel, while
13
red player B clicked incorrectly (click assigned to the static object), as shown in the lower panel. Both players
14
spent time exploring their respective static object. The red player remained with the static object, while the blue
15
player started interacting with the red player after approximately 30 seconds.
16 17
2.4 Measures 1
2.4.1 Amount of time spent together 2
For each entity in the virtual space (i.e. other avatar, shadow, static object), the amount of 3
time spent with this entity was computed as the total time (in steps of 10 milliseconds) during 4
which the distance between the entity and the participant’s avatar was below a given 5
threshold. We set the threshold value at 70 pixels (see Froese et al., 2014). The amount of 6
time spent together with the other avatar was defined as the time (in milliseconds) that the 7
distance between the two participants’ avatars was below 70 pixels (referred to as time spent 8
together from here).
9 10
2.4.2 Correct detection 11
Both participants within a pair clicked independently and maximally once per round. The 12
click was assigned to the entity closest to the participant’s avatar within a distance of 70 13
pixels within one second before the click. This could be either the other avatar, the shadow, or 14
the static object. If none of these entities were within the 70 pixels distance, the click was 15
categorized as unclassified. Correct detection was defined as a click within 70 pixels distance 16
from the other avatar. This is a binary variable that was calculated per round per individual. It 17
was rated with ‘1’ if a click was correct (i.e. assigned to the other avatar), and ‘0’ if a click 18
was incorrect (i.e. all the other instances where there was a click). Correct detection of the 19
other is a variable that is independent of the other participant’s click and will be referred to as 20
correct detection from here.
21 22 23
2.4.3 Subjective experience of interaction 24
In order to measure participants’ subjective experience of interaction, three items were used:
1
‘To what extent did you feel that the other could sense your presence?’, ‘To what extent did 2
you feel you were doing something together?’, and ‘How confident were you that you clicked 3
correctly?’ Subjective experience of interaction was measured with a 7-point Likert scale 4
ranging from ‘1’ not at all to ‘7’ very much. The items on the subjective experience of 5
interaction were presented after each round to assess participants’ experience during that 6
entire previous round. The item ‘How confident were you that you clicked correctly?’ rated 7
the confidence of clicks and included ‘I haven’t clicked’ as an answer option, which was 8
coded as a missing value. Subjective experience of interaction will be computed as the 9
average of three items after rounds including a click, and as the average of two items after 10
rounds without a click. This variable will be referred to as subjective experience from here.
11 12
2.4.4 Click success 13
We defined the variable Click success per round with four levels per pair. This variable was 14
derived from correct detection, but is a paired variable where the value of the individual is 15
dependent on the value of the other within the pair. It was coded as follows: ‘0’ = no success 16
(both players scored 0 on correct detection), ‘1’ = single success (this player scored 1 on 17
correct detection, the other scored 0), ‘2’ = double success (both players scored 1 on correct 18
detection within the same round, irrespective of the time interval within the round), and ‘3’ = 19
joint success (both players scored 1 on correct detection within a distance of 70 pixels within 20
the same one second time interval). No click was coded as a missing value.
21 22 23 24
2.5 Analyses 25
For each analysis, age and gender were added as a priori covariates. Further, school, pair, and 1
participant were added as levels in the multilevel analyses to account for the nesting of rounds 2
within participants within pairs and within schools. If data were collapsed across rounds per 3
individual, the participant level was left out. An exploratory factor analysis was conducted to 4
statistically test whether the three items assessing subjective experience could be reduced to 5
one or two variables.
6
In order to compare the mean amount of time spent together (i.e. with the other avatar) 7
with the mean time spent with both the shadow and the static object, paired t-tests on 8
collapsed data per individual across all rounds were used (hypothesis 1a). Logistic mixed- 9
effect regression with only an intercept was conducted to test if the intercept was equal to 10
zero, i.e. testing if the probability of correct detection was at chance level (0.5) (hypothesis 11
1b). To test the hypotheses that subjective experience (dependent variable) was related to time 12
spent together (1c), proportion of correct detection (1d), or click success (1e), multilevel 13
mixed-effect regression analyses were estimated in three separate models. For hypotheses 1c 14
and 1d, data were collapsed per individual across all rounds. Proportion of correct detection 15
was calculated per individual by dividing the total number of correct clicks by the number of 16
total clicks.
17
Multilevel mixed-effect (logistic) regression analyses were fitted to examine whether 18
the three main outcome variables time spent together, correct detection, and subjective 19
experience were predicted by round as independent variable (hypotheses 2a, b and c).
20
Random intercept and slope were allowed and only linear models were fitted.
21
Finally, to examine whether there was a difference in the average level of main 22
outcome variables (variables time spent together, correct detection, and subjective experience) 23
in round one to six versus round seven to ten, a dummy level (round one to six = 0; round 7 to 24
10=1) was used as predictor variable (hypotheses 3a, b and c). For these analyses, only the 25
data from a subsample of 32 participants who completed ten consecutive rounds was used.
1
All analyses were preregistered (confirmatory).
2 3
3. Results 4
3.1 Sample and data characteristics 5
3.1.1 Descriptives 6
The initial sample included 164 participants. Sixteen participants were excluded from 7
analyses because of technical issues with the apparatus. The final sample included a total of 8
148 participants of whom 116 completed six rounds and 32 completed ten rounds of the PCE.
9
Forty participants were attending 1st year, 32 3rd year, and 76 5th year in the secondary 10
education system in Belgium. The age ranged from 12 to 19 years.
11
Visual inspection of the outcome variables and Shapiro-Wilk tests showed right- 12
skewed distributions of the variable time spent together. In order to meet the requirement for 13
normal distribution of outcome variables, the variables reflecting time spent together (as well 14
as time spent with other shadow and static object) were square-root transformed. This 15
transformation was selected because the data were right skewed and included zero values. In 16
reporting the results, the mean values were back-transformed by squaring the values. To 17
facilitate interpretation, we reported time spent together in seconds.
18 19
3.1.2 Exploratory factor analysis on subjective experience of interaction 20
Across rounds and per round, the three items used in the current study showed a significant 21
Bartlett’s test and a KMO above .5, fulfilling the requirements to conduct a factor analysis.
22
The results indicated presence of one underlying factor. Our subjective experience score 23
therefore reflected the explicit awareness of the other and the other’s conscious awareness of 24
the self, in combination with confidence of the presence of the other. Across rounds and per 25
round, the mean score subjective experience indeed supported one underlying factor with an 1
eigenvalue above 1. Mean scores of each item showed low uniqueness values (ranging from 2
.10 to .39), indicating that their variance was well explained by the variable subjective 3
experience. The inter-item reliability of the three items per round was high, with a Cronbach’s 4
alpha ranging from .85 to .92.
5 6
3.2 Social contingency detection across rounds 7
Time spent together - Across rounds, time spent together (mean=20s) was significantly 8
higher than time spent with the shadow (mean=11s; p<.001) and the static object (mean=18s;
9
p=.002). Time spent with the shadow was significantly lower than time spent with both the 10
other avatar and the static object (p<.001).
11
Correct detection - Correct detection of the other was not at chance level (p=.010).
12
Participants clicked during 79.2% of rounds (805 out of 1016 potential clicks). In 41.9% of 13
these cases, the click was correct, i.e. detection of the other was successful. In 6.6% of cases, 14
both the other avatar and either the other avatar’s shadow or the static object were within 70 15
pixels of the avatar. In these cases, a click was assigned to the other avatar, i.e. defined as 16
correct. Clicks were assigned to the static object in 33.8% of total clicks and to the shadow in 17
15.3% of total clicks. In 9.1% of cases, the clicks were categorized as unclassified because 18
these did not occur within 70 pixels distance from any of the entities.
19
Subjective experience - Subjective experience increased when more time was spent together, 20
although this did not reach statistical significance (B=.04 (.02), 95% CI: -.00 to .08, p=.074) 21
whereas subjective experience was significantly associated with click success (B=.18 (.04), 22
95% CI: .10 to .27, p<.001). It was not associated with proportion of correct detection (B=-.01 23
(.41), 95% CI: -.8 to .79, p=.973).
24
Click success (associated with subjective experience) - Across rounds, 58.1% of clicks 1
were incorrect, 22.4% were single successes, 16.6% were double successes, and 2.9% were 2
joint successes. Due to the low frequency of joint successes, these were counted as double 3
successes, resulting in 19.5% of clicks falling into this category. Compared with an incorrect 4
click, double success was associated with a significant increase of subjective experience 5
(B=.23 (.07), 95% CI: .10 to .36, p=.001). The difference between single success and double 6
success was also associated with a significant increase of subjective experience (B=.22 (.08), 7
95% CI: .07 to .38, p=.004). The difference between incorrect clicks and single success clicks 8
was not associated with an increase of subjective experience (B=.01 (.06), 95% CI: -.12 to 9
.13, p=.929).
10 11
3.3 Learning of social contingency detection across rounds 12
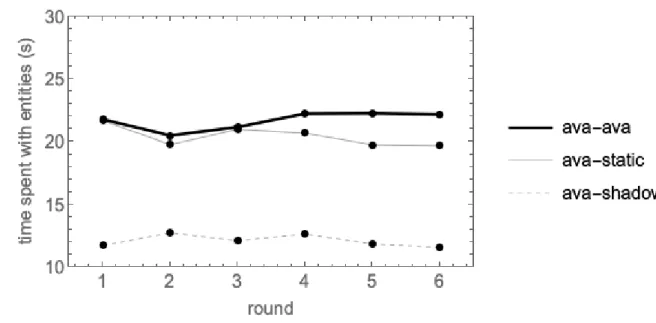
For each outcome variable, we tested whether the average level changed throughout the 13
experiment, from round one to six. First, round was not significantly associated with time 14
spent together (p=.719), such that time spent together remained at a similar level during the 15
experiment. This is illustrated in Figure 3, in addition to showing that the time spent with the 16
shadow remained at a similar (lower) level. Moreover, the illustration shows a decreasing 17
trend of time spent with the static object after the third round. Second, round was associated 18
with a significant increase of probability of correct detection (B=.07 (.04), 95% CI: 0.00 to 19
.14, p=.05), such that there is some indication that the probability of correct detection 20
increased per round. Click assignment started in the first round more or less at random with 21
about the same number of clicks assigned to the other avatar, static object, or shadow. With 22
successive rounds, there was a clear increasing trend, with half of the clicks assigned to the 23
other avatar at the sixth round. The other half of click assignment was distributed over the 24
other entities with decreasing numbers to the static object and the shadow. Correct detection 25
was 25% after round one and 50% after round six. Lastly, round was associated with 1
subjective experience (B=.07 (.01), 95% CI: .04 to .10, p<.001), such that subjective 2
experience increased across rounds.
3 4
5
Figure 3. The amount of time spent with entities per round. The bold line represents the amount of time spent
6
with the other avatar (ava), the light line represents the amount of time spent with the static object (static), and
7
the dotted line represents the amount of time spent with the shadow (shadow).
8 9
3.4 Comparison of average social contingency detection levels between six-round version and 10
extended ten-round version 11
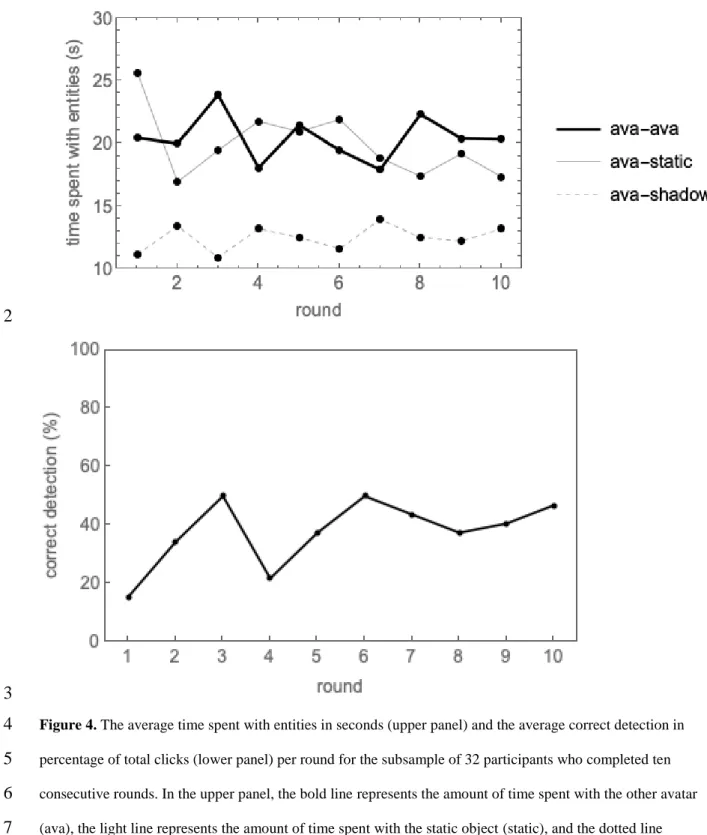
In order to compare the six-round version with a ten-round version, a subsample of 32 12
participants who performed ten rounds was used for the analysis. The dummy variable 13
reflecting either round one to six (0) or round seven to ten (1) was not significant in any of the 14
associations tested for research question 2. This indicated that there was no evidence for a 15
change in average level of time spent together, correct detection, and subjective experience in 16
round one to six compared with the average level in round seven to ten. The results for time 17
spent together and correct detection are illustrated in Figure 4, in which the average for these 18
variables is shown per round.
19
1
2
3
Figure 4. The average time spent with entities in seconds (upper panel) and the average correct detection in
4
percentage of total clicks (lower panel) per round for the subsample of 32 participants who completed ten
5
consecutive rounds. In the upper panel, the bold line represents the amount of time spent with the other avatar
6
(ava), the light line represents the amount of time spent with the static object (static), and the dotted line
7
represents the amount of time spent with the shadow (shadow).
8 9
3.5 Covariates 10
Age was a significant covariate in testing the association between round and correct detection, 1
such that there is a significant positive effect on the average level of round and correct 2
detection. Gender was not significant in any of the associations.
3 4
4. Discussion 5
4.1 Main findings 6
This is the first study that used the PCE in adolescents in order to assess real-time social 7
contingency. Our results showed that the six-round version of the PCE had the capacity to 8
assess social contingency detection in adolescents, across all rounds, in terms of amount of 9
time spent together and correct detection of the other. Across rounds, correct detection of the 10
other improved and the level of subjective experience of interaction increased. Importantly, 11
we found subjective experience to be increased for rounds with double correct clicks 12
compared to rounds with single and incorrect clicks. The average level of social contingency 13
detection did not significantly change in round seven to ten compared with round one to six.
14 15
4.2 Comparison with previous findings 16
Overall, our six-round setup in adolescents has shown a similar capacity to assess social 17
contingency detection as was shown in previous studies in adults that used a more extended 18
setup (e.g. Auvray et al., 2009; Froese et al., 2014). This indicates that the setup used in this 19
study is feasible in an adolescent population, and that the shortened version has a similar 20
capacity to assess social contingency detection as did the longer version used previously. We 21
have shown that correct detection of the other was, on average, not at chance level. Further, 22
we reported a similar percentage of absent clicks compared with Froese et al. (2014).
23
Contrastingly, differences between number of clicks assigned to the other avatar and the static 24
object were less marked compared with this previous adult study. This may be explained by 25
the current setup’s absence of training rounds, which were included by Froese et al. (2014). In 1
this training phase, participants became familiar with distinguishing the regular stimulation 2
received while moving back and forth across a static object, and the comparatively regular 3
stimulation received when two players engaged in a coordinated back-and-forth interaction 4
(Di Paolo, Rohde, & Iizuka, 2008). Indeed, Figure 3 indicated that players started spending 5
less time with the static object after three rounds, suggesting that they distinguished this entity 6
from the other avatar after having experienced both stimulations in the first three rounds.
7
Further, we reported a lower correct detection rate compared with Froese et al. (2014). This 8
difference could be interpreted in light of a more advanced level of decision-making in adults, 9
specifically affecting the decision to click. That is, although adolescents’ number of explicit 10
judgments about an interaction (i.e. clicking) was lower than what was found in adult studies, 11
they did spent most time together and less time with other entities, which was also expected 12
based on these previous adult studies (Auvray et al., 2009; Froese et al., 2014). They were 13
also successful in ignoring the shadow, as evidenced by spending least time with this entity, 14
most likely because of its unstable, non-responsive character, which did not need sustained 15
attention to successfully reach the goal of the task. In other words, while participants were 16
successful at engaging in interaction, they did not make this explicit as often as adults did.
17
Although we cannot conclude from our findings whether this is due to being unaware of the 18
other or lacking judgment while being aware of the other, we argue that this difference is 19
likely to be explained by the age difference between the compared samples. Indeed, age had a 20
significant positive effect on the average level of round and correct detection. This warrants 21
future subgroup analyses of age, for instance to test the hypothesis that the capacity of making 22
explicit judgments about social contingency continues to develop during adolescence.
23
This is the first study that replicated the increase of subjective experience in cases of 24
mutual correct detection compared with single detection and incorrect detection, as was found 25
by Froese et al. (2014). This serves as proof of principle that the subjective experience of 1
social interaction is not something specific for one individual in the interaction or related to 2
social cognitive capacities of one individual, but rather comes about as the result of a dynamic 3
coupling of two individuals in the interaction. The partners in the dynamical system 4
experience most interaction when both have detected the social contingency. This was further 5
supported by the different associations between subjective experience and, on the one hand, 6
proportion of correct detection (individual variable), and, on the other hand, click success 7
(paired variable). As the three items assessing subjective experience formed one single factor, 8
this indicated that participants were particularly aware of the other participant via the other’s 9
interactional directedness toward themselves. Taken together, these results demonstrate the 10
importance of studying social interactive capacity for social contingency detection that is 11
associated with the experience of interaction, rather than studying cognitive processes internal 12
to the individual’s brain (Buzan, Kupfer, Eastridge, & Lema-Hincapie, 2014).
13
Our findings in random pairs from the general population showed that time spent 14
together did not change per round, indicating that participants kept exploring the space rather 15
than increasingly staying with the other avatar. In contrast, Zapata-Fonseca et al. (2018) found 16
controls to decrease their exploring behavior in interaction with individuals with autism 17
spectrum disorder. This may also be explained by the difference in age, with an adult 18
population more easily reaching a decision and sticking to what they think is the other person.
19
Alternatively, it may be due to the characterization, with the healthy controls adapting their 20
interaction strategy to their partner with autism spectrum disorder.
21 22 23
4.3 Are six rounds sufficient to capture social contingencies with the PCE in adolescents?
24
As illustrated in Figure 4, the level of time spent together, correct detection, and subjective 1
experience did not further increase after six rounds when the experiment was extended with 2
four additional rounds. After four rounds, there is a decrease in percentage of correct 3
detection. This sudden drop to nearly the participants’ average starting level suggests that 4
something changed in explicitly judging about the interaction after a few rounds. This could 5
be explained by the concept of (reinforcement) learning, including implicit and explicit 6
learning (e.g. Barch et al., 2017; Berridge, 2004). The literature on sensorimotor learning in 7
specific has suggested that this starts with implicit learning, followed by explicit learning 8
(Taylor & Ivry, 2011; Taylor, Krakauer, & Ivry, 2014). These previous studies showed a 9
decrease in performance when participants started to employ an explicit strategy to reach a 10
goal, and it was suggested that this is due to a shift from action based on sensory-prediction 11
error (i.e. difference between actual and predicted outcome) to action based on target error 12
(i.e. difference between actual and targeted outcome). The latter can be interpreted as a shift 13
to problem solving, in which participants attempt to use a cognitive strategy, which first leads 14
to worse performance but is followed by a synergy of both ways of learning. This idea is in 15
line with our findings in showing an increase of performance again after four rounds. It is also 16
a hypothesis that requires further study, as the performance stabilized at a similar level as 17
before, which might be lower than expected from a synergistic mode of sensitivity to social 18
contingency detection. Nevertheless, this stabilization of performance did provide evidence 19
that six rounds are sufficient to capture a stable level of social contingency detection and 20
learning thereof. Our findings are also in concordance with subjective free-text reports 21
obtained within the fifteen-round version by Froese et al. (2014), suggesting that players 22
became aware of the other after only a few rounds already. More variation in time spent with 23
entities in Figure 4 compared with Figure 3 is probably due to the smaller sample size used in 24
the analysis of the ten-round version of the experiment. Indeed, the standard error for the 25
mean values given in Figure 3 was lower than the standard error for the mean values given in 1
Figure 4 (supplementary C). This was the case for each round, except for the fourth round, in 2
which the standard deviation and error were higher in Figure 3 compared with Figure 4. The 3
drop in time spent together during this round is in line with the sudden drop of proportion of 4
correct detection during this round, potentially explained by the earlier mentioned concept of 5
(reinforcement) learning. Overall, based on these results, a six-round version of the PCE 6
seems reliable and valid in an adolescent sample. It would therefore be interesting to use this 7
setup in order to further investigate the reason underlying the lower correct detection rate in 8
adolescents compared with adults.
9 10
4.4 Future considerations regarding methodology 11
The 70-pixel interval used for click assignment could be tailored to the data to determine the 12
specific sample’s optimal proximity range. This may be important in samples characterized by 13
different styles of decision-making compared with healthy adults, such as in patients with 14
psychosis (Garety et al., 2018), or in a younger population such as the sample used in the 15
current study (Crone, 2013). Another consideration is to include measures of mutual 16
coordination, for example by using complexity matching at the pair level (Kojima et al., 2017;
17
Zapata-Fonseca et al., 2019), or time series analysis for turn-taking (Zapata-Fonseca et al., 18
2016). While a correct click was defined as the correct, but explicit, detection of the other 19
from the experimenter’s point of view, the actual interaction or co-regulation might not 20
always need to be made explicit in order to be successful from the participants’ subjective 21
perspective. Indeed, our correct detection rate in adolescents was lower compared with adults.
22
Further, Zapata-Fonseca et al. (2018) have shown that click correctness did not distinguish 23
participants with high functioning autism from controls, while interaction patterns differed.
24
Potential ambiguity in the interpretation of quantitative findings could be solved by including 25
a qualitative aspect and compare this with the quantitative findings (Froese et al., 2014).
1
Finally, we expect the PCE to explain more variance in social interaction compared with less 2
ecologically valid experiments that focus on the individual. This hypothesis needs to be 3
substantiated by first studying associations between our experimental findings and other ways 4
of measuring social interaction, such as retrospective self-report questionnaires and 5
momentary assessments in daily life. This would also provide studies investigating social 6
interaction and social functioning with a paradigm to answer research questions about 7
underlying mechanisms of social behavior, its development, and its potential variability 8
within and between individuals.
9 10
5. Conclusion 11
The current findings indicate that the assessment and learning of social contingency detection 12
can be achieved in an adolescent population by using a short and simple setup, without 13
requiring training or complicated instructions. The potential role of age on social contingency 14
detection warrants its inclusion in prospective studies that will aid in elucidating the complex 15
nature of social interaction, even more if the link with social functioning can be established.
16 17
Open Practices Statements 18
None of the data or materials for the experiments reported here is available. The study was 19
preregistered at the website of the Open Science Framework, available via 20
https://osf.io/jmbdr/?view_only=9206a27ca3834a7da8da116b6154d1ad. Discrepancies 21
between the preregistration and the final report are detailed in supplementary material D.
22 23
Funding 24
This work was supported by the FWO Odysseus grant to Inez Myin-Germeys (ZKD1475-03- 1
W01). RF and LZ-F acknowledge financial support from the Universidad Nacional Autónoma 2
de México (UNAM) through the DGAPA-PAPIIT project IA102619, and from the Consejo 3
Nacional de Ciencia y Tecnología (CONACyT) through project Fronteras de la Ciencia 2016- 4
01-2277. LZ-F is grateful for the scholarship 638215 granted by the CONACyT, and and a 5
scholarship in the programme Research Grants-Bi-nationally Supervised Doctoral Degrees, 6
2019/20 granted by the German Academic Exchange Service (DAAD, Deutscher 7
Akademischer Austauschdienst). RF is grateful for the Newton Advanced Fellowship 8
awarded by the Academy of Medical Sciences through the UK Government.
9 10 11 12 13 14 15 16 17 18 19 20 21 22 23 24
References 25
Auvray, M., Lenay, C., & Stewart, J. (2009). Perceptual interactions in a minimalist virtual 1
environment. New Ideas in Psychology, 27(1), 32-47.
2
doi:10.1016/j.newideapsych.2007.12.002 3
Auvray, M., & Rohde, M. (2012). Perceptual crossing: the simplest online paradigm.
4
Frontiers in Human Neuroscience, 6, 181. doi:10.3389/fnhum.2012.00181 5
Barch, D. M., Carter, C. S., Gold, J. M., Johnson, S. L., Kring, A. M., MacDonald, A. W., . . . 6
Strauss, M. E. (2017). Explicit and implicit reinforcement learning across the 7
psychosis spectrum. Journal of Abnormal Psychology, 126(5), 694-711.
8
doi:10.1037/abn0000259 9
Barch, D. M., Pagliaccio, D., & Luking, K. (2016). Mechanisms Underlying Motivational 10
Deficits in Psychopathology: Similarities and Differences in Depression and 11
Schizophrenia. Current Topics in Behavioral Neurosciences, 27, 411-449.
12
doi:10.1007/7854_2015_376 13
Berridge, K. C. (2004). Motivation concepts in behavioral neuroscience. Physiology and 14
Behavior, 81(2), 179-209. doi:10.1016/j.physbeh.2004.02.004 15
Blakemore, S. J., & Choudhury, S. (2006). Development of the adolescent brain: implications 16
for executive function and social cognition. Journal of Child Psychology and 17
Psychiatry, 47(3-4), 296-312. doi:DOI 10.1111/j.1469-7610.2006.01611.x 18
Bosco, F. M., Gabbatore, I., & Tirassa, M. (2014). A broad assessment of theory of mind in 19
adolescence: The complexity of mindreading. Consciousness and Cognition, 24, 84- 20
97. doi:10.1016/j.concog.2014.01.003 21
Brizio, A., Gabbatore, I., Tirassa, M., & Bosco, F. M. (2015). No more a child, not yet an 22
adult": studying social cognition in adolescence. Frontiers in Psychology, 6.
23
doi:ARTN 1011 24
10.3389/fpsyg.2015.01011 25
Buzan, R. D., Kupfer, J., Eastridge, D., & Lema-Hincapie, A. (2014). Philosophy of mind:
26
Coming to terms with traumatic brain injury. NeuroRehabilitation, 34(4), 601-611.
27
doi:10.3233/Nre-141071 28
Crone, E. A. (2013). Considerations of Fairness in the Adolescent Brain. Child Development 29
Perspectives, 7(2), 97-103. doi:10.1111/cdep.12022 30
De Jaegher, H., & Di Paolo, E. (2008). Making Sense in Participation: An Enactive Approach 31
to Social Cognition. In F. M. e. al. (Ed.), Enacting Intersubjectivity: IOS Press.
32
De Jaegher, H., Di Paolo, E., & Gallagher, S. (2010). Can social interaction constitute social 1
cognition? Trends in Cognitive Sciences, 14(10), 441-447.
2
doi:10.1016/j.tics.2010.06.009 3
Deschamps, L., Lenay, C., Rovira, K., Le Bihan, G., & Aubert, D. (2016). Joint Perception of 4
a Shared Object: A Minimalist Perceptual Crossing Experiment. Frontiers in 5
Psychology, 7, 1059. doi:10.3389/fpsyg.2016.01059 6
Di Paolo, E. A., Rohde, M., & Iizuka, H. (2008). Sensitivity to social contingency or stability 7
of interaction? Modelling the dynamics of perceptual crossing. New Ideas in 8
Psychology, 26(2), 278-294. doi:10.1016/j.newideapsych.2007.07.006 9
Fett, A. K. J., Viechtbauer, W., Dominguez, M. d. G., Penn, D. L., van Os, J., & Krabbendam, 10
L. (2011). The relationship between neurocognition and social cognition with 11
functional outcomes in schizophrenia: A meta-analysis. In (Vol. 35, pp. 573-588).
12
Froese, T. (2018). Searching for the conditions of genuine intersubjectivity: From agent-based 13
models to perceptual crossing experiments. In N. A., L. de Bruin, & S. E. Gallagher 14
(Eds.), The Oxford Handbook of 4E Cognition. Oxford: Oxford University Press.
15
Froese, T., & Di Paolo, E. A. (2011). The enactive approach Theoretical sketches from cell to 16
society. Pragmatics & Cognition, 19(1), 1-36. doi:10.1075/pc.19.1.01fro 17
Froese, T., Iizuka, H., & Ikegami, T. (2014). Embodied social interaction constitutes social 18
cognition in pairs of humans: a minimalist virtual reality experiment. Scientific 19
Reports, 4(1), 3672. doi:10.1038/srep03672 20
Garety, P., Freeman, D., Jolley, S., Ross, K., Waller, H., & Dunn, G. (2018). Jumping to 21
conclusions: the psychology of delusional reasoning. Advances in Psychiatric 22
Treatment, 17(05), 332-339. doi:10.1192/apt.bp.109.007104 23
Hermans, K. S. F. M., Achterhof, R., Myin-Germeys, I., Kasanova, Z., Kirtley, O., &
24
Schneider, M. (2019). Improving ecological validity in research on social cognition. In 25
E. Lewandowski & A. M. Moustafa (Eds.), Social Cognition in Psychosis: Elsevier 26
Publishers.
27
Hutto, D. D., Herschbach, M., & Southgate, V. (2011). Editorial: Social Cognition:
28
Mindreading and Alternatives. Review of Philosophy and Psychology, 2(3), 375-395.
29
doi:10.1007/s13164-011-0073-0 30
Kelleher, I., Connor, D., Clarke, M. C., Devlin, N., Harley, M., & Cannon, M. (2012).
31
Prevalence of psychotic symptoms in childhood and adolescence: a systematic review 32
and meta-analysis of population-based studies. Psychological Medicine, 42(9), 1857- 33
1863. doi:10.1017/S0033291711002960 34
Kirtley, O. J., Achterhof, R., Hagemann, N., Hermans, K. S. F. M., Hiekkaranta, A. P., Lecei, 1
A., . . . Myin-Germeys, I. (in preparation). SIGMA, a longitudinal study of adolescent 2
mental health and development using the experience sampling method: Cohort 3
characteristics and protocol.
4
Kojima, H., Froese, T., Oka, M., Iizuka, H., & Ikegami, T. (2017). A Sensorimotor Signature 5
of the Transition to Conscious Social Perception: Co-regulation of Active and Passive 6
Touch. Frontiers in Psychology, 8, 1778. doi:10.3389/fpsyg.2017.01778 7
Murray, L., & Trevarthen, C. (1985). Emotional regulation of interactions between two- 8
month-olds and their mothers. In T. M. Field & N. A. Fox (Eds.), Social Perception in 9
Infants (pp. 177-197). Norwood, NJ: Ablex Publishers.
10
Nadel, J., Carchon, I., Kervella, C., Marcelli, D., & Reserbat-Plantey, D. (1999). Expectancies 11
for social contingency in 2-month-olds. Developmental science, 2(2), 164-173.
12
doi:10.1111/1467-7687.00065 13
Penn, D. L., Sanna, L. J., & Roberts, D. L. (2008). Social cognition in schizophrenia: an 14
overview. Schizophrenia Bulletin, 34(3), 408-411. doi:10.1093/schbul/sbn014 15
Reddy, V. (2010). How Infants Know Minds: Harvard University Press.
16
Schilbach, L. (2016). Towards a second-person neuropsychiatry. Philosophical Transactions 17
of the Royal Society of London. Series B: Biological Sciences, 371(1686), 20150081.
18
doi:10.1098/rstb.2015.0081 19
Schilbach, L., Timmermans, B., Reddy, V., Costall, A., Bente, G., Schlicht, T., & Vogeley, K.
20
(2013). Toward a second-person neuroscience. Behavioral and Brain Sciences, 36(04), 21
393-414. doi:10.1017/S0140525X12000660 22
Schneider, M., Myin, E., & Myin-Germeys, I. (2019). Is theory of mind a prerequisite for 23
social interactions? A study in psychotic disorder. Psychological Medicine, 1-7.
24
doi:https://doi.org/10.1017/S0033291719000540 25
Simons, C. J., Bartels-Velthuis, A. A., & Pijnenborg, G. H. (2016). Cognitive Performance 26
and Long-Term Social Functioning in Psychotic Disorder: A Three-Year Follow-Up 27
Study. PloS One, 11(4), e0151299. doi:10.1371/journal.pone.0151299 28
Smetana, J. G. (2010). Adolescents, Families, and Social Development. How Teens Construct 29
Their Worlds.: Wiley-Blackwell.
30
Smetana, J. G., Campione-Barr, N., & Metzger, A. (2006). Adolescent development in 31
interpersonal and societal contexts. Annual Review of Psychology, 57(Petersen 1988), 32
255-284. doi:10.1146/annurev.psych.57.102904.190124 33
Taylor, J. A., & Ivry, R. B. (2011). Flexible cognitive strategies during motor learning. PLoS 1
Computational Biology, 7(3), e1001096. doi:10.1371/journal.pcbi.1001096 2
Taylor, J. A., Krakauer, J. W., & Ivry, R. B. (2014). Explicit and implicit contributions to 3
learning in a sensorimotor adaptation task. Journal of Neuroscience, 34(8), 3023- 4
3032. doi:10.1523/JNEUROSCI.3619-13.2014 5
Zapata-Fonseca, L., Dotov, D., Fossion, R., & Froese, T. (2016). Time-Series Analysis of 6
Embodied Interaction: Movement Variability and Complexity Matching As Dyadic 7
Properties. Frontiers in Psychology, 7, 1940. doi:10.3389/fpsyg.2016.01940 8
Zapata-Fonseca, L., Dotov, D., Fossion, R., Froese, T., Schilbach, L., Vogeley, K., &
9
Timmermans, B. (2019). Multi-Scale Coordination of Distinctive Movement Patterns 10
During Embodied Interaction Between Adults With High-Functioning Autism and 11
Neurotypicals. Frontiers in Psychology, 9. doi:10.3389/fpsyg.2018.02760 12
Zapata-Fonseca, L., Froese, T., Schilbach, L., Vogeley, K., & Timmermans, B. (2018).
13
Sensitivity to Social Contingency in Adults with High-Functioning Autism during 14
Computer-Mediated Embodied Interaction. Behav Sci (Basel), 8(2).
15
doi:10.3390/bs8020022 16
17 18 19 20 21 22 23 24 25 26 27 28 29 30
Appendices 1
Supplementary A: Hypotheses 2
Research question 1 3
Hypothesis 1a: Time spent together (milliseconds spent together within 70 pixels apart) will 4
be higher than time spent with the other’s shadow or the static object 5
Hypothesis 1b: Correct detection (binary variable with 0 if incorrect click and 1 if correct 6
click) will not be at chance level 7
Hypothesis 1c: Subjective experience of interaction (mean score of two or three items) will 8
increase as a function of time spent together 9
Hypothesis 1d: Subjective experience of interaction will increase as a function of proportion 10
of correct detection 11
Hypothesis 1e: Subjective experience of interaction will increase as a function of click 12
success (paired variable derived from correct detection) 13
Research question 2 14
Hypothesis 2a: Time spent together will increase as a function of round 15
Hypothesis 2b: Proportion of correct detection will increase as a function of round 16
Hypothesis 2c: Subjective experience of interaction will increase as a function of round 17
18
19
Research question 3 1
Hypothesis 3a: The intercept of time spent together in round seven to ten will not significantly 2
differ from the intercept in round one to six 3
Hypothesis 3b: The intercept of proportion of correct detection in round seven to ten will not 4
significantly differ from the intercept in round one to six 5
Hypothesis 3c: The intercept of subjective experience of interaction in round seven to ten will 6
not significantly differ from the intercept in round one to six 7
8
9
10
11
12
13
14
15
16
17
18
Supplementary B: Instruction with metaphor 1
We are going to play a kind of game and you will be playing together with someone else. You 2
will not be competing against each other, but you will collaborate. You will play in these two 3
couples (point to show participants who will play with who, back to back). Now listen 4
carefully: I would like you to imagine that you and your partner are walking together in a 5
long, dark corridor. The corridor is round (make gestures) so you can walk round endlessly.
6
This is a virtual task so we will not be really walking, but you can ‘walk’ by moving the 7
trackball with your dominant hand (show this), back and forth. You can therefore either walk 8
forwards or backwards. You cannot walk to the side, as the corridor is very narrow. You will 9
be walking there with your partner only, so the other couple with be in another corridor. The 10
corridor is dark, so you cannot see each other. You are indeed sitting back to back. You also 11
will not be able to hear each other as I will ask you in a minute to put on your headphones.
12
Now, it is your task to find each other in the dark corridor. How can you achieve this, without 13
seeing or hearing each other? (Ask participants to answer) Yes, by feeling each other. You 14
will not do this in real life again, but you will ‘feel’ the other person’s passing by receiving a 15
vibration on your hand. You will just be walking through the corridor and each time you pass 16
the other, you will feel this vibration. You have one minute to find each other, and you can 17
see this minute counting back at your screen. At the moment you think you are crossing the 18
other and you are most certain about, you can push the blue button with your other hand. You 19
can only push this button once per minute, so you can use the entire minute to do so. If, at the 20
end of the minute, you feel you did not find the other, you do not need to push the button. You 21
you either do it once, or not at all. In order to make this task a bit harder, you can also 22
encounter a chair and another moving object in the corridor, next to your partner. These two 23
other objects will also give you a vibration on your hand if you cross them, similar to the 24
vibration you receive when you cross your partner. Now it is up to you to find a way to find 25
your partner, and you should collaborate in doing so. If you pushed the button because you 1
feel you found your partner, you should continue playing until the minute ends in order to still 2
help your partner to find you as well. We will play six rounds of one minute. Is your task 3
clear? After each round, I will ask you to complete three questions on your tablet.
4
5 6 7 8 9 10 11 12 13 14 15 16 17 18 19 20 21 22 23 24
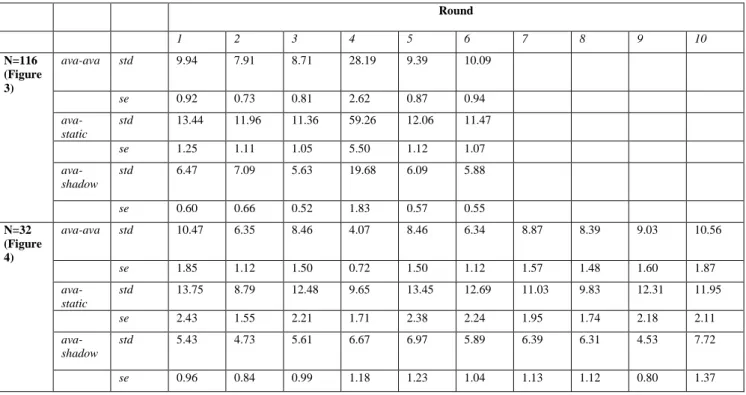
Supplementary C: Standard deviation and standard error per round as illustrated in 1
Figure 3 and 4 2
Table 1. Standard deviation (std) and standard error (se) for time spent with the other avatar (ava-ava), time
3
spent with the static object (ava-static), and time spent with the shadow (ava-shadow) per round. The mean
4
values of these variables represent the lines in Figure 3 (N=116) and Figure 4 (N=32).
5
Round
1 2 3 4 5 6 7 8 9 10
N=116 (Figure 3)
ava-ava std 9.94 7.91 8.71 28.19 9.39 10.09
se 0.92 0.73 0.81 2.62 0.87 0.94
ava- static
std 13.44 11.96 11.36 59.26 12.06 11.47
se 1.25 1.11 1.05 5.50 1.12 1.07
ava- shadow
std 6.47 7.09 5.63 19.68 6.09 5.88
se 0.60 0.66 0.52 1.83 0.57 0.55
N=32 (Figure 4)
ava-ava std 10.47 6.35 8.46 4.07 8.46 6.34 8.87 8.39 9.03 10.56
se 1.85 1.12 1.50 0.72 1.50 1.12 1.57 1.48 1.60 1.87
ava- static
std 13.75 8.79 12.48 9.65 13.45 12.69 11.03 9.83 12.31 11.95
se 2.43 1.55 2.21 1.71 2.38 2.24 1.95 1.74 2.18 2.11
ava- shadow
std 5.43 4.73 5.61 6.67 6.97 5.89 6.39 6.31 4.53 7.72
se 0.96 0.84 0.99 1.18 1.23 1.04 1.13 1.12 0.80 1.37
6 7 8 9 10 11 12 13 14 15 16 17 18
Supplementary D: Transparent changes document 1
2
Study Information 3
Discrepancies between the preregistration of this study (published online 5-9-18:
4
https://osf.io/jmbdr/?view_only=9206a27ca3834a7da8da116b6154d1ad) and the final report 5
before submission were added in another font and color in every section. Overall, it became 6
clear over the course of conducting the analyses and writing up the report that the final 7
manuscript should be simplified and include a comprehensible overview of the main goals for 8
a methodological paper. Based on this consideration, we decided to change variable names 9
and leave out some more advanced or content analyses.
10 11
1. The Perceptual Crossing Experiment in adolescents 12
1.1. Running title: PCE in adolescents 13
14
2. Authorship 15
K.S.F.M. Hermans, L. Zapata-Fonseca, Z. Kasanova, R. Fossion, T. Froese, I. Myin- 16
Germeys (order to be established) 17
Order changed to Karlijn S.F.M. Hermans, Zuzana Kasanova, Leonardo Zapata-Fonseca, 18
Ginette Lafit, Ruben Fossion, Tom Froese, Inez Myin-Germeys 19
Ginette Lafit was included for statistical support.
20 21
3. Research Questions 22
1) Does the modified 6-round version of the Perceptual Crossing Experiment (PCE) 23
assess social contingency detection (measured as time spent with other avatar, correct 24
click proportion, and perceptual awareness) in adolescents across all rounds?
25
2) Does the modified 6-round version of the PCE detect gradual acquisition of social 26
contingency detection per round?
27
3) In a modified 10-round version of the PCE, does the level of acquisition of social 28
contingency detection change in round 7 to 10 compared to round 1 to 6?
29 30
1) Does the modified six-round version of the PCE assess overall social contingency 31
detection measured as amount of time spent together, correct detection of the other, 32
and subjective experience 33