1
Analysis of Material Flow for Shoe Production Process using GERT
Mitsuo YAMASHIRO1, Masato SASAKI1 and Wodaje HELETWORK Bekele2
1 Department of Innovative Engineering
2 Graduate School of Engineering, Master Course
1. Introduction
Nowadays Ethiopia’s footwear industry is becoming a promising manufacturing sector. The industry is supporting the growing economy of the country especially by exporting finished footwear to the global market. Even if the industry is becoming promising it is facing many straggles of being competitive in the international market. Almost all footwear factories in Ethiopia are operating the production intensively manual. This traditional manual operation has negative impact not only on the production output but also on the material flow of the shoe production process. Graphical Evaluation and Review Technique, commonly known as GERT 1) ~ 7) is a network analysis technique that allows probabilistic treatment both network logic and estimation of activity duration. GERT is an approach
used for analyzing a class of networks with the characteristics of a probability that a branch of the network is part of a realization of the network and a duration time or time interval associated with the branch if the branch is part of the realization of the network. Such networks are referred to as stochastic networks and consist of a set of branches and nodes.
In this paper, we try to analysis the manufacturing process of the shoe production company in Ethiopia using GERT. After modeling the network from raw material to the finished footwear, the expected completion time, variance and probability distribution of the completion time are evaluated 8) ~ 11) . By utilizing the result, we try to propose an improvement plan of the manufacturing process for the shoe production.
Abstract
The Graphical Evaluation and Review Technique (GERT) is an approach used for analyzing a class of networks with the characteristics of probability that a branch of the network is part of a realization of the network duration time or time interval associated with the branch .
In this study, we deal with the network model from raw material to the finished footwear in Ethiopia’s production factory. Such network is referred to as stochastic network and consists of a set of branches and nodes. Expected completion time, variance and probability distribution of the completion time of the material are evaluated. By utilizing the results, we try to propose an improvement plan on the material flow of the production process for the shoe manufacturing factory. We can plan to encounter the bottleneck process of lasting and stitching operations so as to improve the productivity and quality of the overall shoe production process along with the Kaizen activity.
Keywords: GERT, Expected completion time, Variance, Probability distribution, Shoe production process, Material flow
2 2. Material flow for shoe production process
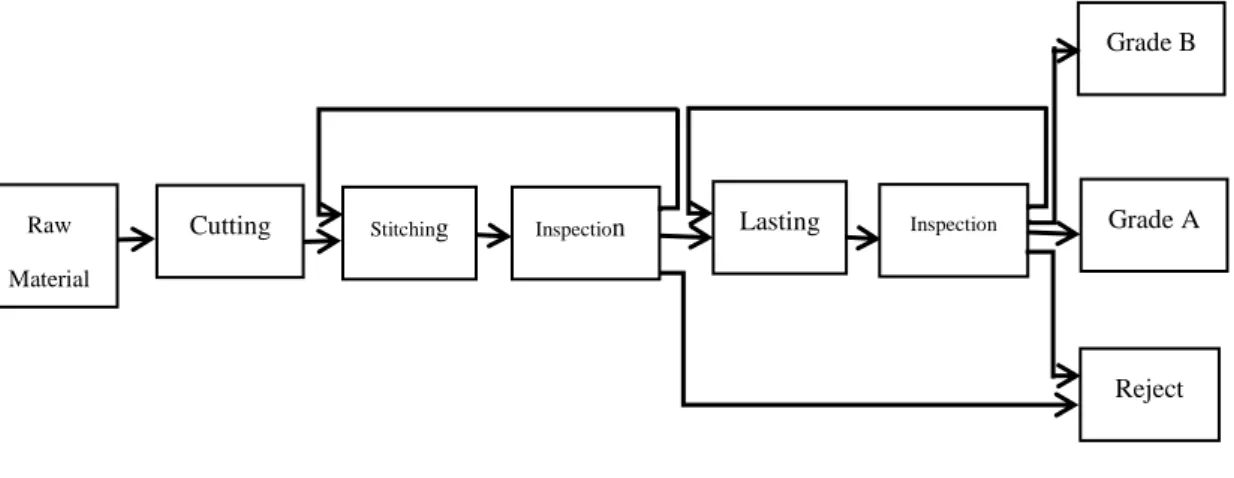
Figure 1 shows the flow and sequence of the shoe production process. The production process has mainly three sections. These are cutting, stitching and lasting sections. The first step in the shoe production process is cutting of the loaded raw materials into different components in cutting section, then the components sewn to be the upper part of the shoe in stitching section. The last step will be finalizing the shoe in lasting section. In the inspection sections the upper and the shoe will be given different grades according to the set standards and the rejected ones will be identified.
3. Analysis by using GERT 3.1 GERT model
The stochastic networks are composed of directed branches (arcs, edges, and transmittances) and logical nodes (vertices). A directed branch is associated with nodes at which it terminates. Two parameters are associated with a branch, which are, the probability that a branch is taken and the time required to accomplish the activity that the branch represents. A node in a stochastic network consists of an input (receiving and contributive) side and an output (emitting and distributive) side. The node types used in the network model graph for the shoe production process are several types of nodes types as shown in Table 1.
Table 1 Symbols of logical node Output
Input Deterministic Probabilistic
“And”
Inclusive”OR ” Exclusive”OR ”
Signal flow graphs (SFGs), sometimes referred to simply flow graphs, are graphic representation used for the modeling and analysis of linear systems. The SFG representation of Fig.2 shows the transmittance from state i to j is dependent on the products pijhij(z), where pijandhij(z) are the probability and the z-function of constant, respectively.
Fig.2 Basic element of SFG 3.2 Analysis of the shoe production process
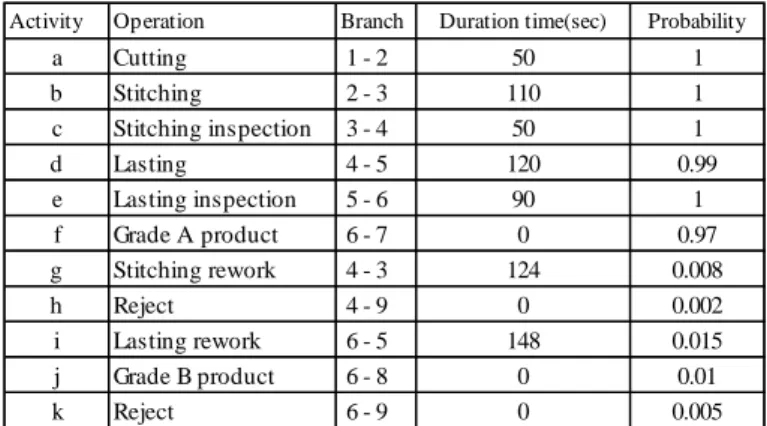
We analyze the GERT network model of the shoe production process shown in Fig.3. Table 2 describes explicitly the activity codes of each branch, the time required to accomplish the activity that represents the branch and the probability that a branch is taken. We got the data of Table 2 from a shoe factory found in Ethiopia. From Table 2, we obtain Table 3 and Table 4.
Raw Material
Cutting Stitching Inspection
Reject Lasting Inspection Grade A
Grade B
Fig.1 The material flow of shoe production process
3 Put the variable of node tox1~x1 1and
transmittance on the arcs to z-transformua(z)~uk(z). The variables ua(z)~uk(z) are represented as
k
a u
u ~ for simplification and the parentheses z in can be omitted. By using the rules of signal flow graph, the following equation of x2 is obtained.
1
2 u x
x a
(1) By the same way, the following equations for
8
3~x
x are obtained.
4 2
3 u x u x
x b g (2)
3
4 u x
x c (3)
6 4
5 u x ux
x d i (4)
5
6 u x
x e (5)
6
7 u x
x f (6)
6
8 u x
x j (7) By solving eqs.(1)~(7) forx7 ~x9, we obtain the following equations.
) 1 )(
1 (
1 7
i e g c
f e d c b a
u u u u
u u u u u u x x
, (Grade A products) (8)
Fig.3 GERT network model graph for the shoe production process
Table 2 Activity code and its description
Activity Operation Branch Duration time(sec) Probability
a Cutting 1 - 2 50 1
b Stitching 2 - 3 110 1
c Stitching inspection 3 - 4 50 1
d Lasting 4 - 5 120 0.99
e Lasting inspection 5 - 6 90 1
f Grade A product 6 - 7 0 0.97
g Stitching rework 4 - 3 124 0.008
h Reject 4 - 9 0 0.002
i Lasting rework 6 - 5 148 0.015
j Grade B product 6 - 8 0 0.01
k Reject 6 - 9 0 0.005
Table 3 Parameter values for each activity of Fig.3
) 0 , 005 . 0 ( , ) 0 , 010 . 0 (
) 148 , 015 . 0 ( , ) 0 , 002 . 0 ( ), 124 , 008 . 0 ( , ) 0 , 970 . 0 (
) 90 , 1 ( , ) 120 , 990 . 0 ( , ) 50 , 1 ( , ) 110 , 1 ( , ) 50 , 1 (
k j
i h
g f
e d
c b
a
Table 4 z-function (constant)
0 0
148 0
124 0
90 120 50
110 50
005 . 0 , 010 . 0
, 015 . 0 , 002 . 0 , 008 . 0 , 970 . 0
, , 990 . 0 , ,
,
z u
z u
z u
z u
z u
z u
z u z u
z u z u z u
k j
i h
g f
e d
c b
a
4 )
1 )(
1 (
1 8
i e g c
j e d c b a
u u u u
u u u u u u x x
,( Grade B products) (9)
) 1 )(
1 (
1 8
i e g c
j e d c b a
u u u u
u u u u u u x x
,( Rejects) (10) By substitutinguiof Table 2 into eqs.(8)~(10) and
11
x , we obtain the following equations of
9
7~x
x .
) 015 . 0 1 )(
008 . 0 1 (
9603 . 0
238 174
420
7 z z
x z
(11)
) 015 . 0 1 )(
008 . 0 1 (
0099 . 0
238 174
420
8 z z
x z
(12)
) 015 . 0 1 )(
008 . 0 1 (
) 00003 . 0 00495 . 0 002 . 0 (
238 174
238 210
210
9 z z
z z
x z
(13)
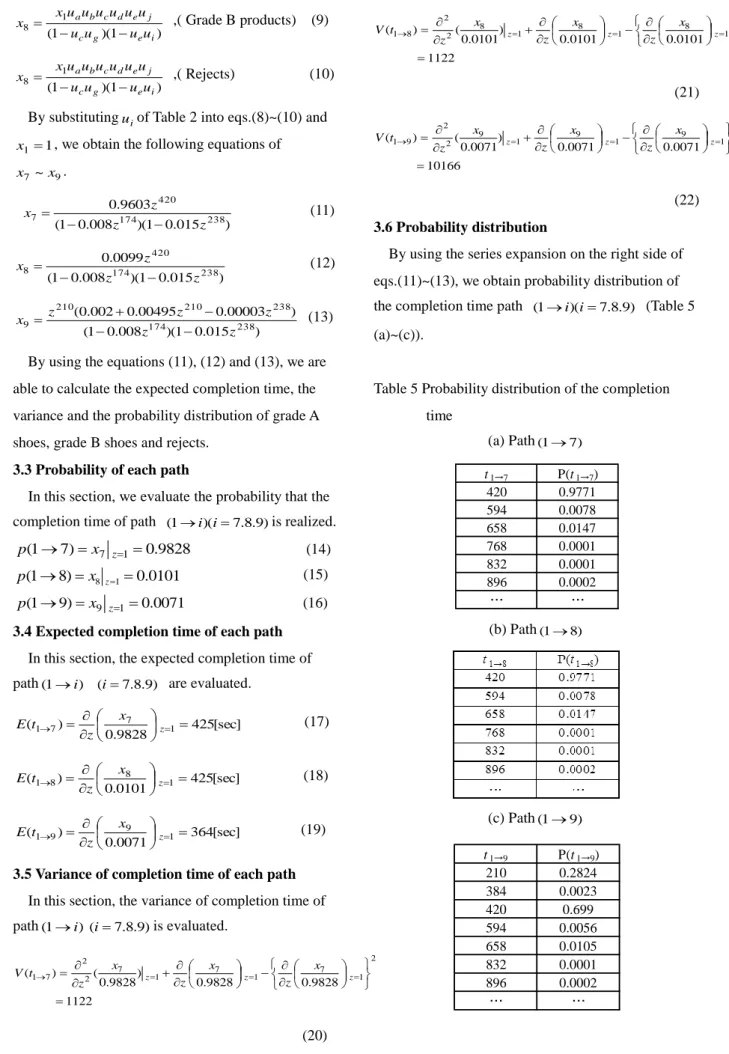
By using the equations (11), (12) and (13), we are able to calculate the expected completion time, the variance and the probability distribution of grade A shoes, grade B shoes and rejects.
3.3 Probability of each path
In this section, we evaluate the probability that the completion time of path (1i)(i7.8.9)is realized.
9828 . 0 )
7 1
( x7 z1
p (14) 0101
. 0 )
8 1
( x8 z1
p (15) 0071
. 0 )
9 1
( x9 z1
p (16) 3.4 Expected completion time of each path In this section, the expected completion time of path(1i) (i7.8.9) are evaluated.
[sec]
9828 425 . ) 0
(1 7 7 1
z
x t z
E (17)
[sec]
0101 425 . ) 0
(1 8 8 1
z
x t z
E (18)
[sec]
0071 364 . ) 0
(1 9 9 1
z
x t z
E (19)
3.5 Variance of completion time of each path In this section, the variance of completion time of path(1i)(i7.8.9)is evaluated.
1122
9828 . 0 9828
. ) 0
9828 . (0 ) (
2 1 7 1
7 1
7 2 2 7 1
z z z
x z x
z x
t z V
(20)
1122
0101 . 0 0101
. ) 0
0101 . (0 ) (
2 1 8 1
8 1
8 2 2 8 1
z z z
x z x
z x
t z V
(21)
10166
0071 . 0 0071
. ) 0
0071 . (0 ) (
2 1 9 1
9 1
9 2 2 9 1
z z z
x z x
z x
t z V
(22) 3.6 Probability distribution
By using the series expansion on the right side of eqs.(11)~(13), we obtain probability distribution of the completion time path (1i)(i7.8.9) (Table 5 (a)~(c)).
Table 5 Probability distribution of the completion time
(a) Path(17) t1→7 P(t1→7)
420 0.9771
594 0.0078
658 0.0147
768 0.0001
832 0.0001
896 0.0002
… …
(b) Path(18)
(c) Path(19) t1→9 P(t1→9)
210 0.2824
384 0.0023
420 0.699
594 0.0056
658 0.0105
832 0.0001
896 0.0002
… …
5 4. Conclusion
In this paper, we evaluated the probability of completion time of each path, the expected completion time, the variance and the probability distribution of grade A shoes, grade B shoes and rejects of the production process. In the inspection section there are list of check points to identify the grade of the shoe. These requirements are related with the nature of the raw material, the correct alignment of the shoe, the scratch occurred on the surface of the finished shoe and so on. The shoe which passes all the inspection requirements will be graded as grade A shoe and it will be exported to the international market. The shoe which fall only requirements related to upper surface is graded as grade B shoe and sold only in local market. The remains will be rejected one.
By utilizing the results, the improvement plan of the shoe production process will be proposed to enhance the material flow of shoe production process along with the Kaizen method. The result gained up to now is that the bottleneck processes are identified. The bottleneck processes are lasting and stitching operations. The future work is improving this bottleneck so as to improve the material flow of shoe production process and the productivity and quality of the overall shoe production process.
References
1) Pritsker A. A. B., Modeling and analysis using Q-GERT networks, Second edit., John Wiley & Sons, (1979)pp.18-51.
2) Elmaghraby, S.E., Activity Networks, John Wiley
& Sons (1977) pp.325-343.
3) Admad S. H., Aljiffry, M. S., Balillah M.A., Utilization of GERT in modeling higher education system, Engineering Science, Vol.3, (1991) pp.47-60.
4) Sridharan V. and Kalyani T. V., Cost analysis of a redundant system using GERT, Applied Science, Vol.6, (2004) pp.66-77.
5) Abdi, R., H. R.Ghasemzadeh1, S. A. Majid , S., A.
Dabbag, M. Nasab1, Modeling and analysis of mechanization projects of wheat production by GERT networks, Agricultural Sciences in China, 9(7), (2010) pp.1078-1083.
6) Wang Tao and Wu Linli, Research on G-GERT risk identification model of military logistics supply chain, Computer Engineering and Application, 48(1),(2012) pp.231-233.
7) Wang J. and Chen M., Remanufacturing process for used automotive electronic control components in China, Journal of Remanufacturing, 3, 9, (2013) pp.1-17.
8) Hashemin S.S. and Ghomi F., A hybrid method to find cumulative distribution function of completion time of GERT networks, Journal of Industrial Engineering International, Vol.1, No.1, (2005) pp.1-9.
9) Yu L. and Zuo M., An estimating method for IT project expected duration oriented to GERT, Research and Practical Issues of Enterprise Information Systems II, Vol.255, (2008) pp.1557-1566.
10) Yamashiro, M., Analysis of network models using GERT for several kinds of probability distributions, Journal of Japan Industrial Management Association, Vol.59, No.3(2008)pp.260-268 (in Japanese).
11) Yamashiro, M. and Zheng T., Completion time and cost distributions of the project using GERT network model, Transactions of the Japan Society of Mechanical Engineers, Series C, Vol.77,No.773(2011) pp.212-222 (in Japanese).
6
GERTを用いた靴製造工程における物の流れの解析
山城光雄
1, 佐々木正仁
1,Wodaje HELETWORK Bekele
21
創生工学科,システム情報分野
2
大学院修士課程,情報・生産工学専攻 概要
GERT(Graphical Evaluation and Review Technique)は確率を伴うある種類のネットワークを解