Master Thesis (2018)
Resource management of Manila clam in a clamming area in terms of harvest and satisfaction of clamming
participants
潮干狩り客の収穫と満足度からみるアサリの資源管理
(
英文)
Ayaka YAMAMOTO 17842409
Department of Tourism Science
Graduate Schools of Urban Environmental Sciences Tokyo Metropolitan University
Supervisor: Shinya Numata
Contents
Abstract
List of contents List of figures List of tables
Chapters
Chapter 1 – General introduction 1
Chapter 2 – Materials and methods 9
Chapter 3 – Harvest in the clamming area 23 Chapter 4 – Satisfaction in the clamming area 46
Chapter 5 – General Discussion 62
Chapter 6– Concluding remarks 66
Reference 68
Appendix 72
Acknowledgements 73
Abstract
Clamming is a type of nature-based leisure activities involving harvesting clams from tidal flats. Clamming activity has been seen since the 19th century in Japan. Recently, not a few clamming areas have been closed temporarily because of decline in the population of main harvest. To address the key challenge, clams are artificially spread in several clamming areas to supply a demand for participants. Spreading clams has become a main part of management of clamming but there was little information about economic and ecological effects of current clam spreading. In this thesis, I aimed to evaluate validity of current clam resource management (mainly spreading clams) from two perspectives: accepting harvest pressure and sustaining satisfaction level of clamming participants. I chose Funabashi Sanbanze seaside park as a study site where the manager spreads imported clams at their clamming area and monitors the weight of harvest of participants.
First, to evaluate the clam resource abundance in the clamming area, I collected data with four methods: interviewing to the manager, measuring the size of clams, conducting quadrat survey, and asking the amount of harvest of each clamming participant with their status data by questionnaire. The total amount of harvest in one clamming season in 2016 - 2018 were estimated to be 56 - 73 individuals m-2, that are higher than native clam population density in this study. This result indicates that native clam population is not capable of accepting harvesting pressure in the clamming area. In addition, the daily total amount of harvest was significantly and strongly correlated to the daily total number of participants. Moreover, I analyzed on factors affecting harvest amount of clamming participants through a multi regression analysis and the factors were estimated to be the number of group members, age of participants, type of the group, and time length spent in the area.
Second, to examine the relationship between harvest and satisfaction and loyalty of clamming participants, I conducted questionnaire survey to evaluate the amount of their harvest and quality of the clamming experience including three types of partial satisfaction and two types of loyalty to the area. The amount of harvest positively influenced satisfaction toward harvest significantly, and the satisfaction positively influenced two types of loyalty
significantly. However, the satisfaction toward enjoying the activity influenced loyalty stronger than the satisfaction toward harvest. Additionally, fee system may affect to the connection among harvest and satisfaction and loyalty. The factors that significantly affected loyalty of participants were motivation, residential area, time length spent in the clamming area, past experience of other leisure activity, and population density of participants in the area.
In conclusion, spreading clam is essential to maintain the clamming area in Funabashi Sanbanze seaside park, in terms of accepting current harvesting pressure and sustaining satisfaction and loyalty level. At present, the manager offers enough of clam resource for participants for each opening day. In addition, enjoyment of the activity may supplement the deficiency of harvest to sustain loyalty level under the fee system of Funabashi Sanbanze seaside park. Furthermore, the factors which affect harvest and satisfaction of each clamming participants were detected, which is novelty of this research as little was studied on the topic.
List of figures
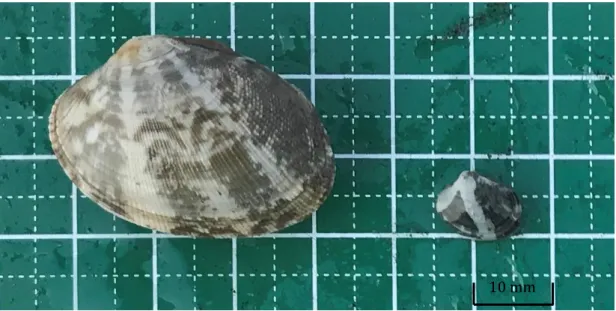
Figure 1-1 An adult Manila clam and a juvenile Manila clam.
Figure 1-2 Life cycle of Manila clam.
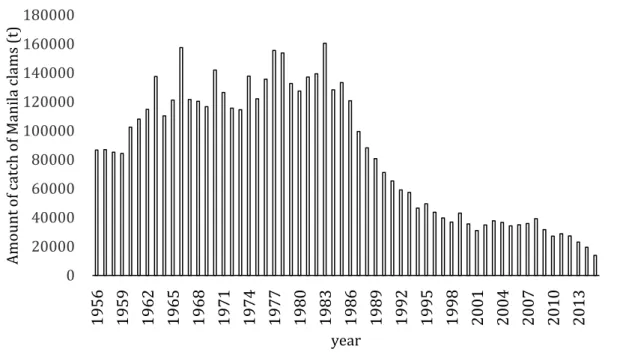
Figure 1-3 The transition of total catch of Manila clam by years in Japan.
Figure 1-4 A framework of this research.
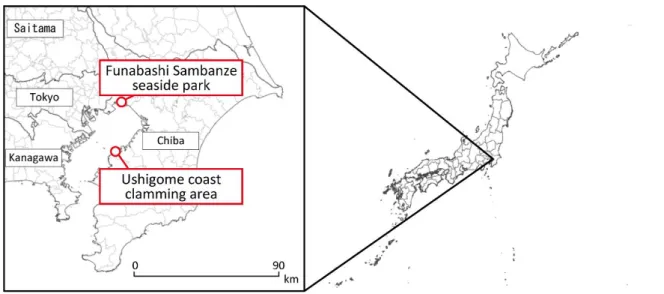
Figure 2-1 The map of Funabashi Sanbanze seaside park and Ushigome coast clamming area.
Figure 2-2 An aerial photograph of Funabashi Sanbanze seaside park and its clamming area.
Figure 2-3 An opening schedule of the clamming area of Funabashi Sanbanze seaside park in 2018.
Figure 2-4 The information board of opening clamming areas in Funabashi Sanbanze seaside park.
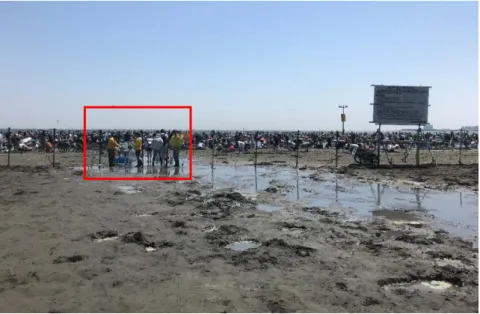
Figure 2-5 The view from outside of the clamming area at Funabashi Sanbanze seaside park.
Figure 2-6 Harvested clams washed and identified by a staff at the exit.
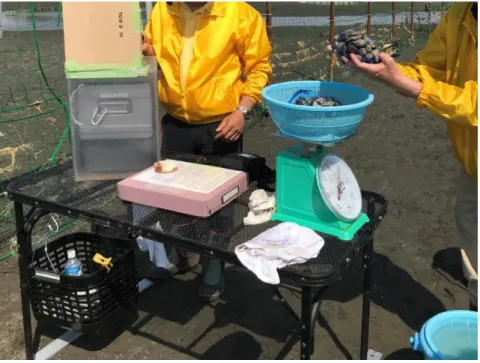
Figure 2-7 A park staff deciding the price of harvest fee based on weight of washed clams.
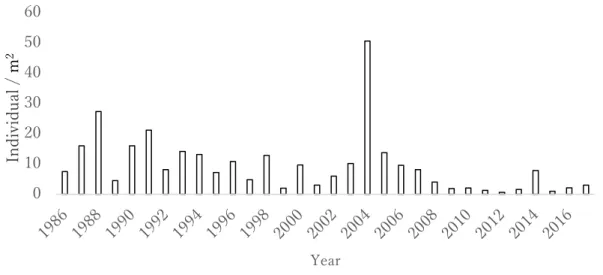
Figure 2-8 Density of adult clams (>30 mm) in Sanbanze area.
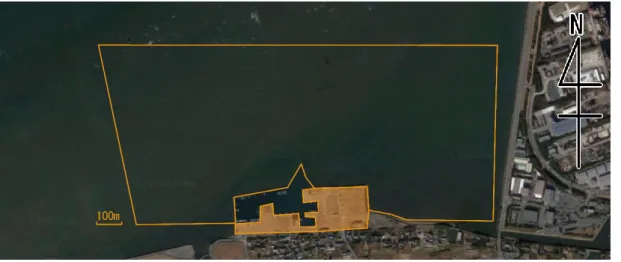
Figure 2-9 An aerial photograph of Ushigome coast clamming area.
Figure 2-10 View of Ushigome coast clamming area when it was open.
Figure 2-11 A map of points in the quadrat survey.
Figure 2-12 Tools for density measurement and size scaling.
Figure 3-1 Size and weight of harvested clams in the clamming area.
Figure 3-2 Frequency distribution of individual weight of harvested clams in the clamming area.
Figure 3-3 Total amount of spread clams and total amount of harvested clams in 2016, 2017 and 2018
Figure 3-4 Sea creatures washed away ashore.
Figure 3-5 Red sting rays came to the area were killed by management staff.
Figure 3-6 Estimated population density of adult clams inside of the clamming area based on the quadrat survey.
Figure 3-7 Estimated population density of juvnile clams inside of the clamming area based on the quadrat survey.
Figure 3-8 Relationship between number of participants a day and total amount of harvest in the day in 2016, 2017, 2018.
Figure 4-1 Initial model based on hypothesis.
Figure 4-2 The final model for clamming participants in Funabashi Sanbanze seaside park.
Figure 4-3 The final model for clamming participants in Ushigome coast clamming area.
Figure 4-4 The view of opening day in the clamming area of Funabashi Sanbanze seaside park in 2nd of May 2018 and 15th of May 2018.
List of tables
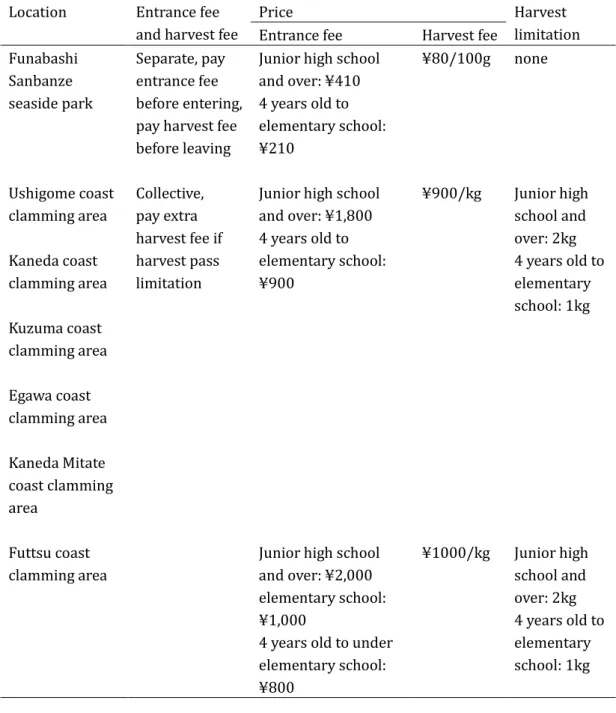
Table 2-1 Comparison of fees for the clamming in Chiba Prefecture.
Table 3-1 Spread and harvest pressure converted to population density.
Table 3-2 The number of adult clams found outside of the clamming area based on the quadrat survey.
Table 3-3 Result of correlation analysis and regression analysis.
Table 3-4 Correlation efficient between each variables.
Table 3-5 Multivariate regression models for harvest per group with factors of clamming participants as dependent variables.
Table 4-1 Summary of response related to harvest and satisfaction in two location.
Table 4-2 Correlation coefficient for responses in Funabashi Sanbanze seaside park.
Table 4-3 Correlation coefficient for responses in Ushigome coast clamming area.
Table 4-4 Results of goodness-of-fit tests for each model for Funabashi Sanbanze seaside park.
Table 4-5 Results of goodness-of-fit tests for each model for Ushigome coast clamming area.
Table 4-6 Multivariate regression models for loyalty with factors of clamming participants as dependent variables.
Appendix
A sheet used in questionnaire survey
1
Chapter 1 – General introduction
Clamming
Clamming is one of marine leisure activities from early spring to summer, the seasons when tide falls deeply enough to step in and dig beach sand. In Japan, clamming is familiar leisure activity since it has been enjoyed as a leisure activity for long, at least 150 years, as picture of clamming was drawn in 1852 by Hiroshige Utagawa (National Diet Library, Japan, 2016). Even at present, clamming dealt as a classic leisure activity in spring in Japan, as several tourism information websites build up a special topic page for introducing clamming areas in Japan every year (Rurubu, https://www.rurubu.com/season/ spring/shio/; Ikoyo, https://iko-yo.net/topics/shellfish). In addition, there is a survey that questioned 6,661 people in Japan whether they have gone to clamming and resulted in around 60% of respondents have (SOFTBRAIN FIELD Co.,Ltd., 2016), which shows the familiarity of the activity among Japanese people.
Clamming activities are done in tidal areas in general, but there are several tidal areas managed specifically for recreational clamming activities. The managers are fishery cooperatives and city government who own the area, and the management includes artificial clam spreading, harvest limitation in weight and range. Those managers operate clamming area as a business, with charging clamming participants fee for entering the area and harvesting clams. Although clamming business is found all over Japan, very little experimental work has been done on the management of clamming areas.
Manila clam
In clamming activities, several species of clams are harvested, but one of the most common harvest is Manila clam (Veneridae; Ruditapes philippinarum) (Japanese name: Asari) (figure 1-1).
It distributes in coast around Japan, Korea, China, south of Kuril Islands, Primorskii, and Sakhalin (Habe et al., 1965). The habitats of Manila clam are a tidal area or a shoal which found in enclosed bay and estuary (Ito, 2002).
2
The life cycle of Manila clam is described in figure 1-2. In Japan, Manila clam spawns its eggs into sea water in spring and summer and south of Touhoku region, and reproduce only in summer in Tohoku region (Fisheries Agency, 2013). After fertilization, egg grows to Trochophore larvae in 12 hours. In another 24 hours, it becomes a Veliger larvae phase that start foraging. From a fertilized egg to veliger larvae, Manila clam floats in the seawater and floating larvae stage is approximately two to three weeks. When Veliger grows by 200 - 230 µm, it transforms and becomes a Juvenile clam. From this stage, clams set on the bottom of the sea. Growth rate from juvenile to primary adult (15 - 25 mm), and adult clam (25 mm and over) depends on location. In Tokyo Bay, it takes two years to become 24 - 40 mm, whereas in Ariake sea, it takes a year to be 25 mm, two years to be 36 mm, and three years to be 40 mm. A life span of Manila clam is considered to be eight to nine years (The Japanese Institute of Fisheries Infrastructure and Communities, 1997).
Figure 1-1 An adult Manila clam (left) and a juvenile Manila clam (right). The photograph was taken in Funabashi Sanbanze seaside park in April 2018.
10 mm
3 Figure1-2 Life cycle of Manila clam.
Declining population of Manila clams
Currently in Japan, not a few clamming areas have been closed temporarily. The reasons of closure vary among the clamming area. One of the main reasons is decreasing population and poor growth of clams (Koromozaki clamming area, Aichi, 2017-2018; Kitsuki, Oita, 2017- 2018; Hamanako, Shizuoka, 2016-2017). In the field of commercial clam fishing, there are also facing the issue of decreasing resource. In 2015, total catch of clam in all commercial fishing in Japan was 13,810 t, which was less than 10% of total catch in 1983, the peak of the catch (Ministry of Agriculture, Forestry and Fishery, Japan, 2018) (figure 1-3). In response to this, many researchers are dedicated to disclose the reason of decline to prevent the population loss. According to Toba (2017), the major factors of decrease are over-harvesting and land reclamation. Moreover, hypoxia, river flood, parasites and predators, high winter mortality by wave corrosion have also contributed to the decrease of clams (Toba, 2017).
Although several reasons have been discussed for solutions, effective solutions against the decline have not discovered and Japanese clam production is declining continuously (Toba, 2017).
4
Figure 1-3 The transition of total catch of Manila clam by years in Japan. This graph is based on statistics data of successive years total catch in sea fishery, Ministry of Agriculture, Forestry and Fishery, Japan, 2018.
Revenue for managers by opening clamming area
Due to the decline of a haul of clams, fishery cooperatives gain less revenue than before.
The total revenues of clam production started to drop after 1960, and it was 3,749 million yen in 2016, which was only 12.5% of 1960. Following this, there are fishery cooperatives which rely on the revenue from operating clamming area as a leisure attraction, even though the operation of clamming area is a side business to the last. In a case of Kisarazu fishery cooperative, revenues of operating clamming were 80.0% of all in 2012, 72.4% in 2013, and 87.7% in 2014. Ushigome fishery cooperative has similar revenue source, as revenues of operating clamming is 56% of all in 2012, 100% in 2013, and 73% in 2014 (Norin Chukin Research Institute, 2017).
Artificial clam spreading in clamming areas
Managers of some clamming areas deem that natural population of clam does not satisfy 0
20000 40000 60000 80000 100000 120000 140000 160000 180000
1956 1959 1962 1965 1968 1971 1974 1977 1980 1983 1986 1989 1992 1995 1998 2001 2004 2007 2010 2013
Amount of catch of Manila clams (t)
year
5
the clamming demand they want to accept. Therefore, they artificially spread imported clams to the area (e.g. Funabashi Sanbanze seaside park (On their flyer), Ushigome coast clamming area (Norinchukin Research Institute, 2017), and Kisarazu coast clamming area (Norinchukin Research Institute, 2017)). Artificial clam spreading instantly raise population density of clam in the area. There are some risks of spreading clams in a clamming area.
Firstly, it will cost more to continue spreading same amount of clams in future since the price of imported clams has been increasing, as ¥136 for 1 kg in 2000 raised to ¥212 for 1 kg in 2015 (Trade statistics of Japan, 2016). Additionally, invasive species can be introduced through spreading clams. In case of the clamming area of Tonahama, Miyagi prefecture, an invasive species Euspira fortune was introduced to a recreational clamming area through spreading clams, which results in closure of the area (Okoshi, 2004). A question arises that if clamming has become a leisure activity which cannot be operated without artificial resource input even though the activity has been depending on natural resources over 150 years.
How does clam harvest influence quality of leisure experience in the clamming? (Literature review)
Since clamming is a leisure activity which is based on nature resource, it is important to understand the transition of amount of clams in the area. Additionally, clamming has an aspect of leisure activity, which is different from commercial fishing, so that satisfaction and loyalty of participants is emphasized. As in management of other leisure activities which rely on nature resource such as sports hunting and recreational fishing. Furthermore, personal status of clamming participants is essential information for making action plan for managing harvest and satisfaction in personal level.
Overall, the number of studies related to clamming is very limited. In terms of harvest and resource management, Ichimi et al. (2011) estimated the size of harvest pressure by clamming pressure at a clamming area in tidal areas in Kagawa prefectures (study site). The individual harvest was questioned in hearing survey to the clamming participants, and the harvest pressure was estimated by and multiplying the number of visitors. Although they estimated harvest pressure for one clamming season, they did not discuss factors of participants that affect amount of harvest and satisfaction. Moreover, it was a case of a
6
clamming area with no artificial spread clams whereas I focus on a clamming area with artificial clam spreading in this thesis. On the other hand, Tamaki (2004) estimated recreational value of clamming by travel cost method, and he concluded that the value was as high as the profit of commercial clam fishing by a fishery association who managed the clamming area. He also showed that the data of the amount and cost of spread clam seeds in one clamming season by managers in the clamming areas in Aichi prefecture. However, it was not clear how these spread clams affect harvest of clamming participants, and how managers manage the area including spreading clams. Damery et al. (2004) also estimated the economic value of recreational clamming in Cape Cod, Massachusetts, USA, and interestingly the situation in clamming areas in USA and Japan were quite different. In Massachusetts, people who want to do clamming need to buy a permit to get in any tidal flats and dig clams with no limitation whereas Japanese people buy a ticket for one clamming opportunity and one location. Main harvests were also different between USA and Japan. Research of clamming participants and their satisfaction in managed areas in Japan has not been touched even it was crucial topic for management.
On the other hand, there is no research investigating satisfaction and loyalty of clamming participants. However, there are several studies on harvest and satisfaction of participants in a field of sports hunting and outdoor leisure activity including personal status of them. In terms of contribution of harvest to satisfaction, there are two types of conclusion:
the first is that the amount of harvest affect satisfaction of hunters (Siemer et al., 2015; Frey et al., 2003), and the second is that the amount of harvest is not so important for satisfaction of hunters (Hammit et al., 1989; Glass et al.,1992; Holland et al., 1992). Satisfaction and loyalty of clamming participants may be affected by harvest as research of Siemer (2015) and Frey (2003). However it is unknown that how much is harvest important for clamming participants, since harvest in clamming activity can be eaten, whereas harvest in sports hunting does not have to be for eating. As for personal status of participants of leisure activity, there are three major factors which mainly examined; past experience and specialization (Schreyer et al., 1984; Bryan, 1977; Choi et al., 1994), motivation and expectation (Kyle et al., 2006; Brunk et al., 2007; Fedlar et al., 1994), and social demographics (Bowker et al., 2006;
Bowker et al., 2007; Kelly, 1980). Although these factors characterized participants, little is
7
known about characteristics of clamming participants. To make resource management for the clamming area economically sustainable, it is necessary to evaluate harvest and satisfaction of clamming participants.
Objectives and research flow
This thesis is to discuss the validity of current clam resource management at a clamming area including spreading clams toward harvest and satisfaction of clamming participants. The framework is shown in figure 1-4.
In Chapter 2, materials and methods of the thesis is described. I selected two clamming areas with clam spreading as resource management and introduce methods to collect data used in further analysis. Basically, I collected five types of data: information of management process, statistical data of resource input and output, population density of clams in the clamming area, size and weight of adult clams in the clamming area, and questionnaire response includes harvest and satisfaction with participants status. All five data were used in Chapter 3, and questionnaire data was used for Chapter 4.
In Chapter 3, I focus on amount of harvested clam by clamming participants. I examined the resource abundance in three scale: For whole clamming season, for each opening day, and for each participant. I also estimated the factor which affects their harvest.
In Chapter 4, I focus on satisfaction and loyalty level of clamming participants. Here, I hypothesized amount of harvest connected to satisfaction, and satisfaction level of contacting nature and enjoyments boost up the loyalty to the area. On the other hand price system may affect how much harvest affects satisfaction and loyalty. Also, I hypothesized motivation and past experience of clamming and social status influences loyalty level. Thus, I first estimated the connection between each satisfaction level and loyalty to the area. Consequently, I evaluate the relationship between factors of participants and two types of loyalty.
In Chapter 5, I discuss validity of current clam resource management (mainly spreading clams) in terms of resource management and sustaining satisfaction level. I also suggest management plan to both the area with spread clams and the area with no spread clams.
8
Definition of words and phrases used in this thesis
Clamming participants: People who do clamming as a leisure activity. I differentiate clamming participants from clam fishers since the former has purpose of leisure, and latter has a commercial purpose.
Manager: People or organizations who manage the clamming area.
Opening day: A day manager opens the clamming area for clamming participants
Clamming season: A period between the first opening day and the last opening day in the year. The total number of opening days is less than the total days in clamming season, since there are days when people can not go in the flats because tide doesn’t fall enough.
Clam: Manila clam (unless other types of clams are in discussion).
9 Figure 1-4 A framework of this research.
10
Chapter 2 – Materials and methods
Study site
Funabashi Sanbanze seaside park
Funabashi Sanbanze seaside park is a clamming area located in Funabashi city, Chiba prefecture (figure 2-1). This park belongs to Funabashi city, and is managed by Funabashi city park association, which is a Public Interest Incorporated Foundation. The clamming area in this park is 634m x 210m (134,000 m2) size square, divided into four areas (figure 2-2).
The area is surrounded by multiple polls and nets. During clamming season, visitors can only enter through entrance when it’s in opening hour, but it is locked when it is not an opening day. After clamming season, manager release its entrance gate and people can go into the area freely. As for sea waters and sea animals, they are able to go in and out of the area anytime since mesh of the net is wide enough. For each opening day, the manager decides which range to open. The number of opened ranges depends on the day, from one area to four areas. In the area, manager artificially spread clams, which is announced to public (figure 2-4).
In 2018, the clamming area was open for clamming participants for 36 days from 14th April to 17th June, and it opened for three hours per day when tide fell (except 1st of May, opened for two hours) (figure 2-3). Manager asked participants to pay entrance fee and harvest fee separately, which is a minor fee system for clamming area in Chiba prefecture (table 2-1). An adult (junior high school students and older) and child (younger than junior high school students) entrance fees were ¥410 and ¥210, respectively. Participants show the ticket at the entrance (figure 2-5) to enter the area. After clamming, all participants needed to pay harvest fee, which is ¥80 per 100 g. At the exit, park staffs scaled the weight of clams to decide the price of harvest fee. Participants were advised to harvest only Manila clams, and all the other clams were taken out by staffs’ hand when harvest were scaled (figure 2-6). After removing other clam species, harvested Manila clams were washed to remove sand and mud, and scaled by increments of 100g. In the end, participants pay harvest fee based on harvest (figure 2-7).
11
The park is located in the area called Sanbanze. Sanbanze is an 1,800 ha area that include tidal flat and shallow sea extended over Urayasu city, Ichikawa city, Funabashi city, and Narashino city (Chiba prefecture website). The area is a habitat for multiple plants and sea organisms and birds yet the area has been reclaimed from 1960s along high economic growth (Urayasu shizen marugoto tankentai, 2014). The clamming area of Funabashi Sanbanze seaside park is also a part of tidal flat which was made by reclamation.
For the background, population density of Manila clams in Sanbanze area tends to decrease along the year (Okamoto, 2015; Toba, 2002). Chiba Prefectural Fisheries Research Center counted the number of adult clams (> 30mm) in 36 points in Sanbanze area, and average population density was 3.02 m-2 in 2017, which is less than a half of the density in 2007 (figure 2-8). There are waves of population density, but it has been certainly lower than 10 years ago since density remains less than 10 individuals m-2. I should note that those are populations in fishery area but clamming area so that different levels of harvesting pressure has been exerted to those.
Ushigome coast clamming area
Ushigome coast clamming area is located in Kisarazu city, Chiba Prefecture. This area is managed by Ushigome fishery cooperative. In the area, manager artificially spread clams, which is announced to public. The clamming area is 843,000 m2 (figure 2- 9, 2-10)
In 2018, the clamming area was open for clamming participants for 75 days, from 18th March to 17th July. The area was open for 3 - 4 hours per day, when tide fell. Manager ask participants to pay fee before they enter the area. An adult participant needed to pay ¥1,800 to enter and to harvest with the maximum limit of 2 kg. A child participant needed to pay
¥900 to enter and harvest within 1 kg. At the exit, staffs monitor with their eyes how much participants harvested and estimate the weight. When the harvest looked more than 2 kg (1 kg for children), staff members asked participants to scale the weight of it. If harvest was actually more than the limitation, participants needed to pay extra harvest fee (table2-1).
In this thesis, Ushigome coast clamming area and participants in the area are only used for comparison for investigating connection between harvest and satisfaction of
participants as it has different price system with Funabashi Sanbanze seaside park.
12
Table 2-1 Comparison of fees for the clamming in Chiba Prefecture.
Location Entrance fee and harvest fee
Price Harvest
limitation Entrance fee Harvest fee
Funabashi Sanbanze seaside park
Separate, pay entrance fee before entering, pay harvest fee before leaving
Junior high school and over: ¥410 4 years old to elementary school:
¥210
¥80/100g none
Ushigome coast clamming area
Collective, pay extra harvest fee if harvest pass limitation
Junior high school and over: ¥1,800 4 years old to elementary school:
¥900
¥900/kg Junior high school and over: 2kg 4 years old to elementary school: 1kg Kaneda coast
clamming area
Kuzuma coast clamming area
Egawa coast clamming area
Kaneda Mitate coast clamming area
Futtsu coast clamming area
Junior high school and over: ¥2,000 elementary school:
¥1,000
4 years old to under elementary school:
¥800
¥1000/kg Junior high school and over: 2kg 4 years old to elementary school: 1kg
13
Figure 2-1 The map of Funabashi Sanbanze seaside park and Ushigome coast clamming area. The map is retrieved from Geospatial Information Authority of Japan.
Figure 2-2 An aerial photograph of Funabashi Sanbanze seaside park and its clamming area. An area covered in orange is park area which includes an open green space, a baseball field, a tennis coat, a ticket counter, restaurants, a barbeque space, and an education center.
The square areas with orange lines are clamming area of the park. The park is in an industrial area and surrounded by factories. The photograph was retrieved from Google map in 18th December 2018.
14
Figure 2-3 An opening schedule of the clamming area of Funabashi Sanbanze seaside park in 2018. Yellow bars show opening time of the day.
Clamming season started 14th of April and ended 17th of June.
15
Figure 2-4 The information board of opening clamming areas in Funabashi Sanbanze seaside park. For this day, clamming participants were able to go and do clamming only in area number 3 from 12:30 to 15:30. The photograph was taken in April 2018.
Figure 2-5 The view from outside of the clamming area at Funabashi Sanbanze seaside park. Clamming participants needed to buy a ticket beforehand and enter through the entrance (in the red square). The photograph was taken in May 2018.
16
Figure 2-6 Harvested clams washed and identified by a staff at the exit. The photograph was taken at Funabashi Sanbanze seaside park in April 2018.
Figure 2-7 A park staff deciding the price of harvest fee based on weight of washed clams.
The photograph was taken at Funabashi Sanbanze seaside park in April 2018.
17
Figure 2-8 Density of adult clams (>30 mm) in Sanbanze area. This graph is based on the data of population density investigation of Manila clam offered by Chiba Prefectural Fisheries Research Center, Tokyo Bay Fisheries Laboratory.
0 10 20 30 40 50 60
Individual/㎡
Year
Individual/m2
18
Figure 2-9 An aerial photograph of Ushigome coast clamming area. An area covered in orange is a parking area. An area with orange lines is clamming area. The photograph was retrieved from Google map in 27th December 2018. The border of the area was drawn based on a report of Norin Chukin Research Institute (2017).
Figure 2-10 View of Ushigome coast clamming area when it was open. Participants from the right side to the center were lining to exit. The photograph was taken 29th of April, 2017.
19
Data collection
Resource management in the clamming area
Interview to Funabashi city park association was held to ask how they manage the clam resource at the clamming area including spreading clams. The interview was on 29th of November 2017 and 5th of April 2018. Additionally, I contacted managers via Email to confirm the details of information and data offered.
Clam spreading and daily harvest records (secondary data)
Statistical data of clamming in 2016, 2017 and 2018 includes the date of clam spreading and harvesting, a total weight (kg) of spread clams for each day, a total weight (kg) of harvested clams for each day, a number of participants for each day was offered by the manager of Funabashi Sanbanze seaside park.
Population density of clams in the clamming area
Ten points inside of the clamming area and 5 points outside of the area were set to be investigated (figure 2-11). Each point was dug 20 cm x 20cm square with 20 cm depth, and filtered with a 1 mm mesh sieve (Nature conservation department of Chiba prefecture, 2018) (photographs of tools are in figure 2-12). When it was an opening day, this quadrat survey was done before opening time. All clams were counted and measured its body length. The investigation was conducted 1to 12 times for each point from 29th March to 17th June. All the number of individuals were multiplied by 25 to estimate population density of clams (m-2).
20
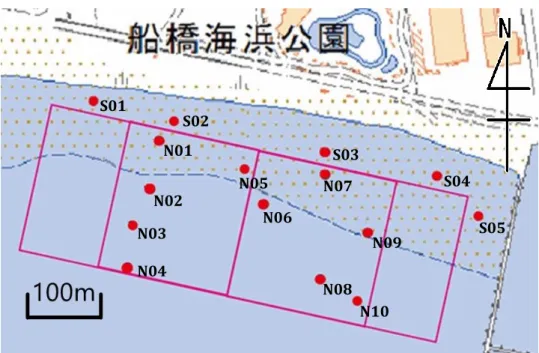
Figure 2-11 A map of points in the quadrat survey. The pink line is the boarder of clamming area, and inside the pink line is the clamming area. 10 points were set inside the clamming area (N01 - N10), and 5 points were set outside of the area (S01 - S05). The map is retrieved from Geospatial Information Authority of Japan.
N01
N02 N03 N04
N05 N06
N07
N08 N09
N10
S01 S02
S03
S04
S05
21
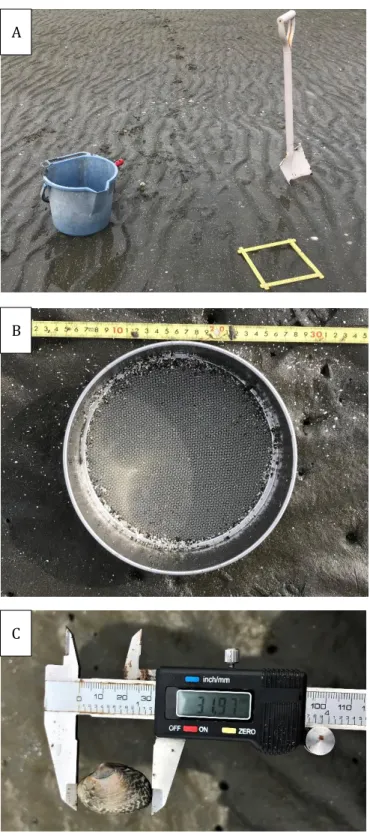
Figure 2-12 Tools for density measurement and size scaling in the present study. After set quadrat with a folding scale, beach sand was dug up and put in a bucket (A), and filtered with 1mm mesh sieve (B). All found clams were scaled their body length with a digital caliper(C).
A
B
C
22
Size and weight of adult clams in the clamming area
In order to estimate population density data, weight and body length of harvested clams in Funabashi Sanbanze seaside park were scaled. Five clamming participants were selected and asked to weigh and measure their harvested clams individually. Clams were collected in 29th and 30th of May 2018 and 16th of June. The individual weight data was used to convert the total weight of clams into population density in the clamming area.
Harvest, satisfaction, status of each participant
Clamming participants who have already finished clamming were requested to answer the questionnaire around the exit of the clamming area. The survey was conducted in two locations, Funabashi Sanbanze seaside park and Ushigome coast clamming area. The survey was conducted for 13 days from 15th May to 17th June 2018 (15th, 16th , 20th , 27th, 29th, 30th of May, 2nd, 3rd, 12th, 13th, 14th, 16th, 17th of June) at Funabashi Sanbanze seaside park, and for 2 days (1st and 14th July) at Ushigome coast clamming area.
The questionnaire is including nine major items and five items for social demographics (the questionnaire sheet in Appendix). The major question items were: Q1 experience of clamming (“Have you ever done clamming? If you have, how many times have you done?”
answers: none, once, 2 – 5 times, 6 – 10 times, 11 or more) (Schreyer et al., 1984), Q2 the closest time when the respondent do clamming (“When is the last time you did clamming?”
answers: less than a week, less than a month, less than three months, last year, 2 and more years ago), Q3 belongings (“Please choose everything you brought today” answers: bucket, chair, clamming fork (own and/or rent), net (own and/or rent)) (Bryan, 1977), Q4 level of importance for each purpose (“How important are these contents for you when you do clamming?” contents: harvest a lot, contacting to nature, enjoy the activity, answers: not important at all, not so important, important, very important) (Kyle et al., 2006), Q5 the time when the respondent enter the clamming spot (“What time did you enter here?”), Q6 the weight of harvested clams (“how much (kg) did you harvest today?”), Q7 expectation for harvest (“Did you have any goals or expectation of harvesting specific amount of clams?”) (Tokuhara, 2011), Q8 three types of satisfaction and two types of loyalty (“Please choose where your feel most likely.”, contents: I’ve harvested sufficient amount of clams, I’ve
23
contacted nature enough, I enjoyed clamming as a leisure activity, I would like to come this clamming spot again, I would like to recommend this clamming spot to my family and acquaintance, answers: strongly disagree, disagree, agree, strongly agree) (Gokita et al., 2015), Q9 experience of other leisure activity (“Have you ever done these nature-based activities? If you have, how many times do you have?”, contents: swimming in the sea, fishing, catching insects, harvesting mushrooms or forest vegetables, picking vegetables or fruits, answers: none, once, 2 – 5 times, 6 – 10 times, 11 or more). The personal items included sex, age classes (e.g. 20s, 30s), people who are with the respondent(relationship type and number), residence(prefecture) and transport(type and time) (Bowker et al., 2006).
Satisfaction toward contacting to nature, a content of question 8, was added after 42 participants.
Investigators read out all questions to respondents to avoid invalid answer due to misunderstanding. Investigators also wrote down all response from respondents because many of their hands were wet and full of their belongings including clams so they were unable to write on paper.
24
Chapter 3 – Harvest in the clamming area
Introduction
Managers of some clamming area spread imported clam artificially to satisfy the clamming demand. Clam spreading is a common counterplan for clamming areas around Tokyo Bay to face diminishing population of clam (Funabashi Sanbanze seaside park (On their flyer), Ushigome coast clamming area (Norinchukin Research Institute, 2017), Kisarazu coast clamming area (Norinchukin Research Institute, 2017)). Clams are spread in accordance with their estimation of number of participants empirically and uniformly.
However, the actual amount of clam resource and its transition is little known. There is no information of the amount of clams that spread and harvested at the clamming area in any scale (for one clamming season, for one opening day and for each participant). Three questions are addressed.
(1) Is it necessary to spread clams? Is it impossible to accept all the harvesting pressure (needs) with native population?
(2) Is the current clam spreads enough for the harvesting pressure (needs) in each opening day?
(3) Which factors affect individual harvest?
To face these questions, I examined the amount of harvest for a whole clamming season, for each day and for each participant scale. Simultaneously, I probed the amount of spread clams and population density of clams in the clamming area. The goal is to judge if current clam spreading is appropriate in terms of resource abundance.
Method
Study site
All surveys were held in Funabashi Sanbanze seaside park. Detailed description of the study site is presented in Chapter 2.
25 Data collection
Five types of data (information of resource management in the clamming area, statistical data of resource input and output, population density of clams in the clamming area, size and weight of adult clams in the clamming area, and questionnaire response includes harvest with participants status) were accumulated in Funabashi Sanbanze seaside park. Detailed description of method is presented in chapter 2.
Clam resource abundance
To see the resource abundance for a day, I calculated correlation coefficient of the number of participants in a day and the total weight of harvest for a day in 2016, 2017 and 2018.
Pearson correlation test was performed to see if the coefficient was significant. After checking their correlation, regression model was constructed which the independent valuable was total weight of harvest, and the dependent variable is number of clamming participants.
Factors that influence the amount of harvest
Multi regression analysis was performed to examine the factors affecting the amount of harvest. The amount of harvest for each participant was used as a dependent variable and the factors includes clamming experience, belongings, purpose, expectation toward harvest, other leisure experience, sex, age, number of participants classified with their age, number of participants in group in total, means of transportation, time length for transport, type of group, residence, time length spent in the clamming area, and participant population density were set as independent variables.
To include in the model, I use dummy variables to following factors; number of clamming opportunity (1-5 scales), closeness of last opportunity (1-6 scales), importance level of harvest , contacting nature, enjoying the activity (1-4 scales), number of other leisure activity (1-5 scales), and sex (1-2 scales). To make model precise, I excluded dependent variables which has strong correlation (<-0.7, >0.7) with other variables. Group type and residence were included to the model after checking correlation coefficient.
26
Results
Size and weight of Manila clam in the clamming area
The number of measured clams was 565. Figure 3-1 shows size and weight of each clam.
The average size of harvested clams in the clamming area was 32.1 mm (standard deviation
= 2.93). The smallest clam was 16.7, which is a primary adult (not a juvenile). The average weight of clams was 7.2 g (standard deviation = 1.87), and median was 7.1 g. As showed in figure 3-2, the most frequent weight was from 7.0 to 7.5 which shows the median can be used for representative value of clam weight in the clamming area. Therefore, I use 7.1 g as a representative weight of adult clam in the clamming area.
27
Figure 3-1 Size and weight of harvested clams in the clamming area.
Figure 3-2 Frequency distribution of individual weight of harvested clams in the clamming area.
Histogram of W
W
Frequency
2.0 3.5 5.0 6.5 8.0 9.5 11.0 12.5 14.0 15.5 17.0
020406080Number of individuals
Weight (g)
Weight (g)
Size (mm)
0 10 20 30 40
051015
28 Seasonal pattern of clam spread and harvest
Figure 3-3 shows the weight of spread clams of clam resource, and the weight of daily harvested clams in 2016, 2017 and 2018. The bars over 0 means amount of spread (input) and the bars below 0 means harvest (output) which only occur opening day. Gray bars in input section means spread of Meretrix clam (Japanese name: Hamaguri), which was not spread in 2018. All clams were spread at night of each spreading day.
In 2016, clamming season starts on 20th of April, and ended on 11th of June. Clams were spread once on 12th of April, which was before clamming season, and spread 11 times during clamming season. From 4,100 kg to 20,000 kg of Manila clams were spread in a day, and 10,000kg of Meretrix were spread in 2 consecutive days. 127,000 kg of clams (Meretrix included) were spread in total. On the other hand, number of opening days was 38, and the amount of harvested clams was 69,859 kg in total, which was 55% of weight of spread clams.
The minimum total harvest was 11 kg in 28th of April, and the maximum total harvest was 10,984 kg in 5th of May.
In 2017, clamming season starts on 9th of April, and ended on 11th of June. Clams were spread twice on 3rd and 4th of April, which was before clamming season, and spread 9 times during clamming season. From 9,970 kg to 10,000 kg of Manila clams were spread in a day, and 5,000kg of Meretrix were spread in 4th of April and 12th of May. 119,970 kg of clams (Meretrix included) were spread in total. On the other hand, number of opening days was 42, and the amount of harvested clams was 53,491 kg in total, which was less than half amount of weight of spread clams. The minimum total harvest was 11 kg in 11th of April, and the maximum total harvest was 6,618 kg in 30th of April.
In 2018, clamming season starts on 14th of April, and ended on 17th of June. Clams were spread twice on 3rd and 4th of April, which was before clamming season, and spread 14 times during clamming season. From 3,000 kg to 10,000 kg of clams were spread in a day, 146,050 kg of clams were spread in total. On the other hand, number of opening days was 36, and the amount of harvested clams was 62,794 kg in total, which is less than half amount of weight of spread clams. The minimum total harvest was 18 kg in 18th of April, and the maximum total harvest was 7,370 kg in 13th of May.
There is a trend seen every year. The amount of harvest was higher in weekends (in the
29
red squares) than weekdays, as more participants come to the area. According to the manager, spreading was more frequent during the Golden week than other dates. That was because managers think that clam supply can not catch up with harvesting pressure during this period.
For the other date than Golden week, they tried to spread several days before weekend to let clams go under the sand. Nonetheless, they spread clams every daily during Golden week because of large needs of harvest so that clams would be on the sand. This year particularly, the period of spring tide and Golden week was coincided, manager opened the area through whole Golden week and clams were spread almost every day.
On the other hand, an unusual event for 2018 started on 12th of June. Blue tide came to the area and many sea animals and their dead body were washed ashore (figure 3-4). As a result, a number of red stingrays, predators of clams, were also came to the area (figure 3-5).
The stingrays also affected clamming participants and their activity since it has a poison spike on their tail so that manager decided to limit the opening area to protect participants from the stingrays. Simultaneously, staff members worked on killing red stingrays to prevent it causing damage to participants. The dead bodies were removed by other staff members. The impact of blue tide gradually diminished, as a number of stingrays and washed animals decrease in visual aspect.
The total weight of spread clams and harvested clams and maximum weight of harvest in a day and population density converted from weight are presented in table 3-1. Attention is needed because those numbers in 2016 and 2017 were not precise because Meretrix was included. Therefore, this estimation is based on assumption that all clams recorded were Manila clam. Actual number of harvested clams (both Manila clams and Meretrix) should be smaller since an adult Meretrix is heavier than an adult Manila clam: a 30 mm Meretrix weighs around 9 g, and a 40 mm Meretrix weighs 17 g (Kumamoto prefectural Fisheries Research Center, 2013). As total amount of spread clams, 2018 was the highest of last three years. On the other hand, total amount of harvested clams was highest in 2016. Additionally, maximum weight of harvest in a day was also highest in 2016. As a whole, at least 56 clams m-2 was harvested each year, which is larger than the number of native clam density in Sanbanze in last 30 years (figure 2-7). Daily maximum number of harvest was 7.0 - 11.6 individuals m-2, which is larger than the number of native clam density in Sanbanze in 2016
30 (Figure 2-7).
31 a) 2016
b) 2017
c)2018
Figure 3-3 Total amount of spread clams (white bars over 0 line) and total amount of harvested clams (black bars below 0 line) in 2016 (a), 2017 (b) and 2018 (c). Gray bars mean input of Meretrix. Dates with a red bar are weekends (Saturday and Sunday) and National holiday. This graph is based on statistical data offered by Funabashi city park association.
Amount of clams (kg) Harvest Spread
Amount of clams (kg) Harvest Spread
Amount of clams (kg) Harvest Spread
32
Figure 3-4 Sea creatures washed away ashore. The photograph A was taken 12th June 2018 and B was taken 13th of June 2018. Both photographs were taken in the clamming area in Funabashi Sanbanze seaside park.
Figure 3-5 Red sting rays came to the area were killed by management staff. The photograph was taken 12th June 2018 in Funabashi Sanbanze seaside park.
A B
33 Table 3-1 Spread and harvest pressure converted to population density.
Density = number of individuals m-2 = Total weight / individual weight (7.1g) /area width (134,000 m2).
Total amount of spread clams for whole season Total amount of harvest for whole season Maximum amount of harvest in a day
Year Weight (kg) Density
(number of individuals m-2) Weight (kg) Density
(number of individuals m-2) Weight (kg) Density
(number of individuals m-2)
2016 127,000 133.5 69,858.7 73.4 10,984.1 11.6
2017 119,970 126.1 53,490.0 56.2 6,617.7 7.0
2018 146,050 153.5 62,794.0 66.0 7,370.4 7.8
34 Estimation of population density
Figure 3-6 shows temporal changes in population density of adult clams inside the clamming area (N01 - N10 in figure 2-11) estimated through all the number of individuals found were multiplied by 25 to estimate population density. Due to the tide condition and limitation in investigators, number of points surveyed in a day was varied. Before the clamming season, population density of adult clams were 0 in all points. During the clamming season, density of clams partially in the area raised supposedly by spreading, whilst density levels of voluntary spots remain 0 or low (25 individuals m-2). Also while density survey, I found occurrences of juvenile clams (15mm and smaller) from beginning of June (figure 3-7).
Additionally, population density outside of the clamming area (S01 - S05 in figure 2-11) was estimated to be low through clamming season. Table 3-2 shows that clams were found only once out of 30 investigations, and only one clam was found at the one spot. The results indicate that population density of adult clams would not increase without spreading clams.
Clams spread did not seem to flow from inside to outside of the clamming area.
I also examined temporal changes in population density (figure 3-6) by comparing day of spreading and harvesting (figure 3-3 c). Before the clamming season, population density of adult clams were 0 in all points. After first spread, extremely high density of clams was found at one spot, while other four points were still in low density. From 15th of May, a day after spreading, median became lower and variance became smaller until 20th of May. This changed after spreading on 21st of May, as on 22nd of May, density range become slightly larger than 20th, and median became higher. On 27th of May, median became lower and variance became smaller than 22nd. However, density gap was larger in 29th and 30th while median kept decreasing till 30th, After the spread of 4th of June, density range kept narrow and density of each spots were low. Median gradually decrease after spread, and recover when clams were spread.
35
Figure 3-6 Estimated population density of adult clams inside of the clamming area based on the quadrat survey. N shows the number of points investigated in a day.
Table 3-2 The number of adult clams found outside of the clamming area based on the quadrat survey.
ID Total number of investigations Investigation when adult clams was found
S1 3 0
S2 4 1
S3 11 0
S4 3 0
S5 9 0
Total 30 1
Population density of clams (number of individuals m-2) Adult clam
36
Figure 3-7 Estimated population density of juvenile clams inside of the clamming area based on the quadrat survey. N shows the number of points investigated in a day.
Population density of juvenile clams (number of individuals m-2) Juvenile clam
37
Resource abundance and harvest pressure of participants
The relationship between the daily total harvest and the daily total number of participants for the day was examined.
Figure 3-8 shows the relationship between number of participants a day and total amount of harvest in the day in 2016, 2017 and 2018. In 2018, total harvest with 12,067 participants was less than that with 9,761 participants. However, the total harvest increases almost in proportion to number of participants over all. The two variables were correlated significantly (Pearson correlation test, p < 0.01) in all the three years, and correlation coefficients were 0.97 for 2016, 0.99 for 2017, and 0.94 for 2018, respectively (table 3-3). I also performed regression analysis which the dependent variable was total amount of harvest, and the independent variable is number of clamming participants (table 3-3).
Coefficient for number of participants were 0.61 for 2016, 0.64 for 2017, 0.56 for 2018.
38
Figure 3-8 Relationship between number of participants a day and total amount of harvest in the day in a) 2016, b) 2017, c) v2018.
0 5000 10000 15000
020004000600080001000012000
p2018$pp
p2018$hvst
0 5000 10000 15000
020004000600080001000012000
p2017$pp
p2017$hvst
0 5000 10000 15000
020004000600080001000012000
p2016$pp
p2016$hvst
Number of participants for a day
N = 38 N = 42 N = 36
a) 2016 b) 2017 c) 2018
Total amount of harvest for a day (kg)
39 Table 3-3 Result of correlation analysis and regression analysis.
Year 2016 2017 2018
Correlation
Coefficient 0.97** 0.99** 0.94**
Regression analysis
Adjusted R2 0.93 0.98 0.87
F-value 523.6** 1764** 240.5**
Coefficient for number of participants 0.61 0.64 0.56
40 Factors affecting amount of clam harvest
I performed multi regression analysis to investigate the factors which affect harvest for a group who responded to the questionnaire. Table 3-4 shows the correlation between variables. Of the 32 factors, three factors (presence of rent fork, use of train and bus) were excluded due to their multicollinearity. Table 3-5 is the result of multi regression analysis.
The model was significant with 1% significant level (adjusted R2 = 0.279, F = 3.559, p < 0.01).
There are six factors that significantly influences the amount of harvest: number of participants in group in total, age of respondent, number of participants in age of 7 – 19, number of participants in age of 6 and younger, time length spent in the clamming area, and group of friends.
41
Table 3-4 Correlation efficient between each variables. Each factor are represented with 1-31, the list in a following page below shows the details.
1 2 3 4 5 6 7 8 9 10 11 12 13 14 15 16 17 18 19 20 21 22 23 24 25 26 27 28 29 30 31
2 0.7**
3 0.1 0.1
4 0.1* 0.1 0.1
5 0.3** 0.2** 0.3** 0.1*
6 -0.3** -0.2** -0.1* -0.1 -0.8**
7 0.2** 0.1 -0.1 0.1 0.2** -0.3**
8 -0.1 -0.1 0.1 0.0 -0.2* 0.3** -0.6**
9 0.0 0.0 -0.3** -0.2* -0.2* 0.1 -0.1 -0.1
10 0.2* 0.2** 0.0 0.0 0.1* -0.2* 0.0 0.0 0.1
11 -0.1 -0.1 0.1 0.0 -0.1 0.1 0.1 0.0 0.0 -0.1
12 0.0 -0.1 0.0 0.0 -0.1 0.0 0.0 0.0 0.1 0.0 0.4**
13 -0.2** -0.1* 0.1* 0.2** 0.0 0.0 0.0 0.0 -0.2** -0.1* 0.1 0.0 14 0.3** 0.2** 0.0 0.2** 0.1* -0.1 0.2** -0.1 0.0 0.2** -0.1* 0.0 0.0
16 0.1 0.1* 0.0 -0.1 0.0 0.0 0.0 0.0 0.1 0.2** -0.1 -0.2* 0.0 0.1
16 0.2** 0.1 0.0 0.0 0.1 -0.1 0.0 0.1 0.0 0.1 -0.1 0.0 0.0 0.1 -0.1
17 0.2** 0.1 -0.1 0.0 0.1 -0.1 0.0 0.0 0.0 0.0 -0.1* 0.0 -0.1 0.0 0.0 0.4**
18 0.2** 0.1 0.0 0.0 0.1 -0.1 0.1 0.0 0.0 0.0 0.0 -0.1 0.1 0.0 0.0 0.3** 0.5**
29 0.1* 0.1 0.0 0.0 0.0 0.0 0.0 0.0 0.1* 0.1 0.0 0.0 -0.1 0.0 -0.1 0.2** 0.3** 0.3**
20 0.3** 0.2** 0.0 0.0 0.1 -0.1 0.0 0.0 0.1 0.2** -0.1 0.0 0.0 0.1 0.1 0.2** 0.3** 0.4** 0.3**
21 0.0 0.0 0.0 0.1 0.0 0.0 0.1 0.0 0.0 0.0 0.0 -0.1* 0.0 0.0 0.0 0.0 0.2** 0.2** 0.0 0.0
22 0.3** 0.2** 0.0 0.1 0.0 -0.1 0.1* 0.0 0.1 0.0 -0.1 -0.1* -0.1 0.2** 0.1 0.1 0.1* 0.1 0.1* 0.1 0.2**
23 0.0 0.0 0.0 0.1 0.0 0.0 0.0 0.1* -0.1 0.0 0.0 -0.1 0.4** 0.0 0.0 0.1 0.0 -0.1 0.0 0.1 -0.1* 0.0
24 0.0 0.0 0.2** 0.1 0.0 0.0 0.0 0.0 -0.2** 0.0 0.1 0.1 0.4** 0.0 0.1 0.1 0.1 0.1 -0.1 0.0 0.0 0.1 0.0
25 -0.2** -0.2** 0.1* 0.1 0.0 0.0 -0.1 0.1 -0.1 -0.2** 0.2** 0.0 0.4** -0.1 -0.1 -0.1 -0.1 0.1 0.0 0.0 0.1 -0.1 0.0 0.0
26 0.1* 0.2* 0.3** 0.1 0.2* -0.1 0.1 0.0 -0.1* 0.1 -0.1 -0.1 0.2** 0.2** 0.1 0.1 0.1 0.1* 0.0 0.1 0.1 0.1* 0.1 0.1 0.2**
27 -0.2** -0.2** -0.3** -0.1 -0.2** 0.1 -0.1 0.0 0.2* -0.1 0.1 0.1 -0.1 -0.1* -0.1 -0.1 -0.1 -0.2** 0.0 -0.2* -0.1 -0.1 0.0 -0.1* -0.2** -0.8**
28 -0.2* -0.1* -0.1 -0.1 -0.1 0.1 0.0 0.0 0.0 -0.1 0.1 0.1 -0.2** -0.1 -0.1 -0.2* -0.1 -0.2* 0.0 -0.2** -0.1* -0.1 -0.1 -0.1 -0.1 -0.8** 0.7**
29 0.1 0.0 -0.1 0.0 0.0 0.0 -0.1 0.0 0.2* 0.0 0.0 0.0 -0.1 0.0 0.0 -0.1 0.0 -0.1 0.0 0.1 0.0 -0.1* -0.1* -0.1 -0.1 -0.3** 0.0 -0.1
30 -0.1 -0.1 -0.1* 0.0 0.0 0.0 0.0 0.1* 0.0 0.0 0.1 0.1 0.1 0.0 0.0 0.0 0.1 0.0 0.0 0.1* 0.0 0.0 0.1 0.1 0.0 -0.2** 0.2** 0.2** 0.0
31 0.0 0.0 0.1 0.1 0.0 -0.1 0.0 -0.1 -0.1 0.1 -0.1 0.1 0.1* 0.2** 0.1** 0.1 0.0 0.0 -0.1 0.0 0.0 0.0 0.1 0.1 0.0 0.0 0.0 0.0 -0.1 0.0
32 -0.2** -0.2** 0.1 0.1 0.0 0.1 0.0 0.0 -0.2** -0.2** 0.2** 0.1 0.3** 0.0 -0.1 0.0 0.0 0.0 -0.1 -0.1 -0.1 -0.2** 0.1 0.2** 0.2** 0.0 -0.1 0.0 0.0 0.0 0.0