Title
Application of mRNA expression analysis to human blood identification in degenerated samples that were false-negative by immunochromatography
Authors and their highest degree
Shusaku Matsumura,1,2 M.S.; Aya Matsusue, 2 Ph.D.; Brian Waters, 2 M.S.;
Masayuki Kashiwagi, 2 M.D., Ph.D.; Kenji Hara, 2 Ph.D.; Shin-ichi Kubo, 2 M.D., Ph.D.
Affiliations
1Forensic Science Laboratory, Fukuoka Prefectural Police Headquarters, 7-7, Higashikoen, Hakata-ku, Fukuoka 812-8576, Japan
2Department of Forensic Medicine, Faculty of Medicine, Fukuoka University, 7-45-1 Nanakuma, Jonan-ku, Fukuoka 814-0180, Japan
Foundation
This research was supported in part by a Grant-in Aid for Challenging Exploratory Research (No.
25670347) from the Japan Society for the Promotion of Science (JSPS).
Disclaimer
The authors have no disclaimer and declared no conflicts of interest.
Presentation
A part of this paper has been presented in the 9th International Symposium on Advances in Legal Medicine, June 2014 at Fukuoka, Japan.
ABSTRACT
Forensic laboratories are often faced with cases in which methamphetamine hydrochloride-mixed blood is unable to be identified as human blood by immunochromatography against human
hemoglobin A0. The application of mRNA expression analysis to samples that showed a false- negative with immunochromatography was investigated as an alternative approach that did not depend on the antigen-antibody reaction. Real-time PCR was used to examine the expression levels of blood markers such as glycophorin A, spectrin beta, and hemoglobin beta. Hemoglobin beta was the only marker that was specifically detected in blood, while glycophorin A was useful for
determining human specificity. Hemoglobin beta showed good detection sensitivity and was detectable in 37-year-old blood stains. Hemoglobin beta was exclusively detectable in methamphetamine hydrochloride-mixed blood stains. Detergents and disinfectants did not
significantly influence mRNA markers. The proposed mRNA expression analysis was suitable for human blood identification as an alternative method to immunochromatography.
(145 words/ no more than 150 words) Keywords: forensic science, blood identification, messenger RNA, real-time polymerase chain
reaction, glycophorin A, hemoglobin beta, species specificity, methamphetamine hydrochloride, detergent
(9 keywords/ a minimum of six keywords)
In many criminal investigations, DNA analysis that targets short tandem repeats (STR) plays an important role in personal identification from biological samples, such as body fluids, left at crime scenes. However, prior to DNA analysis, the identification of specific body fluids, including what species it originated from, is also an essential procedure. Human blood is frequently left at crime scenes, and human blood identification serves as important evidence in many criminal cases
including murder, assault, and theft. Most forensic science laboratories currently use serological and enzymatic tests for blood identification. As an alternative to classical methods such as the ring test or counter-current electrophoresis, simple and rapid immunochromatographic assay kits such as OC-Hemocatch (Eiken Kagaku, Tokyo, Japan) (1,2) and HEXAGON OBTI (BLUESTAR, Monte Carlo, Monaco) (3) are now being used for routine examinations.
In forensic casework, forensic laboratories are often faced with cases in which methamphetamine hydrochloride-mixed blood is insoluble in water, and, thus, may not be identified as human blood by immunological tests such as OC-Hemocatch, as reported previously (4-6). A previous study reported that blood stains mixed with detergents containing surfactants showed false-negative results with immunochromatography, and also that disinfectants such as benzalkonium chloride and benzethonium chloride gave false-positive results (7). Therefore, an alternative approach to the antigen-antibody reaction is needed in order to examine blood samples that are not amenable to immunological tests.
The analysis of body fluid-specific mRNA expression levels has recently been reported as a promising tool for the identification of body fluids in biological stains (8-20). In 2005, Juusola and Ballantyne reported multiplex mRNA profiling for the identification of body fluids using agarose gel electrophoresis and capillary electrophoresis format (8). They described genes were specifically expressed in each of the forensically relevant body fluids. In 2006, Nussbaumer et al. demonstrated mRNA profiling for body fluid identification using real-time RT-PCR (9). They developed real- time PCR assays that were useful in discrimination of different body fluids by measuring relative gene expression levels in comparison to an endogenous control. In 2009, Haas et al. demonstrated
mRNA profiling for body fluid identification by endpoint and real-time RT-PCR (10). They showed both methods were suitable for the identification of body fluid in forensic science. Sakurada et al.
demonstrated the feasibility of identifying body fluids using real-time RT-PCR assay, and their method showed high sensitivity rather than the conventional method in the older stains (11). They also evaluated the performance of real-time RT-PCR to identify body fluids such as sweat, nasal blood, and nasal secretions which have difficulty in identification (13,16,19,20). In 2012, Hanson et al. demonstrated successful detection of mRNA transcripts from genes with a high degree of
specificity for skin in ‘touch DNA’ samples (17). Many mRNA markers exist for various body fluids. However, mRNA is rapidly degraded by ubiquitous ribonucleases, and, thus, the detection of mRNA in biological samples was previously considered to be unsuitable for forensic use. However, several recent studies indicated that mRNA in stains under suitable conditions were more stable than originally considered, and also that the analysis of mRNA may even be applicable to older samples. For example, mRNA markers could be detected in a 16-year-old blood stain and 6-year- old saliva stain (21).
Therefore, in order to develop a novel method for the identification of human blood using a real- time RT-PCR assay, mRNA derived from genes highly expressed in blood was focused on, and 3 target genes such as glycophorin A (GYPA), spectrin beta (SPTB), and hemoglobin beta (HBB) were selected. In this study, not only blood specificity and detection sensitivity, but also species specificity was evaluated. Furthermore, the applicability of mRNA expression analysis as a human blood identification method to forensic samples, as well as the effects of various environmental conditions and contaminants such as detergents and drugs on the stability of mRNA markers was also examined.
Materials and Methods
This study was approved by the Human Genome/Gene Analysis Research Ethics Committee of the Japanese Association of Forensic Science and Technology (approval number: 24GR2/23-3).
RNA and cDNA preparations of human blood and other body fluids
Human body fluids comprising blood, saliva, urine, and semen were collected from healthy volunteers (n = 7-12; aged 26-54 years) with informed consent.
Animal blood samples were collected from the chimpanzee, Bornean orangutan, white-handed gibbon, Japanese macaque, lion-tailed macaque, De Brazza’s guenon, cattle, pig, dog, cat, fox, and raccoon dog (n = 1-3).
Total RNA was extracted from these samples immediately after they were obtained using the RNeasy Mini Kit (QIAGEN, Hilden, Germany) or QIAamp RNA Blood Mini Kit (QIAGEN), and any contaminating DNA was digested with DNase I using the RNase-Free DNase Set (QIAGEN) according to the manufacturer’s instructions. cDNA was synthesized with random hexamers and oligo-dT primers using the PrimeScript RT Reagent Kit (TAKARA, Tokyo, Japan) on the
GeneAmp PCR System 9700 (Applied Biosystems, Foster, CA) at 37°C for 15 min, then 85°C for 5 s. Five microliters of total RNA was reverse-transcribed in a total reaction volume of 10 L.
Human blood samples (0.001-10 L) were placed on sterilized gauze and kept at an ambient temperature for the preparation of blood stains.
Eight blood stains that had been stored at an ambient temperature for 3-37 years were used as old blood stains.
Target genes and expression analysis
The selected target genes were GYPA, SPTB, and HBB. GYPA is a sialoglycoprotein of the erythrocytic membrane, and determines the MN blood type (22). SPTB is a major component of the erythrocyte membrane skeleton (23). HBB is the beta subunit of the adult hemoglobin, HbA, which
is composed of 2 alpha subunits and 2 beta subunits (24). These 3 genes are erythrocytic markers.
CD3 gamma (CD3G) was used as a leukocytic marker. CD3 is associated with T cell receptors, and this complex plays an important role in several signal transduction pathways, and CD3G is one of the 4 peptides that form CD3 (25). The housekeeping genes actin beta (ACTB) and 18S rRNA (18S) were selected as control genes. ACTB was used to compensate for the different amounts of total RNA. 18S was used as an endogenous control for animal blood samples to confirm that total RNA extraction and cDNA synthesis had been performed properly.
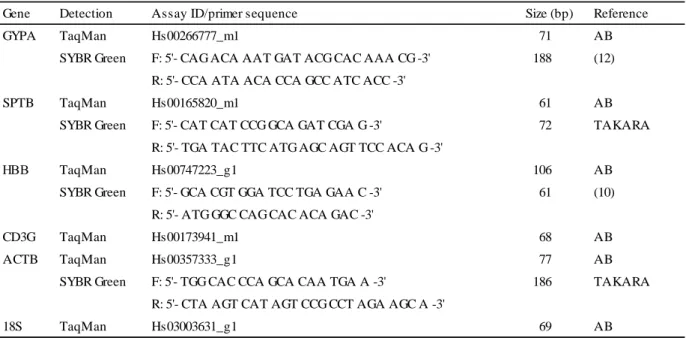
A gene expression analysis was performed by real-time PCR with 2 different detection methods, namely the TaqMan assay and SYBR Green assay. The TaqMan probes shown in Table 1 and Premix Ex Taq (TAKARA) were used in the TaqMan assay. The primers shown in Table 1 and SYBR Premix Ex Taq (TAKARA) were used in the SYBR Green assay. The final concentration of each primer was 0.2 M.
Two microliters of cDNA was amplified in a total volume of 25 L on a Smart Cycler II System (Cepheid, Sunnyvale, CA), irrespective of the detection methods. The PCR conditions of the TaqMan assay were 95°C for 10 s, followed by 45 cycles of 95°C for 5 s and 60°C for 20 s, while those of the SYBR Green assay were 95°C for 10 s, followed by 45 cycles of 95°C for 5 s and 60°C for 20 s and a melting curve (60-95°C with a heating rate of 0.2°C/s).
ACTB real-time PCR amplification curves were obtained for different amounts (10 fg-100 ng) of total RNA extracted from 1 mL of blood, and a calibration curve was constructed from the Ct values (Ct: the cycle number at which the fluorescent signal passed the threshold of detection) and RNA concentrations. The linear amplification range of the Ct values of ACTB (TaqMan assay: 19- 37, SYBR Green assay: 15-37) was set as the limit of the quantification range. Similarly, the cut-off Ct values of GYPA, SPTB, HBB, and CD3G with the TaqMan assay were determined at 38.5, 40, 39.5, and 38, respectively, and those of GYPA, SPTB, and HBB with the SYBR Green assay were determined at 40, 39, and 40, respectively. The delta Ct (dCt) value was used to compare the expression levels of target genes among body fluid or animal blood samples. The dCt value was
calculated by subtracting the Ct value of ACTB from that of the target genes. A small dCt value indicated the strong expression of the respective target transcript, while a large dCt value indicated weak expression.
Statistical analyses were conducted using the Student’s t-test, a one-way ANOVA with Dunnett’s or Scheffé’s multiple comparison test. Significance was set at 1% (P < 0.01).
Immunochromatographic assay for human blood identification
Each blood stain was cut into small pieces and extracted with 200 L of phosphate-buffered saline (PBS, pH 7.2) for 30 min. A 100-μL portion of the extract was dropped onto a sample well of the OC-Hemocatch (OC-H). After 5 min, the test result was determined according to the
manufacturer’s instructions.
Ultraviolet, temperature, and humidity treatments to blood
Ten microliters of blood deposited on sterilized gauze was irradiated with 200 or 2000 mJ/cm2 of ultraviolet (UV, 254 nm) light using a BIO-LINKTM UV Crosslinker (VILBER LOUMAT, Marne- la-Vallee, France) (n = 3). Total RNA was extracted from these blood stains immediately after UV irradiation.
Ten microliters of blood deposited onto a cotton swab was air-dried at 4 °C (in a refrigerator, n = 3), 22 °C (at ambient temperature, n = 3), and 37 °C (in an incubator, n = 3). The humidity at each temperature was approximately 35, 55, and 35 %, respectively. To prepare blood stain samples in wet conditions, 10 L of blood was deposited onto a cotton swab moistened with 50 L of distilled water. After being sealed, these swabs were kept at 22 °C (n = 3). Total RNA was extracted from these blood stains after 7 days.
Detergents or disinfectant added to blood
All the detergents and disinfectant used in this study were commercially available products. The dishwashing detergent contained sodium polyoxyalkylene alkyl ether sulfate, alkyl hydroxy
sulfobetaine, alkyl glycoside, alkyl amine oxide, alkyl glycel ether, and polyoxyethylene alkyl ether, and the density of its surfactants was 43 %. The laundry detergent contained sodium linear alkyl benzene sulfonate, polyoxyethylene alkyl ether, alkyl amide amine salt, and fatty acid sodium, and the density of its surfactants was 33 %. The bath detergent contained fatty acid amidopropyl betaine, polyoxyethylene alkyl ether, alkyl glycoside, sodium alkyl ether sulfate, and fatty acid sodium, and the density of its surfactants was 9 %. The toilet detergent contained fatty acid amidopropyl betaine and alkyl glycoside, and the density of its surfactants was 4 %. The disinfectant contained 0.1% of benzethonium chloride. The dishwashing and laundry detergent were diluted with PBS to the concentration of use described in the instruction manual of each product, 0.75 and 0.83 mL/L, respectively.
Thirty microliters of blood (n = 3) was mixed with an equivalent volume of the detergents or disinfectant, and incubated for 30 min at ambient temperature. Total RNA was extracted from these samples immediately after incubation. A gene expression analysis was then performed
Addition of methamphetamine to blood
Methamphetamine hydrochloride (MA, Dainippon Sumitomo Pharmas, Osaka, Japan, molecular weight = 185.69) and methoxyphenamine hydrochloride (MP, MP Biomedicals, Tokyo, Japan, molecular weight = 215.72) were used in the present study. MP has a similar structure to MA (26), but has no stimulant effect, which is different from MA. MA or MP was added to blood, which was subsequently deposited on sterilized gauze to create a blood stain. Total RNA was extracted from these samples followed by the gene expression analysis.
DNA extraction, DNA quantification, and STR analysis
DNA was extracted using the EZ1 DNA Investigator Kit (QIAGEN) and EZ1 Advanced XL (QIAGEN), and eluted with 50 L of TE buffer. The concentration of DNA was measured using the Human Genome Quantification Kit (TAKARA), a real-time PCR-based DNA quantification kit, on a Smart Cycler II System. The STR analysis was performed using the AmpFlSTR Identifiler Kit (Applied Biosystems) and GeneAmp PCR System 9700. One nanogram of DNA was amplified in a total reaction volume of 25 L. The detection of amplified products and data analysis were
performed using the 3130xl Genetic Analyzer (Applied Biosystems) and GeneMapper ID-X
(Applied Biosystems), respectively. Each kit was used according to the manufacturer’s instructions.
Results
Gene expression specificity among human blood and other body fluids
The dCt values of GYPA, SPTB, and HBB were examined in 30 L of blood, saliva, urine, and semen (blood, saliva and urine: n = 10, semen: n = 7). The Ct value of ACTB was within the quantitative range in almost all samples, except for 2 urine samples in the TaqMan assay (TaqMan assay: Ct = 22.76-36.42, SYBR Green assay: Ct = 20.00-35.65).
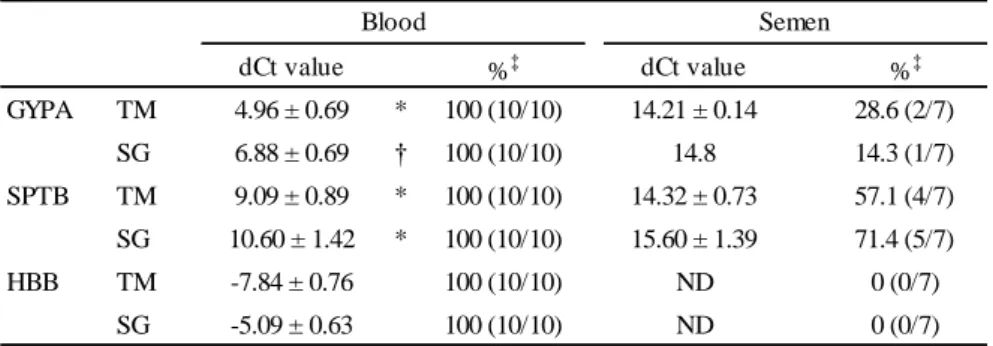
No blood markers were detected in saliva or urine. As shown in Table 2, GYPA was detected in all blood samples and 2 out of 7 semen samples with the TaqMan assay. The dCt values of the blood samples were significantly lower than those of the detected semen samples (P < 0.001).
Similar results were obtained in the SYBR Green assay; GYPA was detected in all blood samples and 1 out of 7 semen samples. The dCt values of the blood samples were significantly lower than that of the detected semen sample (P < 0.001). SPTB was detected in all blood samples by both the TaqMan assay and SYBR Green assay. In addition, it was detected in 4 and 5 out of 7 semen samples by the TaqMan assay and SYBR Green assay, respectively. In both detection methods, the dCt values of the blood samples were significantly lower than those of the detected semen samples (P < 0.001). HBB was only detected in blood and not in the other body fluids by both the TaqMan assay and SYBR Green assay. The negative controls, to which no reverse transcriptase was added, did not give substantial Ct values.
Gene expression specificity among human and animal species
To evaluate the species specificity of GYPA, SPTB, HBB, and ACTB, 30 L of blood from each animal species was examined. 18S, an endogenous control, was detected in all animal blood
samples. In addition, the negative controls, to which no reverse transcriptase was added, did not give substantial Ct values.
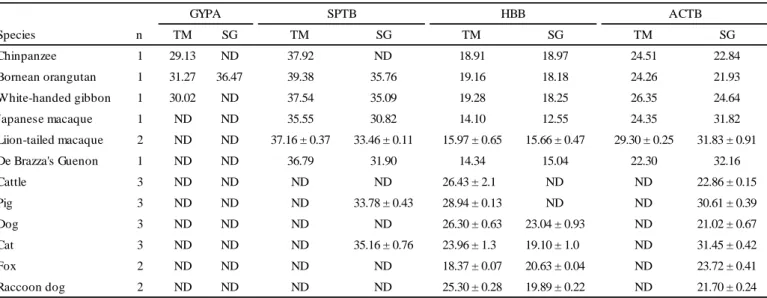
As shown in Table 3, GYPA was detected in the blood of the chimpanzee, Bornean orangutan, and white-handed gibbon by the TaqMan assay. Only the Bornean orangutan sample was detected
by the SYBR Green assay. SPTB was detected in the blood of only primates (the chimpanzee, Bornean orangutan, white-handed gibbon, Japanese macaque, lion-tailed macaque, and De Brazza’s guenon) by the TaqMan assay. SPTB was detected in the blood of the primates except the
chimpanzee, pigs, and cats by the SYBR Green assay. HBB was detected in the blood of all animals by the TaqMan assay, and in primates, dogs, cats, foxes, and raccoon dogs by the SYBR Green assay. ACTB was detected in the blood of only primates by the TaqMan assay and in all animals by the SYBR Green assay. The differences observed in the results obtained with the TaqMan assay and SYBR Green assay were attributed to differences in the PCR primer sequences.
Regarding mRNA markers detected in animals’ blood, whether animal blood was discriminable from human blood by comparing dCt values was determined. The permissive range that a sample may be derived from human blood was set at a mean±SD of 5-fold that examined in human blood.
Data on the dCt values of human blood were those used in the section of “Gene expression specificity among human blood and other body fluids”. The permissive ranges of GYPA with the TaqMan assay and SYBR Green assay were 1.51-8.41 and 2.13-11.63, respectively. The permissive ranges of SPTB with the TaqMan and SYBR Green assays were 4.64-13.54 and 3.50-17.70,
respectively. The permissive ranges of HBB with the TaqMan and SYBR Green assays were
−11.64 to −4.04 and −8.24 to −1.94, respectively. The dCt values of GYPA in the chimpanzee (4.62), Bornean orangutan (7.01), and white-handed gibbon (3.67) entered the permissive range of GYPA with the TaqMan assay. Although GYPA with the SYBR Green assay was only detected in the blood of the Bornean orangutan, its dCt value (14.54) did not enter the permissive range;
therefore, no animal entered this range. The dCt values of SPTB in the chimpanzee (13.41), white- handed gibbon (11.19), Japanese macaque (11.20), and lion-tailed macaque (7.86±0.63) entered the permissive range with the TaqMan assay, and in the Bornean orangutan (13.83), white-handed gibbon (10.45), and cat (3.71±0.52) entered the permissive range with the SYBR Green assay. The dCt values of HBB in the chimpanzee (-5.60), Bornean orangutan (-5.10), white-handed gibbon (- 7.07), Japanese macaque (-10.25), and De Brazza’s guenon (-7.96) entered the permissive range of
HBB with the TaqMan assay. ACTB in the blood of non-primates (cattle, pig, dog, cat, fox, and raccoon dog) was undetectable with the TaqMan assay; thus, the dCt values of HBB with the TaqMan assay were unable to be calculated. The dCt values of HBB in the chimpanzee (-3.87), Bornean orangutan (-3.75), white-handed gibbon (-6.39), and fox (-3.09±0.37) entered the permissive range of HBB with the SYBR Green assay.
The blood of the primates showed positive results with the OC-H test, whereas that of non- primates showed negative results.
Detection sensitivity of blood
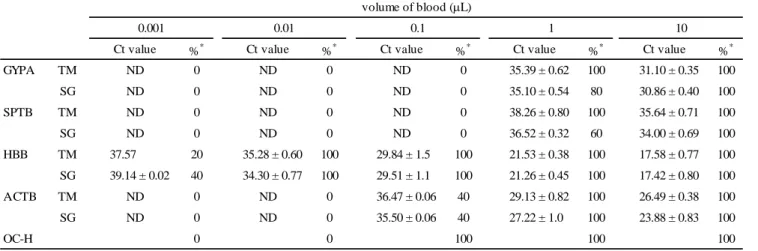
The detection sensitivity of target genes and ACTB, which was examined in 0.001-10 L blood stains (3 days old, n = 5), was summarized in Table 4.
Both GYPA and SPTB were detectable in all blood stains as small as 1 L and 10 L by the TaqMan assay and SYBR Green assay, respectively. With the SYBR Green assay, GYPA and SPTB were detectable in 4 and 3 1-μL blood stain samples, respectively. GYPA and SPTB were undetectable in all blood stains with 0.1 μL of sample, irrespective of the detection method. HBB was detectable in all blood stains as small as 0.01 μL. In 0.001 μL blood stains, HBB was detectable in 1 and 2 samples by the TaqMan assay and SYBR Green assay, respectively. ACTB was
detectable in all blood stains as small as 1μL and in 2 blood stains with 0.1μL of samples, and undetectable in all blood stains with 0.01μL of samples, irrespective of the detection method.
The detection sensitivity of the OC-H test was also examined. Blood samples as small as 0.1 L showed positive results.
Detection sensitivity of aged blood
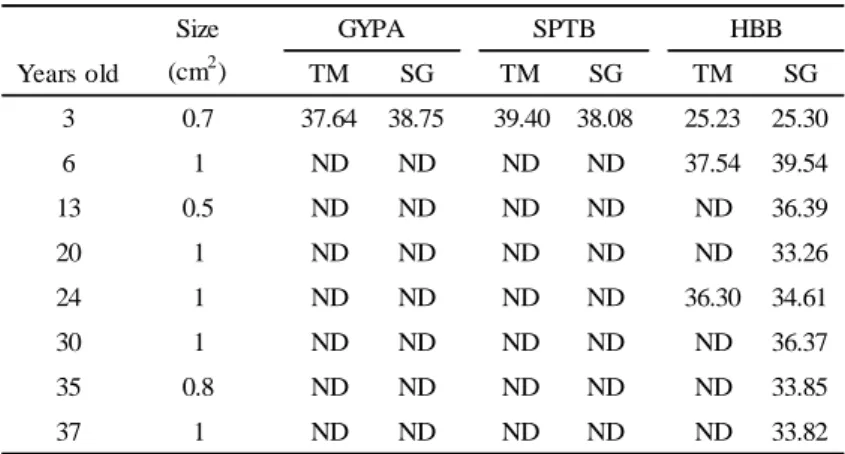
To investigate the applicability of this mRNA analysis to aged samples, 3-37-year-old blood stains (n = 8) stored at an ambient temperature were analyzed. As shown in Table 5, GYPA and SPTB were detectable only in the 3-year-old sample, irrespective of the detection method. With the
TaqMan assay, HBB was detectable in samples stored within 6 years and in the 24-year-old sample.
However, with the SYBR Green assay, HBB was detectable in all samples, including the 37-year- old sample. No relationship was found between the Ct value and storage period.
Effects of ultraviolet light, temperature, and humidity
The influence of UV on the stability of target genes was examined. As shown in Figure 1, as the irradiation energy increased, higher Ct values were observed in all genes. Furthermore, the Ct values for GYPA with both detection methods and HBB with the TaqMan assay were significantly increased by UV irradiation (P < 0.01).
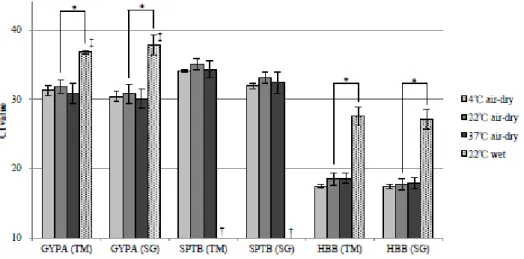
The influence of temperature and humidity on the stability of target genes was also examined. As shown in Figure 2, no significant differences were observed in the levels of mRNA for target genes between blood samples air-dried at 4, 22, and 37 °C. On the other hand, Ct values for GYPA and HBB were significantly higher in blood stains stored under wet conditions at 22 °C than in air-dried blood stains at 22 °C (P < 0.01), and SPTB was undetectable, irrespective of the detection method.
In addition, DNA was extracted from the air-dried blood stains and the blood stains stored under wet conditions at 22 °C (n = 3), and the concentration of DNA was then measured by real-time PCR.
In contrast to mRNA, an increase in Ct values due to humidity was not observed (data not shown).
Effects of detergents and a disinfectant
The Ct values for GYPA, SPTB, HBB, and ACTB were determined in blood (n = 3) mixed with 4 detergents and a disinfectant. As a control, 30 L of blood mixed with an equivalent volume of PBS was used. As shown in Figure 3, the dishwashing and laundry detergents did not significantly increase the Ct values for any mRNA markers, irrespective of the detection method. The bath detergent significantly increased the Ct values for SPTB, HBB, and ACTB with the TaqMan assay and GYPA and HBB with the SYBR Green assay (P < 0.01). The toilet detergent significantly increased the Ct values for GYPA, HBB, and ACTB (P < 0.01), and SPTB was undetectable in the
blood mixture, irrespective of the detection method. The disinfectant significantly increased the Ct values for SPTB and ACTB with the TaqMan assay (P < 0.01).
Regarding mRNA markers with Ct values that were significantly increased, the 2dCt' value was calculated to digitize the difficulty of being detected against the control. The dCt’ value was obtained by subtracting the Ct value of a blood sample mixed with a detergent or disinfectant from that of the control. The 2dCt’ values in blood mixed with the bath detergent, toilet detergent, and disinfectant were 5.62-9.32, 86.82-215.27, and 4.29-6.59, respectively. Although the expression of GYPA, SPTB, HBB and ACTB was examined with both the TaqMan and SYBR Green assays in 30 L of each of the detergents, disinfectant, and PBS, none gave substantial Ct values.
Effects of methamphetamine
The OC-H test was performed using stains containing 5μL of MA-mixed blood (25, 250, and 500 μg/μL, 14 days old, n = 5). The stain with 25 μg/μL of MA-mixed blood showed positive results, whereas both the 250 and 500 μg/μL stains showed negative results.
To investigate the applicability of our method to human blood identification in MA-mixed blood stains, total RNA was extracted from MA-mixed blood stains, and the expression of mRNA
markers was then determined (Table 6).
GYPA, SPTB, HBB, and ACTB as a reference gene were detected in almost all normal blood samples. However, although the stain with 25 g/L of MA-mixed blood was OC-H positive, GYPA and SPTB were undetectable in a few samples. GYPA, SPTB, and ACTB were not detectable in the 250 and the 500 μg/μL stains (OC-H negative). HBB was detected in almost all samples by both the TaqMan assay and SYBR Green assay. However, the Ct values of HBB detected in the 250 or 500 μg/μL stains (OC-H negative) were significantly higher than those in normal blood (P < 0.001).
To determine if the blood component was involved in the deterioration of the detection power, total RNA extracted from normal blood (n = 3) was divided into two parts. MA was added to one of
the parts (final concentration = 500 g/L), and total RNA was then re-extracted from both parts.
After reverse transcription, the Ct value of HBB was determined with the SYBR Green assay. No significant differences were observed in the resulting Ct values between the samples with or without MA (MA-mixed sample: Ct = 17.42±0.25, non-treated sample: Ct = 17.41±0.15).
To establish whether the deterioration in the detection power was caused specifically by MA, the following experiment using MP was carried out. MA-mixed blood (500 μg/μL) and MP-mixed blood (580 μg/μL) were prepared. Similar to MA-mixed blood, the color of the MP-mixed blood had a strong black tinge relative to normal blood. The OC-H test was performed using stains containing 5 μL of MP-mixed blood (3 days old, n = 3), with all samples showing negative results.
The Ct values of HBB in stains with 5 μL of normal, MA-mixed, and MP-mixed blood (3 days old, n = 3) were determined using the TaqMan assay. As shown in Figure 4, Ct values were significantly higher in MP-mixed blood stains than in normal blood stains (P < 0.01), but were not significantly different from those of MA-mixed blood stains.
To investigate whether differences existed between mRNA and DNA in the influence of MA, DNA was extracted from normal and MA-mixed blood stains (25, 250 and 500 μg/μL, 14 days old, n = 5), and DNA quantification and the STR analysis were then performed. The results of the DNA quantification revealed that although the Ct value was significantly higher in the 500 μg/μL MA- mixed blood stain than in normal blood, the increment in Ct values was only approximately 3 (Fig.
5). Furthermore, regardless of the MA concentration, full profiles were obtained from all samples in the STR analysis (data not shown), suggesting that the influence of MA on DNA was smaller than that of mRNA. DNA in blood exists mainly in leukocytes; therefore, the mRNA marker in
leukocytes may be detectable without being affected so much by MA. The Ct values of CD3G as a leukocyte marker were determined for 500 μg/μL of MA-mixed blood stains and normal blood stains (5μL, 3 days old, n = 3) with the TaqMan assay. CD3G was detectable in all normal blood stains (Ct = 36.79±0.44), but not in the MA-mixed blood stains.
Discussion
As the accuracy of DNA profiling increases, it is important to establish the origin of extracted DNA. Blood is one of the most prevalent body fluids in forensic practices. However, when left under severe conditions, identification by conventional methods often becomes difficult.
In the present study, the specificity and sensitivity of GYPA, SPTB, and HBB mRNAs were evaluated as markers for blood in forensic casework using two different types of real-time PCR in order to investigate a new approach for human blood identification.
Specificity against blood
GYPA and SPTB were undetectable in saliva and urine, but were detected in blood and semen.
The ratio of detection in semen was 14.3 % (GYPA with the TaqMan assay) to 71.4 % (SPTB with the SYBR Green assay), whereas GYPA and SPTB were always detected in blood. Furthermore, a significant difference was observed in the dCt value between blood and semen. Therefore, blood was considered to be discriminable from semen using dCt values.
HBB was specifically detected in blood only. This result supported the findings of Haas et al. (9).
Unlike the dCt values of GYPA and SPTB, those of HBB were negative, indicating that this gene was strongly expressed in blood. Nussbaumer et al. previously reported that although hemoglobin alpha (HBA) exhibited some cross reactivity with saliva, vaginal fluid, and semen, their expression levels were lower than that of blood (9). They suggested that erythrocytes were present due to bleeding from the gingiva or from menstrual blood. Although HBB was not detected in the non- blood samples tested in this study, it may be detected in body fluids other than blood as HBA.
However, in such cases, these samples are identifiable by confirming the dCt value. Furthermore, based on the view of Nussbaumer et al., the sample is considered to contain blood when HBA or HBB is detected.
Specificity against human blood
The blood of pets and wild animals injured by an accident, or animal blood deposited on a knife used for cooking may be tested as a sample suspected of being human blood. Accordingly,
preventing unnecessary DNA analyses by appropriate species identification is important for an efficient criminal investigation.
In order to investigate specificity against animal species, the blood of 12 animals including 6 primates was analyzed, and whether human blood was discriminable from animal blood was established. GYPA was exclusively detected in the blood of the Bornean orangutan by the SYBR Green assay, making it the most beneficial marker. Furthermore, the blood of humans and Bornean orangutans may be distinguished by comparing the dCt value. A previous study also reported that GYPA was undetectable in the blood of 7 non-primates (6 mammals and 1 bird) by capillary
electrophoresis (12). With the SYBR Green assay, the dCt values of SPTB and HBB in the blood of primates belonging to the Coecopithecidae family (i.e., Japanese macaque, lion-tailed macaque, and De Brazza’s guenon) (SPTB: dCt = −1.01 to 2.43, HBB: dCt = −19.28 to −15.74) were significantly lower than those of humans (P < 0.001). This could explain why the Ct values of ACTB were significantly higher in these primates than in humans (P < 0.001). Most primate populations do not have much contact with human society; therefore, the presence of their blood is not generally considered. However, many wild Japanese macaques live in close proximity to humans in Japan, and there are often reported cases of them attacking humans. The detection of SPTB or HBB by the SYBR Green assay may be useful for blood identification in a case or an accident in which
Japanese macaques are involved. Thus, our method can discriminate human blood from primate blood, whereas the OC-H test cannot, and also has better species specificity than the conventional method.
Whether animal blood could be discriminated from human blood by comparing the melting temperature value (Tm: temperature at which 50% of double stranded-DNA dissociated) obtained by the melting curve analysis in the SYBR Green assay was also examined, similar to the dCt value.
The Tm value of SPTB for De Brazza’s guenon and that of HBB for dogs, foxes, and raccoon dogs
were considered to be useful in species identification (data not shown). Since fox blood was difficult to discriminate from human blood using the dCt value, the Tm value can be an effective index for discriminating between human blood and fox blood.
Detection sensitivity
GYPA, SPTB, and HBB were detectable from 1 L, 1 L and 0.001 L blood stains,
respectively. Our results for SPTB and HBB are in agreement with the findings reported by Haas et al. (10). Since the sensitivity of the OC-H test was 0.1 L, only HBB was superior in its sensitivity among the 3 target genes. Therefore, HBB may be useful in forensic practice in which there are many opportunities to handle stains with very small amounts of blood.
Stability against aging and environment
Since RNA is considered to degrade rapidly, using a mRNA expression analysis in forensic practice may be a concern because of its low stability. In a routine investigation, it is not uncommon to test samples more than 10 years after the sample was deposited. Therefore, mRNA expression levels in aging blood stains up to 37 years old was examined. The expression analysis of GYPA and SPTB indicated that they were not effective in aging blood. On the other hand, since HBB, in particular with the SYBR Green assay, was detectable in the 37-year-old blood stain, it can be recommended as an excellent marker for older blood stains. These results support the findings of Kohlmeier and Schneider (27). They showed that HBB was detectable in a 23-year-old blood stain.
Similar results were obtained for the expression levels of the 3 mRNAs between aging samples and detection sensitivity. The ease of detection of HBB in aging blood could be explained by its higher expression level than those of GYPA and SPTB.
In our study, UV and humidity influenced the stability of mRNA. Sakurada et al. demonstrated that UV and humidity were important factors in the RNA degradation of the saliva marker "histatin 3 mRNA" (11). In our results, a significant increase was observed in the Ct value by UV irradiation
in GYPA and HBB. One of the reasons for these increase might be that pyrimidine-dimers were created in RNA molecules by UV irradiation, and they inhibited PCR. Our UV irradiation condition was milder than that of Sakurada et al. (consecutive irradiation for 14 days). If the irradiation condition was more severe, a significant increase in Ct values may have been observed with all target genes. In this study, UV light at a wavelength of 254 nm was used. Since this wavelength is effectively absorbed by the Earth’s ozone layer, further investigations are required on the stability of mRNA exposed to sunlight.
Under wet conditions, the Ct values of the target genes in blood were significantly higher (GYPA and HBB) than those in the air-dried samples or undetectable (SPTB); therefore, humidity was considered to be one of the most detrimental environmental factors to the stability of mRNA. In addition, the mRNA markers in this study were more susceptible to wet conditions than DNA (Fig.
2 and data not shown). Therefore, if our method is applied to a sample left in wet conditions for a long time, the interpretation of the test result should be carefully considered.
Stability against detergents and a disinfectant
The dishwashing and laundry detergents used in this study did not strongly affect the stability of the mRNA markers. Based on the 2dCt' value, the deterioration of the detection power by the bath detergent and disinfectant was thought to be within 1/10. However, the toilet detergent was thought to deteriorate the detection power to below approximately 1/100. Although it was more difficult to detect mRNA markers in blood mixed with the bath detergent or disinfectant than in normal blood, they were still considered to be at a sufficiently high level to not be considered a major problem.
The disinfectant gave a false-positive result by the OC-H test, whereas the mRNA expression analysis did not. Thus, our method may be useful for the identification of human blood stains on an adhesive bandage treated with disinfectant, and may also be suitable as an alternative to
immunochromatography.
Our results indicated that the toilet detergent deteriorated the detection power so much (Fig. 3), and its application to a very small amount of blood stain was not easy. The surfactant components of the toilet detergent were also present in the bath detergent. Fatty acid amidopropyl betaine and alkyl glycoside, commonly included in both bath and toilet detergents, appeared to have adversely impacted on the detection power; however, the other surfactants in the bath detergent may have counteracted this negative effect. Another explanation could be that a component other than the surfactants may have affected the detection power. The results of this study indicated that some detergents adversely impacted the stability of mRNA. Therefore, a highly sensitive marker such as HBB should be used when a blood stain is being examined that is suspected of having been mixed with detergents.
Stability against methamphetamine
This method was applied to MA-mixed blood stains. GYPA, SPTB, and ACTB were
undetectable in MA-mixed blood stains, which also showed negative results by the OC-H test. HBB was detectable in all but several samples; however, a marked deterioration was observed in the detection power. Our results demonstrated that the blood component played a crucial role in the deterioration of the detection power by MA, and suggest that MA did not directly inhibit the processes of total RNA extraction, cDNA synthesis, and real-time PCR; hence, denatured blood by MA may disturb RNA extraction.
In experiments using MP, which has a relatively similar structure to that MA, similar results to those for MA were obtained in terms of appearance, the OC-H test, and mRNA expression analysis.
This indicated that the deterioration of the detection power was not a specific phenomenon to MA.
The hydrochloride salt of MP was also used. The mechanism underlying the detection power drop needs to be clarified in future studies using compounds with similar structures to that of MA or containing hydrochloride.
The influence of MA on DNA was also examined. The difference observed in the Ct value with real-time PCR between 500 g/l of MA-mixed blood stains and normal blood stains was only approximately 3. In contrast, the difference in the Ct value for HBB mRNA was higher than 10. In addition, the STR analysis was successful regardless of the presence of MA, indicating that the influence of MA on DNA in terms of extraction and PCR was smaller than that of mRNA. One possible explanation for why the stability of DNA was superior to that RNA was the presence of a nuclear membrane.
CD3G, a leukocyte marker, was detectable in normal blood stains similar to the erythrocyte markers (GYPA, SPTB and HBB), but not in MA-mixed blood stains. These results indicated that regardless of the cell type in blood, the presence of MA caused mRNA to denature, thereby inhibiting RNA extraction.
Since GYPA was undetectable in the MA-mixed blood stains examined in this study, it became difficult to perform species identification. However, since DNA is less susceptible to MA, as described above, species identification may be possible using D17Z1 (28) or FOXP2 (29,30).
Therefore, human blood identification using HBB mRNA and DNA for species identification may be an alternative for MA-mixed blood stains that show negative results on the OC-H test.
Conclusion
In the present study, mRNA expression analysis was investigated for human blood identification, and the results obtained demonstrated that HBB and GYPA are suitable mRNA markers.
1) HBB was useful for blood specificity and detection sensitivity.
2) GYPA was useful for human specificity.
3) HBB was detectable in aging blood stains.
4) HBB was exclusively detectable in MA-mixed blood stains.
5) Detergents and a disinfectant did not influence mRNA markers so much.
Therefore, the human blood identification method utilizing HBB and GYPA is applicable to blood stains.
Acknowledgments
We would like to thank Fukuoka Municipal Zoo and Botanical Garden, Fukuoka Meat Wholesale Market Corporation, and Fukuoka City Animal Welfare Management Center for kindly offering primates’ blood and other animal blood.
The authors would also like to thank Associate professor Kazuo Umetsu of the Department of Experimental and Forensic Pathology, Yamagata University, for his generous supply of the aging blood stains.
References
1. Takai T, Kooriyama K, Ujiie K, Tsuchiya M, Hashiyada M. Detection of human hemoglobin with OC-Hemocatch, a commercially available occult blood test. Res Pract Forensic Med 1995;38:101–4.
2. Shiraishi T, Sekiguchi K, Ohmori T. Validation study of ‘OC-Hemocatch’ for the forensic identification of human blood. Jpn J Sci Tech Iden 2003;7(2):159-65.
3. Hochmeister MN, Budowle B, Sparkes R, Rudin O, Gehrig C, Thali M et al. Validation studies of an immunochromatographic 1-step test for the forensic identification of human blood. J Forensic Sci 1999;44:597-602.
4. Ishii Y, editor. The characteristics of the blood stain mixed methamphetamine hydrochloride.
Abstract of Second Annual Meeting of Japanese Association of Science and Technology for Identification; 1996 Nov 21-22; Tokyo. Tokyo: Japanese Association of Science and
Technology for Identification, 1996.
5. Miyake Y, editor. The characteristics of the blood stain mixed methamphetamine hydrochloride.
Abstract of Third Annual Meeting of Japanese Association of Science and Technology for Identification; 1997 Nov 13-14; Tokyo. Tokyo: Japanese Association of Science and Technology for Identification, 1997.
6. Hayakawa K, editor. Identification of human blood on water-insoluble blood stain by methamphetamine hydrochloride. Abstract of Seventeenth Annual Meeting of Japanese
Association of Forensic Science and Technology; 2011 Nov 17-18; Tokyo. Kashiwa: Japanese Association of Forensic Science and Technology, 2011.
7. Shiraishi T, Sekiguchi K, Ohmori T, Sakurada K. The effects of detergents and disinfectants in
‘OC-Hemocatch’ on the forensic identification of human blood. Jpn J Sci Tech Iden 2004;9:143-9.
8. Juusola J, Ballantyne J. Multiplex mRNA profiling for the identification of body fluids.
Forensic Sci Int 2005;152:1–12.
9. Nussbaumer C, Gharehbaghi-Schnell E, Korschineck I. Messenger RNA profiling: a novel method for body fluid identification by real-time PCR. Forensic Sci Int 2006;157:181–6.
10. Haas C, Klesser B, Maake C, Bar W, Kratzer A. mRNA profiling for body fluid identification by reverse transcription endpoint PCR and realtime PCR. Forensic Sci Int Genet 2009;3:80–8.
11. Sakurada K, Ikegaya H, Fukushima H, Akutsu T, Watanabe K, Yoshino M. Evaluation of mRNA-based approach for identification of saliva and semen. Leg Med 2009;11:125-8.
12. Fleming RI, Harbison S. The development of a mRNA multiplex RT-PCR assay for the definitive identification of body fluids. Forensic Sci Int Genet 2010;4:244–56.
13. Sakurada K, Akutsu T, Fukushima H, Watanabe K, Yoshino M. Detection of dermcidin for sweat identification by real-time RT-PCR and ELISA. Forensic Sci Int 2010;194:80–4.
14. Akutsu T, Ikegaya H, Watanabe K, Fukushima H, Motani H, Iwase H et al. Evaluation of Tamm-Horsfall protein and uroplakin III for forensic identification of urine. J Forensic Sci 2010;55:742-6.
15. Visser M, Zubakov D, Ballantyne KN, Kayser M. mRNA-based skin identification for forensic applications. Int J Leg Med 2011;125:253-63.
16. Sakurada K, Akutsu T, Watanabe K, Fujinami Y, Yoshino M. Expression of statherin mRNA and protein in nasal and vaginal secretions. Leg Med 2011;13:309-13.
17. Hanson E, Haas C, Jucker R, Ballantyne J. Specific and sensitive mRNA biomarkers for the identification of skin in 'touch DNA' evidence. Forensic Sci Int Genet 2012;6:548–58.
18. Akutsu T, Watanabe K, Motani H, Iwase H, Sakurada K. Evaluation of latex agglutination tests for fibrin-fibrinogen degradation products in the forensic identification of menstrual blood. Leg Med 2012;14:51-4.
19. Sakurada K, Akutsu T, Watanabe K, Yoshino M. Identification of nasal blood by real-time RT- PCR. Leg Med 2012;14:201-4.
20. Sakurada K, Akutsu T, Watanabe K, Miyasaka S, Kasai K. Identification of Body Fluid Stains Using Real-time RT-PCR: Discrimination Between Salivary, Nasal, and Vaginal Secretions.
Jpn J Forensic Sci Tech 2013;18:1-11.
21. Zubakov D, Kokshoorn M, Kloosterman A, Kayser M. New markers for old stains: stable mRNA markers for blood and saliva identification from up to 16-year-old stains. Int J Leg Med 2009;123:71-4.
22. Chasis JA, Mohandas N. Red blood cell glycophorins. Blood 1992;80:1869-79.
23. Chu ZL, Wickrema A, Krantz SB, Winkelmann JC. Erythroid-specific processing of human beta spectrin I pre-mRNA. Blood 1994;84:1992-9.
24. Levings PP, Bungert J. The human beta-globin locus control region. Eur J Biochem 2002;269:1589-99.
25. Hall C, Berkhout B, Alarcon B, Sancho J, Wileman T, Terhorst C. Requirements for cell surface expression of the human TCR/CD3 complex in non-T cells. Int Immunol 1991;4:359- 68.
26. Hsieh YC, Whang CW. Analysis of ethambutol and methoxyphenamine by capillary
electrophoresis with electrochemiluminescence detection. J Chromatogr A. 2006;1122:279-82.
27. Kohlmeier F, Schneider PM. Successful mRNA profiling of 23 years old blood stains. Forensic Sci Int Genet. 2012;6:274-6.
28. Nakahara H, Fujii K, Mizuno N, Yoshida K, Kasai K. Evaluations of DNA Quantification Method for Forensic Biological Samples. Jpn J Forensic Sci Tech 2007;12:13-26.
29. Hiroshige K, Soejima M, Nishioka T, Kamimura S, Koda Y. Simple and sensitive method for identification of human DNA by allele-specific polymerase chain reaction of FOXP2. J Forensic Sci 2009;54:857–61.
30. Soejima M, Hiroshige K, Yoshimoto J, Koda Y. Selective quantification of human DNA by real-time PCR of FOXP2. J Forensic Sci Genet 2012;6:447–51.
Additional information and reprint requests:
Shin-ichi Kubo, M.D., Ph.D.
Department of Forensic Medicine, Faculty of Medicine, Fukuoka University 7-45-1 Nanakuma
Jonan-ku, Fukuoka 814-0180 Japan
E-mail: [email protected]
TABLE 1―Real-time PCR assay IDs and PCR primer sequences.
Gene Detection Assay ID/primer sequence Size (bp) Reference
GYPA TaqMan Hs00266777_m1 71 AB
SYBR Green F: 5'- CAG ACA AAT GAT ACG CAC AAA CG -3' 188 (12) R: 5'- CCA ATA ACA CCA GCC ATC ACC -3'
SPTB TaqMan Hs00165820_m1 61 AB
SYBR Green F: 5'- CAT CAT CCG GCA GAT CGA G -3' 72 TAKARA
R: 5'- TGA TAC TTC ATG AGC AGT TCC ACA G -3'
HBB TaqMan Hs00747223_g1 106 AB
SYBR Green F: 5'- GCA CGT GGA TCC TGA GAA C -3' 61 (10)
R: 5'- ATG GGC CAG CAC ACA GAC -3'
CD3G TaqMan Hs00173941_m1 68 AB
ACTB TaqMan Hs00357333_g1 77 AB
SYBR Green F: 5'- TGG CAC CCA GCA CAA TGA A -3' 186 TAKARA
R: 5'- CTA AGT CAT AGT CCG CCT AGA AGC A -3'
18S TaqMan Hs03003631_g1 69 AB
AB: Applied Biosystems
TABLE 2―Specificity of GYPA, SPTB, and HBB in blood and semen.
dCt value %‡ dCt value %‡
GYPA TM 4.96 ± 0.69 * 100 (10/10) 14.21 ± 0.14 28.6 (2/7) SG 6.88 ± 0.69 † 100 (10/10) 14.8 14.3 (1/7) SPTB TM 9.09 ± 0.89 * 100 (10/10) 14.32 ± 0.73 57.1 (4/7) SG 10.60 ± 1.42 * 100 (10/10) 15.60 ± 1.39 71.4 (5/7)
HBB TM -7.84 ± 0.76 100 (10/10) ND 0 (0/7)
SG -5.09 ± 0.63 100 (10/10) ND 0 (0/7)
Blood Semen
TM: TaqMan assay, SG: SYBR Green assay, ND: Not detected,
*p < 0.001, Student’s t-test, †p < 0.001, one sample t-test, ‡Detection rate
TABLE 3―Ct values of GYPA, SPTB, HBB, and ACTB in animal blood.
Species n TM SG TM SG TM SG TM SG
Chinpanzee 1 29.13 ND 37.92 ND 18.91 18.97 24.51 22.84
Bornean orangutan 1 31.27 36.47 39.38 35.76 19.16 18.18 24.26 21.93
White-handed gibbon 1 30.02 ND 37.54 35.09 19.28 18.25 26.35 24.64
Japanese macaque 1 ND ND 35.55 30.82 14.10 12.55 24.35 31.82
Liion-tailed macaque 2 ND ND 37.16 ± 0.37 33.46 ± 0.11 15.97 ± 0.65 15.66 ± 0.47 29.30 ± 0.25 31.83 ± 0.91
De Brazza's Guenon 1 ND ND 36.79 31.90 14.34 15.04 22.30 32.16
Cattle 3 ND ND ND ND 26.43 ± 2.10 ND ND 22.86 ± 0.15
Pig 3 ND ND ND 33.78 ± 0.43 28.94 ± 0.13 ND ND 30.61 ± 0.39
Dog 3 ND ND ND ND 26.30 ± 0.63 23.04 ± 0.93 ND 21.02 ± 0.67
Cat 3 ND ND ND 35.16 ± 0.76 23.96 ± 1.30 19.10 ± 1.00 ND 31.45 ± 0.42
Fox 2 ND ND ND ND 18.37 ± 0.07 20.63 ± 0.04 ND 23.72 ± 0.41
Raccoon dog 2 ND ND ND ND 25.30 ± 0.28 19.89 ± 0.22 ND 21.70 ± 0.24
GYPA SPTB HBB ACTB
ND: Not detected
TABLE 4―Sensitivity of GYPA, SPTB, HBB, and ACTB in blood.
Ct value %* Ct value %* Ct value %* Ct value %* Ct value %*
GYPA TM ND 0 ND 0 ND 0 35.39 ± 0.62 100 31.10 ± 0.35 100
SG ND 0 ND 0 ND 0 35.10 ± 0.54 80 30.86 ± 0.40 100
SPTB TM ND 0 ND 0 ND 0 38.26 ± 0.80 100 35.64 ± 0.71 100
SG ND 0 ND 0 ND 0 36.52 ± 0.32 60 34.00 ± 0.69 100
HBB TM 37.57 20 35.28 ± 0.60 100 29.84 ± 1.5 100 21.53 ± 0.38 100 17.58 ± 0.77 100 SG 39.14 ± 0.02 40 34.30 ± 0.77 100 29.51 ± 1.1 100 21.26 ± 0.45 100 17.42 ± 0.80 100
ACTB TM ND 0 ND 0 36.47 ± 0.06 40 29.13 ± 0.82 100 26.49 ± 0.38 100
SG ND 0 ND 0 35.50 ± 0.06 40 27.22 ± 1.0 100 23.88 ± 0.83 100
OC-H 0 0 100 100 100
volume of blood (L)
0.001 0.01 0.1 1 10
ND: Not detected, *Detection rate
TABLE 5―Ct values of GYPA, SPTB, and HBB in aging blood stains.
Years old TM SG TM SG TM SG
3 0.7 37.64 38.75 39.40 38.08 25.23 25.30
6 1 ND ND ND ND 37.54 39.54
13 0.5 ND ND ND ND ND 36.39
20 1 ND ND ND ND ND 33.26
24 1 ND ND ND ND 36.30 34.61
30 1 ND ND ND ND ND 36.37
35 0.8 ND ND ND ND ND 33.85
37 1 ND ND ND ND ND 33.82
HBB SPTB
GYPA Size
(cm2)
ND: Not detected
TABLE 6―Ct values of GYPA, SPTB, HBB, and ACTB in MA-mixed blood.
MA
(g/L) Ct value %* Ct value %* Ct value %* Ct value %*
0 TM 34.36 ± 1.4 100 37.81 ± 0.73 100 19.61 ± 0.73 100 32.33 ± 0.84 100 SG 32.81 ± 1.4 100 36.15 ± 0.88 80 18.96 ± 0.76 100 31.12 ± 1.2 100 25 TM 35.44 ± 1.3 80 38.81 ± 0.24 60 20.35 ± 0.97 100 33.54 ± 0.53 100 SG 34.72 ± 1.2 100 37.26 ± 0.94 80 20.45 ± 0.85 100 32.82 ± 1.5 100
250 TM ND 0 ND 0 33.22 ± 3.4 80 ND 0
SG ND 0 ND 0 35.45 ± 2.7 100 ND 0
500 TM ND 0 ND 0 31.92 ± 1.4 80 ND 0
SG ND 0 ND 0 31.93 ± 1.4 80 ND 0
GYPA SPTB HBB ACTB
ND: Not detected, *Detection rate
FIG. 1―Effects of ultraviolet irradiation.
*p < 0.01, significant difference versus control, a one-way ANOVA with Dunnett’s multiple comparison test.
FIG. 2―Effects of various temperatures and humidity.
*p < 0.01, t-test, †Not detected in all 3 samples, ‡Not detected in 1 out of 3 samples
FIG. 3―Effects of detergents and a disinfectant.
*p < 0.01, significant difference versus control, a one-way ANOVA with Dunnett’s multiple comparison test, †Not detected in all 3 samples, ‡Not detected in 1 out of 3 samples
FIG. 4―Ct values of HBB in MA- or MP-mixed blood.
*p < 0.01, a one-way ANOVA with Scheffé’s multiple comparison test.
FIG. 5―Ct values of DNA quantification in MA-mixed blood.
*p < 0.01, significant difference versus control, a one-way ANOVA with Dunnett’s multiple comparison test.