1. I nt r oduct i on
The management of f or est owner s
’cooper at i ves, whi ch ar e cooper at i ves of f or est owner s, i s becomi ng i ncr easi ngl y sever e due t o t he sl uggi sh pr oduct i on act i vi t i es of f or est r y and t he agi ng of t hei r member s. Qual i t at i ve anal yses have been act i vel y conduct ed on t he manager i al pr obl ems of f or est owner s
’cooper at i ves, but not quant i t at i ve anal yses.
1-2)I n addi t i on, st udi es f ul l y ut i l i zi ng f i nanci al st at ement s ( bal ance sheet , and pr of i t and l oss st at ement ) , whi ch ar e usef ul sour ces of i nf or mat i on f or quant i t at i ve anal yses, have r ar el y been at t empt ed.
As t he r esear cher s of t hi s st udy, we have anal yzed t he management of t he f or est owner s
’cooper at i ves usi ng t he
Statistics of the Forest owners’cooperativein Yamagata Prefecture,publ i shed by t he Yamagat a Pr ef ect ur al Of f i ce. Thi s r ecor d of st at i st i cs i s an essent i al r ef er ence mat er i al t o
r eveal t he hi st or y and cur r ent si t uat i ons of t he management of t he f or est owner s
’cooper at i ves i n Yamagat a. The st at i st i cs ar e a hi st or i cal l y i mpor t ant academi c mat er i al as wel l , gi ven t hat not al l pr ef ect ur es publ i ci ze t he f i nanci al st at ement s of t hei r f or est owner s
’cooper at i ves.
The paper pr esent s t he t i me- ser i es changes i n t he management of t he f or est owner s
’cooper at i ves i n Yamagat a Pr ef ect ur e usi ng t hese meani ngf ul dat a of t he f i nanci al st at ement s, i n or der t o pr ovi de t he basi c mat er i al on t he quant i t at i ve anal yses of t he management of f or est owner s
’cooper at i ves.
2. Met hods
Thi s st udy conduct s r eal number and r at i o anal yses ut i l i zi ng t he dat a of t he f i nanci al st at ement s i n t he
StatisticsoftheForestowners’ cooperative in Yamagata Prefecture.The t ar get ed Ti me - Se r i e s Change s i n t he Manage me nt of For e s t Owne r s ’ Coope r at i ve s Evi de nt i n t he i r Fi nanc i al St at e me nt s : Bas e d on t he St at i s t i c s of t he For e s t owne r s ’ c oope r at i v e i n
Yamagat a Pr e f e c t ur e
Masahiro HAYAJIRI1,Masahiro YAMAMOTO2,KojiTAKAHASHI3
1 TottoriRegionalcooperation & Research Center
2 Departmentofmanagementoftechnology,GraduateSchoolofScienceand Engineering,Yamagata University
3 GraduateSchoolofScienceand Engineering,Yamagata University
(平成
20
年12
月10
日受理)Abstract
To clarify thefuturedirection ofthedevelopmentofforestowners
’
cooperatives,itisessentialto precisely grasp theirmanagementtrend.Financialstatements(balancesheet,and profitand lossstatement)arethe mostusefulsourcesofinformation forthispurpose.However,themanagementanalysesusing thesesources are rarely conducted. One reason for this is that not all prefectures publicize the data on the financial statementsofeach forestowners’
cooperative.To providethebasicresearch materialon theanalysesofthe managementofforestowners’
cooperatives,thispaperusesthedataofthefinancialstatementsofallofthe 15 forestowners’
cooperativesin YamagataPrefectureexisting asoftheyear2006 and showsthetime-series changes of their management from fiscal 1974 to 2006. These data are publicized by the Yamagata PrefecturalOffice.cases ar e t hose of Tendoshi For est Owner s
’Cooper at i ve( TFOC) , Hi gashi neshi For est Owner s
’Cooper at i ve( HFOC) , Yuza For est Owner s
’Cooper at i ve( YuFOC) , Sakat a For est Owner s
’Cooper at i ve( SFOC) , Akumi chi ho For est
Owner s
’Cooper at i ve( AkFOC) , Yamagat achi ho For est Owner s
’Cooper at i ve( YaFOC) , Ni shi mur ayama- chi ho For est Owner s
’Cooper at i ve( NmFOC) , At sumi machi For est Owner s
’Cooper at i ve( At - FOC) , Ki t amur ayama For est Owner s
’Cooper - at i ve( Ki FOC) , Yonezawachi ho For est Owner s
’Cooper at i ve ( YoFOC) , Dewashonai For est Owner s
’Cooper at i ve ( DFOC) , Kaneyamamachi For est Owner s
’Cooper at i ve ( KaFOC) , Oguni - machi For est Owner s
’Cooper at i ve ( OFOC) , Ni shi oki t amaf ur usat o For est Owner s
’Cooper - at i ve ( NoFOC) and Mogami koi ki For est Owner s
’Cooper at i ve ( MFOC) . These ar e t he f i f t een f or est owner s
’cooper at i ves oper at i ng as of Mar ch 31st , 2007 i n Yamagat a.
The t ar get ed per i od i s t hat of t he 33 year s f r om f i scal 1974, when t he second t er m of t he For est Owner s
’Cooper at i ve Associ at i ons
Mer ger Pr omot i on Law ( t he f undament al l aw on whi ch t he pr omot i on of f or est owner s
’cooper at i ve amal gamat i on i s based) st ar t ed, t o t he pr esent t i me ( f i scal 2006) .
I n or der t o cl ar i f y t he changes i n management condi t i ons, t he management i ndi cat or s wer e
appl i ed t o t he numer i cal val ues of t he f i nanci al st at ement s f or each t hr ee- year per i od wer e t ot al ed and used i n t he cal cul at i on. The r at i o anal yses adopt some t echni cal t er ms and mat hemat i cal f or mul ae ( Tabl e1) . For t hei r det ai l s, r ef er t o Hayaj i r i and Yamamot o ( 2009) .
3,4)3. Res ul t s
3. 1 Changes i n t he Management Envi r onment and t he Reor gani z at i on of Cooper at i ves
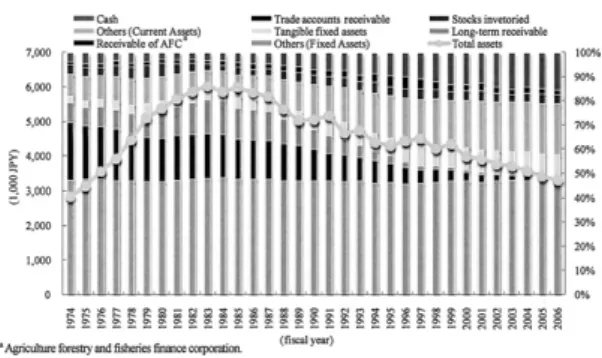
The t ot al asset s of t he f or est owner s
’cooper at i ves i n Yamagat a cont i nued t o decl i ne af t er t hey peaked at appr oxi mat el y 6 bi l l i on JPY at f i scal 1983, and event ual l y decr eased al most by hal f t o appr oxi mat el y 3. 3 bi l l i on JPY at f i scal 2006 ( Fi g. 1) . I n mor e det ai l s, whi l e t he cash r at i o has i ncr eased, l ong- t er m r ecei vabl e and r ecei vabl e of AFC ( agr i cul t ur e f or est r y and f i sher i es f i nance cor por at i on) have decr eased.
Meanwhi l e, t he asset s of al l t he cooper at i ves at f i scal 2006 ar e l ower t han t hose at t hei r peak t i me ( Tabl e 2) .
The t ot al busi ness ear ni ngs r eached appr o- xi mat el y 7. 2 bi l l i on JPY i n f i scal 1996 ( Fi g. 2) . I n f i scal 2006, however , t ot al busi ness ear ni ngs
Fi g. 1 Changes i n t ot al asset s of f or est owner s ’ cooper at i ves and t he br eakdown i n Yamagat a Pr ef ect ur e bet ween f i scal 1974 and 2006
Tabl e 1 Fi nanci al i ndi cat or s
Indicator Formula for computation
ROE (ordinary profit) (%) Ordinary profit / Net-Assets × 100 ROS (ordinary profit) (%) Ordinary profit / Total Business Earnings × 100 Total assets turnover (times) Total Business Earnings / Assets a
SGA ratio (%) Business Administration Expenses / Total Business Earnings × 100 Personnel expenses ratio (%) Personnel expenses / Total Business Earnings × 100 Equity ratio (%) Net-Assets / Assets a× 100
Current ratio (%) Current Assets / Current Liabilities × 100
a Assets = “Assets” (excluding Current Deficit Unappropriated) – (Long-term receivable + Receivable of AFC). AFC is abbreviation of ‘Agriculture forestry and fisheries finance corporation’.
Unit: 1,000 JPY TFOC HFOC YuFOC SFOC AkFOC YaFOC KaFOC AtFOC KiFOC NmFOC YoFOC NoFOC OFOC DFOC MFOC Total a 1975 9,411 76,356 55,128 2,484 㧙 㧙 52,120 392,716 㧙 㧙 㧙 㧙 61,076 㧙 㧙3,143,008 1980 24,407 378,166 99,995 7,293 㧙 270,038 66,764 636,715 㧙 415,375 㧙 㧙 131,029 㧙 㧙5,373,771 1985 30,776 233,369 83,635 10,921 㧙 334,162 92,704 705,448 㧙 511,587 㧙 㧙 181,037 㧙 㧙5,994,023 1990 36,100 215,583 72,183 33,872 㧙 268,566 136,973 562,802 㧙 467,282 㧙 㧙 266,894 㧙 㧙5,051,418 1995 33,399 186,793 89,820 100,422 㧙 285,697 265,063 396,938 㧙 461,669 㧙 㧙 211,778 㧙 313,964 4,293,263 2000 29,540 162,689 100,053 157,300 㧙 231,081 215,539 299,754 240,362 392,022 305,805 376,094 209,779 519,447 371,386 3,982,237 2005 26,896 139,155 126,977 139,958 170,535 221,625 221,867 168,277 258,460 295,090 213,415 261,955 223,783 394,337 360,259 3,412,313
aAll cooperatives in Yamagata Prefecture.
Tabl e 2 Changes i n t ot al asset s of f or est owner s ’ cooper at i ves i n Yamagat a Pr ef ect ur e
decl i ned t o t he l owest l evel i n t he l ast 33 year s.
The r ecent t r end of t he decl i ni ng t ot al busi ness ear ni ngs i s evi dent i n each cooper at i ve as wel l ( Tabl e3) . The same al so appl i es t o t ot al busi ness expenses. However , busi ness admi ni st r at i on expenses decl i ned mor e sl owl y t han di d t ot al busi ness ear ni ngs and expenses.
I n t he mi d- 1990s and af t er t hat , when t he management of t he f or est owner s
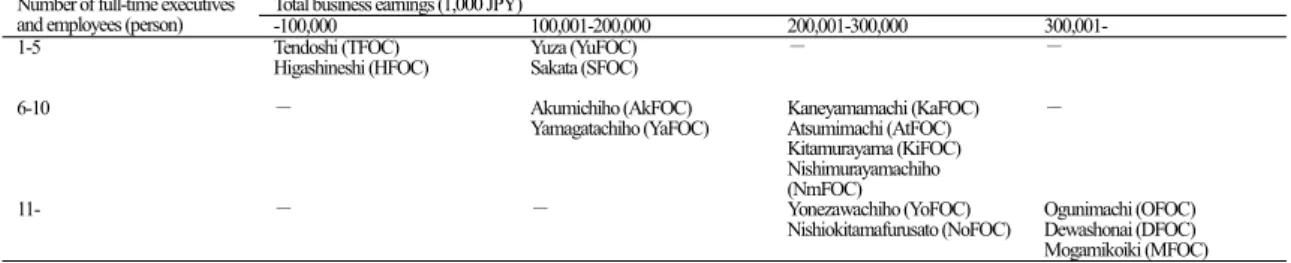
’cooper at i ves began t o become st agnant , t he cooper at i ves st ar t ed t o be r eor gani zed agai n ( Tabl e4) . Because of t hi s r eor gani zat i on, t he number of t he cooper at i ves i n Yamagat a Pr ef ect ur e has decr eased f r om 35 t o 15. As a r esul t , new, wi der - ar ea cooper at i ves cover i ng t wo or mor e muni ci pal gover nment s wer e est abl i shed. As of
Mar ch 31st i n 2007, t her e wer e cooper at i ves wi t h di f f er ent management scal es, r angi ng f r om a smal l one wi t h f i ve or f ewer f ul l - t i me execut i ves and empl oyees and wi t h t ot al busi ness ear ni ngs of 100 mi l l i on JPY or l ess, t o a l ar ge one wi t h 11 or mor e f ul l - t i me execut i ves and empl oyees and wi t h t ot al busi ness ear ni ngs of mor e t han 300 mi l l i on JPY ( Tabl e 5) .
3. 2 Shi f t i n t he Management Si t uat i on evi dent i n t he r at i o anal ys i s
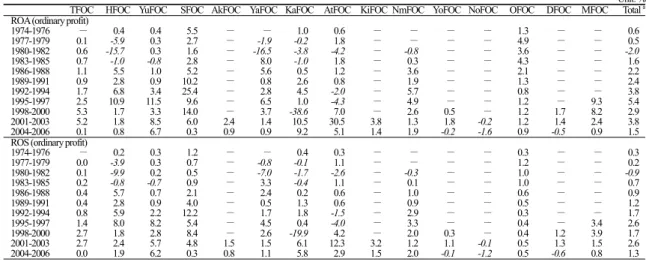
Fi r st , t he st udy exami nes ROA, ROS, and t ot al asset s t ur nover , i n or der t o det er mi ne t he shi f t i n t he management si t uat i on ( Tabl e6, Tabl e7) . ROA means t he r epr oduct i on r at i o of capi t a and i s t he most basi c concept i ndi cat i ng Fi g. 2 Changes i n t ot al busi ness ear ni ngs, t ot al
busi ness expenses and busi ness admi ni st r at i on expenses of f or est owner s ’ cooper at i ves i n Yamagat a Pr ef ect ur e bet ween f i scal 1974 and 2006
Unit: 1,000 JPY TFOC HFOC YuFOC SFOC AkFOC YaFOC KaFOC AtFOC KiFOC NmFOC YoFOC NoFOC OFOC DFOC MFOC Totala 1975 10,343 135,217 27,668 11,641 㧙 㧙 94,703 222,590 㧙 㧙 㧙 㧙 128,914 㧙 㧙2,526,278 1980 21,766 223,322 53,957 24,000 㧙 232,569 105,021 255,410 㧙 352,981 㧙 㧙 282,679 㧙 㧙4,514,958 1985 51,189 115,884 51,933 30,271 㧙 346,496 172,694 288,659 㧙 500,648 㧙 㧙 456,674 㧙 㧙5,212,535 1990 44,137 121,385 51,540 81,941 㧙 374,913 203,061 339,413 㧙 445,960 㧙 㧙 553,757 㧙 㧙5,620,434 1995 38,563 161,893 146,035 175,362 㧙 327,364 705,447 243,865 㧙 551,287 㧙 㧙 498,138 㧙 166,002 6,920,097 2000 47,393 110,126 110,166 163,385 㧙 276,181 364,322 331,460 316,870 438,145 484,999 610,618 511,190 591,999 154,064 5,664,516 2005 35,721 44,483 148,376 145,847 137,561 172,223 330,075 256,840 214,606 291,431 247,775 336,830 440,263 292,899 110,499 3,755,639
aAll cooperatives in Yamagata Prefecture.
Tabl e 3 Changes i n t ot al busi ness ear ni ngs of f or est owner s ’ cooper at i ves i n Yamagat a Pr ef ect ur e
Tabl e 4 Reor gani zat i on of f or est owner s ’ cooper at i ves i n Yamagat a Pr ef ect ur e bet ween f i scal 1974 and 2006
Date of foundation Merged cooperative Predecessor cooperative July 4, 1975 Tendoshi Tendoshi, Hoei December 7, 1976 Yamagatachiho Yamagatashi, Kaminoyamashi,
Yamamoto, Yamanobemachi, Nakayamamachi September 28, 1977 Yonezawashi Bansei, Yamakami, Minamihara,
Yonezawashiseki, Tsunagi, Misawatobu, Misawaseibu, Hirohata, Yonezawa, Kamigo January 19, 1980 Nishimurayamachiho Sagaeshi, Kahoku, Nishikawamachi,
Asahimachi, Oemachi August 1, 1990 Hirata Hirata, Higashihirata April 3, 1995 Mogamikoiki Shinjoshi, Mogamimachi,
Funagatamachi,
Mamurogawamachi, Okuramura, Sakegawamura, Tozawamura October 1, 1996 Kitamurayama Murayamashi, Obanazawashi,
Oishidamachi January 6, 1997 Yonezawachiho Yonezawashi, Nanyoshi,
Takahatamachi, Kawanishimachi April 1, 1997 Dewashonai Tsuruokashi, Tachikawamachi,
Haguromachi, Asahimura, Kushibikimachi,
April 1, 1999 Nishiokitamafurusato Nagaishi, Shiratakamachi, Idemachi April 2, 2001 Akumichiho Yawatamachi, Matsuyama, Hirata
Total business earnings (1,000 JPY) Number of full-time executives
and employees (person) -100,000 100,001-200,000 200,001-300,000 300,001-
1-5 Tendoshi (TFOC)
Higashineshi (HFOC)
Yuza (YuFOC)
Sakata (SFOC) 㧙 㧙
6-10 㧙 Akumichiho (AkFOC)
Yamagatachiho (YaFOC)
Kaneyamamachi (KaFOC) Atsumimachi (AtFOC) Kitamurayama (KiFOC) Nishimurayamachiho (NmFOC)
㧙
11- 㧙 㧙 Yonezawachiho (YoFOC)
Nishiokitamafurusato (NoFOC)
Ogunimachi (OFOC) Dewashonai (DFOC) Mogamikoiki (MFOC)
Tabl e 5 Type of t he f or est owner s ’ cooper at i ve of Yamagat a Pr ef ect ur e ( as of Mar ch 31
st, 2007 )
t he ef f i ci ency i n management . ROA can be di vi ded i nt o ROS and t ot al asset s t ur nover . ROS i s t he r at i o of r et ur n t o t ot al busi ness ear ni ngs and i t i ndi cat es how l ar ge a mar gi n i s. Tot al asset s t ur nover i s used t o gr asp how much pr of i t was made wi t hi n a year on gi ven capi t al , r epr esent i ng t he ef f i ci ency of t he capi t al . Meanwhi l e, t he r at i o anal ysi s uses numer i cal val ues except f or l ong- t er m r ecei vabl e ( l ong- t eem l oans payabl e) and r ecei vabl e of AFC ( l oans payabl e of AFC) . Ther e i s no evi dent t r end det ect ed i n t he shi f t s of ROA and ROS, al t hough t he decl i ni ng t r end i n t ot al asset s t ur nover i mpl i es a decl i ne i n t he ef f i ci ency of t he management .
Second, t he st udy exami nes t he r at i o of t he busi ness admi ni st r at i on expenses t o t ot al busi ness ear ni ngs and t he r at i o of t he per sonnel expenses t o t ot al busi ness ear ni ngs ( Tabl e8) . The i ndex of t he f or mer i s cal l ed t he SGA r at i o
and l at t er i ndex t he per sonnel expenses r at i o.
The SGA r at i o i s t he i ndex t hat r epr esent s t he per cent age of t he busi ness admi ni st r at i on expenses t owar d t ot al busi ness ear ni ngs, t he per sonnel expenses r at i o shows t he per cent age of t he per sonnel expenses, wi t hi n busi ness admi ni st r at i on expenses, t owar d t ot al busi ness ear ni ngs. I n bot h r at i os, i t i s sai d t hat t he smal l er t he numer i cal val ues ar e, t he mor e ef f i ci ent t he oper at i onal cost management and per sonnel cost s ar e. The SGA of t he f i f t een cooper at i ves except f or Kaneyamamachi For est Owner s
’Cooper at i ve( KaFOC) ar e i n t he upwar d t r end. The per sonnel expenses r at i o exhi bi t s a si mi l ar t endency.
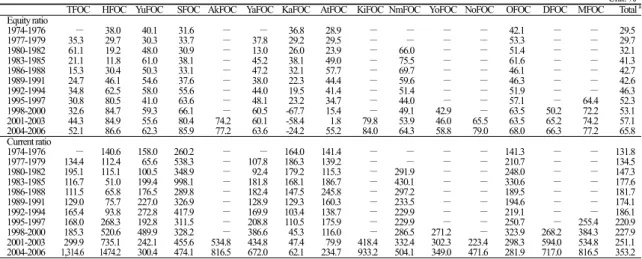
The st udy al so exami nes t he equi t y r at i o and t he cur r ent r at i o ( Tabl e9) . The equi t y r at i o i s an i ndex used i n t he saf et y anal yses and r epr esent s t he r at i o of equi t y capi t al i n t he t ot al capi t al . The l ar ger t he numer i cal val ue i s, t he
Unit: % TFOC HFOC YuFOC SFOC AkFOC YaFOC KaFOC AtFOC KiFOC NmFOC YoFOC NoFOC OFOC DFOC MFOC Total a ROA (ordinary profit)
1974-1976 㧙 0.4 0.4 5.5 㧙 㧙 1.0 0.6 㧙 㧙 㧙 㧙 1.3 㧙 㧙 0.6
1977-1979 0.1 -5.9 0.3 2.7 㧙 -1.9 -0.2 1.8 㧙 㧙 㧙 㧙 4.9 㧙 㧙 0.5
1980-1982 0.6 -15.7 0.3 1.6 㧙 -16.5 -3.8 -4.2 㧙 -0.8 㧙 㧙 3.6 㧙 㧙 -2.0 1983-1985 0.7 -1.0 -0.8 2.8 㧙 8.0 -1.0 1.8 㧙 0.3 㧙 㧙 4.3 㧙 㧙 1.6
1986-1988 1.1 5.5 1.0 5.2 㧙 5.6 0.5 1.2 㧙 3.6 㧙 㧙 2.1 㧙 㧙 2.2
1989-1991 0.9 2.8 0.9 10.2 㧙 0.8 2.6 0.8 㧙 1.9 㧙 㧙 1.3 㧙 㧙 2.4
1992-1994 1.7 6.8 3.4 25.4 㧙 2.8 4.5 -2.0 㧙 5.7 㧙 㧙 0.8 㧙 㧙 3.8 1995-1997 2.5 10.9 11.5 9.6 㧙 6.5 1.0 -4.3 㧙 4.9 㧙 㧙 1.2 㧙 9.3 5.4 1998-2000 5.3 1.7 3.3 14.0 㧙 3.7 -38.6 7.0 㧙 2.6 0.5 㧙 1.2 1.7 8.2 2.9 2001-2003 5.2 1.8 8.5 6.0 2.4 1.4 10.5 30.5 3.8 1.3 1.8 -0.2 1.2 1.4 2.4 3.8 2004-2006 0.1 0.8 6.7 0.3 0.9 0.9 9.2 5.1 1.4 1.9 -0.2 -1.6 0.9 -0.5 0.9 1.5 ROS (ordinary profit)
1974-1976 㧙 0.2 0.3 1.2 㧙 㧙 0.4 0.3 㧙 㧙 㧙 㧙 0.3 㧙 㧙 0.3
1977-1979 0.0 -3.9 0.3 0.7 㧙 -0.8 -0.1 1.1 㧙 㧙 㧙 㧙 1.2 㧙 㧙 0.2
1980-1982 0.1 -9.9 0.2 0.5 㧙 -7.0 -1.7 -2.6 㧙 -0.3 㧙 㧙 1.0 㧙 㧙 -0.9 1983-1985 0.2 -0.8 -0.7 0.9 㧙 3.3 -0.4 1.1 㧙 0.1 㧙 㧙 1.0 㧙 㧙 0.7
1986-1988 0.4 5.7 0.7 2.1 㧙 2.4 0.2 0.6 㧙 1.0 㧙 㧙 0.6 㧙 㧙 0.9
1989-1991 0.4 2.8 0.9 4.0 㧙 0.5 1.3 0.6 㧙 0.9 㧙 㧙 0.5 㧙 㧙 1.2
1992-1994 0.8 5.9 2.2 12.2 㧙 1.7 1.8 -1.5 㧙 2.9 㧙 㧙 0.3 㧙 㧙 1.7 1995-1997 1.4 8.0 8.2 5.4 㧙 4.5 0.4 -4.0 㧙 3.3 㧙 㧙 0.4 㧙 3.4 2.6 1998-2000 2.7 1.8 2.8 8.4 㧙 2.6 -19.9 4.2 㧙 2.0 0.3 㧙 0.4 1.2 3.9 1.7 2001-2003 2.7 2.4 5.7 4.8 1.5 1.5 6.1 12.3 3.2 1.2 1.1 -0.1 0.5 1.3 1.5 2.6 2004-2006 0.0 1.9 6.2 0.3 0.8 1.1 5.8 2.9 1.5 2.0 -0.1 -1.2 0.5 -0.6 0.8 1.3
aAll cooperatives in Yamagata Prefecture.
Tabl e 6 Changes i n ROA and ROS of f or est owner s ’ cooper at i ves i n Yamagat a Pr ef ect ur e
Unit: times TFOC HFOC YuFOC SFOC AkFOC YaFOC KaFOC AtFOC KiFOC NmFOC YoFOC NoFOC OFOC DFOC MFOC Total a
1974-1976 㧙 2.6 1.3 4.8 㧙 㧙 2.3 2.1 㧙 㧙 㧙 㧙 3.8 㧙 㧙 2.1
1977-1979 2.8 1.5 1.0 4.0 㧙 2.3 2.3 1.7 㧙 㧙 㧙 㧙 4.0 㧙 㧙 2.1
1980-1982 5.0 1.6 1.5 3.1 㧙 2.4 2.3 1.6 㧙 3.0 㧙 㧙 3.6 㧙 㧙 2.3
1983-1985 3.5 1.2 1.2 3.3 㧙 2.4 2.5 1.7 㧙 3.3 㧙 㧙 4.2 㧙 㧙 2.3
1986-1988 2.5 1.0 1.5 2.5 㧙 2.3 2.8 2.1 㧙 3.5 㧙 㧙 3.3 㧙 㧙 2.5
1989-1991 2.0 1.0 1.0 2.6 㧙 1.6 2.1 1.4 㧙 2.2 㧙 㧙 2.7 㧙 㧙 2.0
1992-1994 2.0 1.2 1.6 2.1 㧙 1.6 2.5 1.3 㧙 2.0 㧙 㧙 2.7 㧙 㧙 2.2
1995-1997 1.8 1.4 1.4 1.8 㧙 1.4 2.5 1.1 㧙 1.5 㧙 㧙 2.7 㧙 2.8 2.1 1998-2000 1.9 0.9 1.2 1.7 㧙 1.4 1.9 1.7 㧙 1.3 1.9 㧙 2.7 1.4 2.1 1.8 2001-2003 1.9 0.8 1.5 1.2 1.6 1.0 1.7 2.5 1.2 1.1 1.6 1.7 2.3 1.1 1.6 1.5 2004-2006 1.6 0.4 1.1 1.1 1.2 0.8 1.6 1.8 0.9 0.9 1.3 1.3 2.1 0.9 1.2 1.2
aAll cooperatives in Yamagata Prefecture.
Tabl e 7 Changes i n t ot al asset s t ur nover of f or est owner s ’ cooper at i ves i n Yamagat a Pr ef ect ur e
mor e st abl e t he composi t i on of t he capi t al and t he management ar e. Thi s i ndex i s hi ghl y val ued i n j udgi ng t he f i nanci al si t uat i on of a cooper at i ve. The cur r ent r at i o shows how much cur r ent asset , whi ch i s t he asset appl i cabl e t o t he r ei mbur sement of t he cur r ent l i abi l i t i es wi t hi n a year , i s owned. The hi gher t he r at i o i s, t he mor e capi t al t her e i s f or shor t - t er m cash management . The st andar ds of t he equi t y r at i o and t he cur r ent r at i o ar e i n t he upwar d t r end i n al l t he cooper at i ves except f or Kaneyamamachi For est Owner s
’Cooper at i ve( KaFOC) , suggest i ng i mpr ovement i n t hei r f i nanci al si t uat i ons.
3. 3 St r uct ur al Changes of t he Pr of i t and Los s by Oper at i ng Depar t ment s
The oper at i ng depar t ment s of f or est owner s
’cooper at i ves mai nl y consi st of consul t i ng, sal es, pur chasi ng ut i l i zat i on and f i nance. These depar t ment s of f er var i ous ser vi ces t o t hei r member s. The consul t i ng depar t ment s pr ovi de manager i al i nst r uct i ons, and t he sal es depar t ment s pr oduce and sel l f or est r y pr oduct s and pr ocessed goods of t hese pr oduct s. The pur chasi ng depar t ment s pr ovi de f or est r y mat er i al s. The ut i l i zat i on depar t ment s ar e engaged i n af f or est at i on and t endi ng, t he cont r ol of pest s, and subsi dy- r el at ed oper at i ons.
The f i nance depar t ment s conduct l oan oper a-
Unit: % TFOC HFOC YuFOC SFOC AkFOC YaFOC KaFOC AtFOC KiFOC NmFOC YoFOC NoFOC OFOC DFOC MFOC Total a SGA ratio
1974-1976 㧙 15.3 35.3 42.0 㧙 㧙 16.6 14.3 㧙 㧙 㧙 㧙 17.4 㧙 㧙 18.6 1977-1979 15.8 16.6 27.5 37.9 㧙 21.5 16.5 12.8 㧙 㧙 㧙 㧙 18.8 㧙 㧙 17.3 1980-1982 23.1 15.5 18.5 35.5 㧙 15.9 18.3 15.3 㧙 23.3 㧙 㧙 14.8 㧙 㧙 17.0 1983-1985 11.2 17.5 31.5 31.0 㧙 10.7 16.4 15.8 㧙 20.9 㧙 㧙 14.5 㧙 㧙 16.6 1986-1988 11.8 14.8 23.3 25.0 㧙 12.2 12.7 14.3 㧙 19.7 㧙 㧙 15.1 㧙 㧙 15.4 1989-1991 17.0 17.3 40.2 21.9 㧙 15.6 13.7 16.7 㧙 27.9 㧙 㧙 17.5 㧙 㧙 19.1 1992-1994 23.7 19.0 35.4 21.7 㧙 17.9 12.3 19.9 㧙 30.1 㧙 㧙 21.0 㧙 㧙 20.9 1995-1997 22.8 18.4 29.7 20.2 㧙 19.4 15.9 24.4 㧙 35.5 㧙 㧙 22.8 㧙 18.2 21.3 1998-2000 20.7 23.9 34.6 22.1 㧙 21.1 11.0 17.3 㧙 34.8 22.3 㧙 23.8 20.7 20.7 22.1 2001-2003 21.2 25.6 19.4 26.7 24.1 26.6 7.2 14.0 20.7 37.4 22.0 25.0 25.8 23.6 24.1 23.2 2004-2006 27.9 30.7 24.3 28.5 27.6 28.3 6.4 16.3 22.8 36.3 24.5 26.3 28.7 23.8 27.6 24.9 Personnel expenses ratio
1974-1976 㧙 0.0 0.0 0.0 㧙 㧙 0.0 0.0 㧙 㧙 㧙 㧙 0.0 㧙 㧙 0.0
1977-1979 0.0 0.0 0.0 0.0 㧙 0.0 0.0 0.0 㧙 㧙 㧙 㧙 0.0 㧙 㧙 0.0
1980-1982 12.5 10.0 11.8 31.2 㧙 28.0 14.9 10.2 㧙 16.4 㧙 㧙 9.3 㧙 㧙 12.9 1983-1985 5.1 11.4 20.7 25.2 㧙 26.7 13.0 11.7 㧙 16.1 㧙 㧙 9.4 㧙 㧙 13.1 1986-1988 3.9 8.2 15.3 20.9 㧙 21.9 10.1 9.7 㧙 11.3 㧙 㧙 11.0 㧙 㧙 11.6 1989-1991 8.1 10.7 26.1 16.7 㧙 25.0 11.4 12.1 㧙 16.9 㧙 㧙 14.4 㧙 㧙 14.1 1992-1994 11.6 12.9 28.4 17.2 㧙 32.5 8.2 15.3 㧙 17.7 㧙 㧙 18.5 㧙 㧙 15.3 1995-1997 14.0 11.3 18.3 10.4 㧙 27.4 7.3 19.0 㧙 19.5 㧙 㧙 18.3 㧙 10.8 14.2 1998-2000 11.4 12.3 17.5 10.3 㧙 32.9 3.4 11.3 㧙 20.4 15.7 㧙 18.6 13.2 13.4 15.0 2001-2003 13.6 13.7 7.9 14.5 16.2 43.9 3.1 8.9 15.4 21.3 14.3 15.9 19.7 14.2 16.2 16.0 2004-2006 18.3 18.2 10.4 15.8 19.8 46.7 2.9 10.2 15.6 21.3 15.1 17.9 21.0 13.3 19.8 17.4
aAll cooperatives in Yamagata Prefecture.
Tabl e 8 Changes i n SGA r at i o and per sonnel expenses r at i o of f or est owner s ’ cooper at i ves i n Yamagat a Pr ef ect ur e
Unit: % TFOC HFOC YuFOC SFOC AkFOC YaFOC KaFOC AtFOC KiFOC NmFOC YoFOC NoFOC OFOC DFOC MFOC Total a Equity ratio
1974-1976 㧙 38.0 40.1 31.6 㧙 㧙 36.8 28.9 㧙 㧙 㧙 㧙 42.1 㧙 㧙 29.5 1977-1979 35.3 29.7 30.3 33.7 㧙 37.8 29.2 29.5 㧙 㧙 㧙 㧙 53.3 㧙 㧙 29.7 1980-1982 61.1 19.2 48.0 30.9 㧙 13.0 26.0 23.9 㧙 66.0 㧙 㧙 51.4 㧙 㧙 32.1 1983-1985 21.1 11.8 61.0 38.1 㧙 45.2 38.1 49.0 㧙 75.5 㧙 㧙 61.6 㧙 㧙 41.3 1986-1988 15.3 30.4 50.3 33.1 㧙 47.2 32.1 57.7 㧙 69.7 㧙 㧙 46.1 㧙 㧙 42.7 1989-1991 24.7 46.1 54.6 37.6 㧙 38.0 22.3 44.4 㧙 59.6 㧙 㧙 46.3 㧙 㧙 42.6 1992-1994 34.8 62.5 58.0 55.6 㧙 44.0 19.5 41.4 㧙 51.4 㧙 㧙 51.9 㧙 㧙 46.3 1995-1997 30.8 80.5 41.0 63.6 㧙 48.1 23.2 34.7 㧙 44.0 㧙 㧙 57.1 㧙 64.4 52.3 1998-2000 32.6 84.7 59.3 66.1 㧙 60.5 -67.7 15.4 㧙 49.1 42.9 㧙 63.5 50.2 72.2 53.1 2001-2003 44.3 84.9 55.6 80.4 74.2 60.1 -58.4 1.8 79.8 53.9 46.0 65.5 63.5 65.2 74.2 57.1 2004-2006 52.1 86.6 62.3 85.9 77.2 63.6 -24.2 55.2 84.0 64.3 58.8 79.0 68.0 66.3 77.2 65.8 Current ratio
1974-1976 㧙 140.6 158.0 260.2 㧙 㧙 164.0 141.4 㧙 㧙 㧙 㧙 141.3 㧙 㧙 131.8 1977-1979 134.4 112.4 65.6 538.3 㧙 107.8 186.3 139.2 㧙 㧙 㧙 㧙 210.7 㧙 㧙 134.5 1980-1982 195.1 115.1 100.5 348.9 㧙 92.4 179.2 115.3 㧙 291.9 㧙 㧙 248.0 㧙 㧙 147.3 1983-1985 116.7 51.0 199.4 998.1 㧙 181.8 168.1 186.7 㧙 430.1 㧙 㧙 330.6 㧙 㧙 177.6 1986-1988 111.5 65.8 176.5 289.8 㧙 182.4 147.5 245.8 㧙 297.2 㧙 㧙 189.5 㧙 㧙 181.7 1989-1991 129.0 75.7 227.0 326.9 㧙 128.9 129.3 160.3 㧙 233.5 㧙 㧙 194.6 㧙 㧙 174.1 1992-1994 165.4 93.8 272.8 417.9 㧙 169.9 103.4 138.7 㧙 229.9 㧙 㧙 219.1 㧙 㧙 186.1 1995-1997 168.0 268.3 192.8 311.5 㧙 208.8 110.5 175.9 㧙 229.9 㧙 㧙 250.7 㧙 255.4 220.9 1998-2000 185.3 520.6 489.9 328.2 㧙 386.6 45.3 116.0 㧙 286.5 271.2 㧙 323.9 268.2 384.3 227.9 2001-2003 299.9 735.1 242.1 455.6 534.8 434.8 47.4 79.9 418.4 332.4 302.3 223.4 298.3 594.0 534.8 251.1 2004-2006 1,314.6 1474.2 300.4 474.1 816.5 672.0 62.1 234.7 933.2 504.1 349.0 471.6 281.9 717.0 816.5 353.2
aAll cooperatives in Yamagata Prefecture.
Tabl e 9 Changes i n equi t y r at i o and cur r ent r at i o of f or est owner s ’ cooper at i ves i n Yamagat a Pr ef ect ur e
t i ons, among ot her s. As f or t he pr of i t and l oss of oper at i ng depar t ment s, t he paper di vi des t he depar t ment s i nt o ut i l i zat i on, sal es and t he ot her s ( consul t i ng, pur chasi ng, and f i nance) f or separ at e exami nat i ons. Over al l , t her e has been no change i n t he r evenue st r uct ur e i n each oper at i ng depar t ment ( Tabl e10) . However , t hese depar t ment s have di f f er ent r evenue st r uct ur es f r om each ot her . I n t he ut i l i zat i on depar t ment of f i scal 2005, t he mi ni mum val ue was 20. 6 per cent and t he maxi mum val ue was 94. 0 per cent . I n t he sal es depar t ment of t he same year , t he mi ni mum val ue was zer o per cent and t he maxi mum val ue was 70. 7 per cent .
The exami nat i on of t he pr of i t st r uct ur e based on t he dat a of t he t ot al busi ness pr of i t ( mar gi n pr of i t ) r eveal s t hat over al l t he r at i o of t he ut i l i zat i on depar t ment i s becomi ng l ar ger whi l e t hose of t he sal es and ot her depar t ment s ar e ei t her decr easi ng or st agnat i ng ( Tabl e11) . However , a cl oser l ook at each depar t ment can show t hat t he st at us of management var i es i n di f f er ent cooper at i ves, j ust as can be seen i n
r evenue st r uct ur es.
4. Concl us i on
Si nce t he end of Wor l d War
Ⅱ, f or est owner s
’cooper at i ves have f unct i oned as vi t al ent i t i es f or t he management of f or est s i n t hi s count r y.
These days, however , t hei r management envi r onment i s becomi ng i ncr easi ng sever e, as i s evi dent i n t he decr ease i n t hei r r evenues. One of t hei r pol i ci es t o sur vi ve t hr ough t hi s di f f i cul t y i s, f or exampl e, t he consol i dat i on of some cooper at i ves, whi ch has al r eady been at t empt ed. 5
)For est owner s
’cooper at i ves ar e now goi ng t hr ough t hei r t r ansi t i on per i od. I n or der t o deci de wher e f or est owner s
’cooper at i ves shoul d go and t o set t hem on a r i ght pat h, i t i s necessar y t o under st and t hei r management t r end. I n t hi s r espect , t he f i nanci al st at ement s dat a pr esent ed i n t hi s paper ar e t he most usef ul sour ce of i nf or mat i on t o know t he t r end. The dat a ar e al so essent i al basi c mat er i al s i n di scussi ng t he di r ect i on of t he devel opment of t he cooper at i ve. For exampl e, t he anal yses of
Unit:%
Utilization Sales Others
1975 1980 1985 1990 1995 2000 2005 1975 1980 1985 1990 1995 2000 2005 1975 1980 1985 1990 1995 2000 2005
TFOC 51.5 59.0 84.4 84.5 83.6 90.1 89.9 0.0 0.0 1.9 0.0 0.0 0.0 0.0 48.5 41.0 13.6 15.5 16.4 9.9 10.1
HFOC 34.2 35.2 63.2 69.0 72.2 72.0 70.3 53.7 56.4 22.5 20.9 21.4 22.2 19.6 12.1 8.4 14.4 10.0 6.4 5.8 10.1 YuFOC 15.2 26.7 34.6 42.6 83.8 77.4 94.0 39.4 34.0 34.5 24.1 4.3 7.3 0.3 45.3 39.3 30.8 33.3 11.9 15.2 5.7
SFOC 30.2 34.8 39.2 57.9 69.0 82.7 93.2 0.0 0.0 0.0 7.9 1.0 1.9 2.1 69.8 65.2 60.8 34.2 30.0 15.5 4.7
AkFOC 㧙 㧙 㧙 㧙 㧙 㧙 65.5 㧙 㧙 㧙 㧙 㧙 㧙 16.4 㧙 㧙 㧙 㧙 㧙 㧙 18.2
YaFOC 㧙 41.6 84.6 75.2 87.7 84.4 80.5 㧙 40.2 1.6 14.6 3.7 3.3 2.4 㧙 18.2 13.8 10.3 8.6 12.4 17.1
KaFOC 1.6 9.2 22.6 4.2 11.2 33.6 37.5 85.8 71.9 66.6 89.2 74.1 56.1 40.6 12.6 18.9 10.9 6.7 14.7 10.4 21.9 AtFOC 12.2 22.3 26.8 24.9 37.0 22.2 23.2 55.1 40.1 43.6 58.0 44.5 68.6 70.7 32.7 37.7 29.6 17.1 18.4 9.2 6.2
KiFOC 㧙 㧙 㧙 㧙 㧙 78.0 78.3 㧙 㧙 㧙 㧙 㧙 16.1 11.2 㧙 㧙 㧙 㧙 㧙 5.8 10.5
NmFOC 㧙 49.2 57.0 62.7 69.1 63.4 63.0 㧙 26.6 26.6 13.8 19.3 25.6 12.8 㧙 24.2 16.4 23.5 11.5 11.1 24.2
YoFOC 㧙 㧙 㧙 㧙 㧙 80.0 74.7 㧙 㧙 㧙 㧙 㧙 13.9 19.3 㧙 㧙 㧙 㧙 㧙 6.1 6.0
NoFOC 㧙 㧙 㧙 㧙 㧙 66.9 52.5 㧙 㧙 㧙 㧙 㧙 26.1 40.5 㧙 㧙 㧙 㧙 㧙 7.0 7.0
OFOC 60.6 60.2 40.5 31.7 30.5 25.7 20.6 21.4 26.9 39.3 52.0 50.8 54.4 61.4 17.9 12.9 20.1 16.3 18.7 19.9 18.1
DFOC 㧙 㧙 㧙 㧙 㧙 49.8 66.8 㧙 㧙 㧙 㧙 㧙 42.4 22.0 㧙 㧙 㧙 㧙 㧙 7.8 11.2
MFOC 㧙 㧙 㧙 㧙 53.6 41.9 47.2 㧙 㧙 㧙 㧙 38.4 52.3 46.4 㧙 㧙 㧙 㧙 8.0 5.8 6.4
Totala 32.0 39.3 51.9 48.2 56.4 54.1 54.2 40.0 38.9 29.4 37.0 32.0 36.7 34.2 28.0 21.8 18.6 14.8 11.6 9.2 11.6
aAll cooperatives in Yamagata Prefecture.
Tabl e 10 Changes i n t ot al busi ness ear ni ngs by oper at i onal depar t ment s of f or est owner s ’ cooper at i ves i n Yamagat a Pr ef ect ur e
Unit: %
Utilization Sales Others
1975 1980 1985 1990 1995 2000 2005 1975 1980 1985 1990 1995 2000 2005 1975 1980 1985 1990 1995 2000 2005
TFOC 46.4 30.5 67.2 95.6 81.1 92.3 94.0 0.0 0.0 2.2 0.0 0.0 0.0 0.0 53.6 69.5 30.6 4.4 18.9 7.7 6.0
HFOC 31.6 34.1 76.4 78.5 84.5 85.6 86.2 53.8 60.5 10.5 13.0 10.9 10.2 5.6 14.6 5.4 13.1 8.6 4.6 4.2 8.3
YuFOC 29.5 32.1 47.2 43.4 80.7 76.5 96.4 31.9 32.3 22.7 21.1 4.0 4.5 0.0 38.6 35.6 30.1 35.5 15.3 19.0 3.6 SFOC 26.6 24.7 36.6 68.7 80.7 92.9 100.3 0.0 0.0 0.0 10.0 1.9 3.6 2.7 73.4 75.3 63.4 21.3 17.3 3.5 - 3.0
AkFOC 㧙 㧙 㧙 㧙 㧙 㧙 58.8 㧙 㧙 㧙 㧙 㧙 㧙 6.8 㧙 㧙 㧙 㧙 㧙 㧙 34.4
YaFOC 㧙 37.6 87.3 81.6 94.0 94.2 89.7 㧙 43.8 1.1 18.4 3.8 0.9 1.7 㧙 18.6 11.6 0.0 2.3 4.9 8.6
KaFOC 9.1 27.1 25.2 22.6 16.7 55.9 49.3 57.2 44.4 66.8 73.6 66.7 37.5 19.8 33.7 28.5 8.0 3.9 16.6 6.6 30.9 AtFOC 25.4 45.7 36.8 41.4 45.1 36.1 65.1 42.2 2.8 34.8 38.0 39.9 53.9 21.9 32.4 51.5 28.4 20.6 15.0 10.0 13.0
KiFOC 㧙 㧙 㧙 㧙 㧙 93.6 95.1 㧙 㧙 㧙 㧙 㧙 7.5 5.4 㧙 㧙 㧙 㧙 㧙 - 1.1 - 0.5
NmFOC 㧙 64.7 65.4 70.9 76.5 71.9 68.2 㧙 18.1 16.1 13.0 17.0 22.5 12.8 㧙 17.2 18.4 16.1 6.5 5.6 19.0
YoFOC 㧙 㧙 㧙 㧙 㧙 94.4 91.7 㧙 㧙 㧙 㧙 㧙 4.0 5.9 㧙 㧙 㧙 㧙 㧙 1.6 2.4
NoFOC 㧙 㧙 㧙 㧙 㧙 94.7 65.3 㧙 㧙 㧙 㧙 㧙 2.6 31.3 㧙 㧙 㧙 㧙 㧙 2.7 3.4
OFOC 56.2 58.8 43.6 39.0 46.5 38.3 32.6 28.7 33.5 46.0 51.1 43.2 54.1 58.9 15.1 7.7 10.4 9.9 10.3 7.7 8.5
DFOC 㧙 㧙 㧙 㧙 㧙 46.2 69.7 㧙 㧙 㧙 㧙 㧙 43.4 18.1 㧙 㧙 㧙 㧙 㧙 10.4 12.2
MFOC 㧙 㧙 㧙 㧙 83.5 76.9 66.3 㧙 㧙 㧙 㧙 13.8 20.7 31.0 㧙 㧙 㧙 㧙 2.7 2.4 2.7
Total a 37.6 49.6 62.0 60.2 73.4 72.9 69.5 34.6 31.7 22.3 28.1 19.1 22.1 22.9 27.8 18.7 15.7 11.7 7.4 4.9 7.5
aAll cooperatives in Yamagata Prefecture.
Tabl e 11 Changes i n t ot al busi ness pr of i t by oper at i onal depar t ment s of f or est owner s ’ cooper at i ves i n
Yamagat a Pr ef ect ur e
t he dat a on t he f i nanci al st at ement s r eveal not onl y t he decl i ni ng r evenues. The anal yses al so enabl e us t o gr asp t he mor e det ai l ed pi ct ur es of t he management . They can di scl ose, f or exampl e, t hat decl i ni ng r evenue r at i os ar e accompanyi ng t hose decl i ni ng r evenues whi l e t he f i nanci al gr ounds ar e becomi ng st r onger .
Fur t her mor e, t hi s st udy has anot her mer i t . Al t hough not al l pr ef ect ur es publ i ci ze t he dat a on t he f i nanci al st at ement s of each f or est owner s
’cooper at i ve, t hey ar e easy t o obt ai n i f t hey ar e avai l abl e as bookl et s. I n t he f ut ur e, i t i s necessar y t o est abl i sh mor e uni f i ed anal yt i c met hods and col l ect i nf or mat i on t hr oughout t he nat i on f or f ul l - scal e exper i ment al st udi es usi ng l ar ge- scal e quant i t at i ve dat a.
Ref er ences
1)
M. Shi ga and M. Nar i t a: For est management i ssues i n Japan ( i n Japanese) ( Nat i onal Feder at i on of For est Owner s Co- oper at i ve Associ at i ons, Tokyo, 2000)
2)
S. Ogawa: The changes, and i t s subj ect s of
t he f or est pol i cy and t he management scal e st r uct ur e f or f or est owner s
’associ at i ons i n r ecent year s ( i n Japanese) . Jour nal of Co- oper at i ve St udi es 26- 3, pp. 71- 84 ( 2007)
3)M. Hayaj i r i and M. Yamamot o: Anal ysi s
st udy on management i n cooper at i ves usi ng f i nanci al i ndi cat or s: case st udy of f or est owner s
’cooper at i ve i n Tokachi r egi on, Hokkai do ( i n Japanese) . Bul l et i n of Yamagat a Uni ver si t y ( Engi neer i ng) 30, pp. 27- 38 ( 2009)
4)
M. Hayaj i r i and M. Yamamot o: Est i mat i ng t he ef f ect s of management i n t he amal gamat i on of f or est owner s
’cooper at i ves:
A case st udy of Yamagat a Pr ef ect ur e, Japan. Jour nal of co- oper at i ve st udi es, 28 - 3, ( 2009) ( i n pr ess)
5)