In 1992, the present author tried to find any strong associations between neurocranial and postcranial bone measurements using some limit- ed number of measurements (Mizoguchi, 1992) because we may be able to determine the causes and mechanism of brachycephalization, though indirectly, if there are such strong associations.
As a result, he found relatively strong associa- tions between one or more neurocranial measure- ments and a few measurements of the third lum- bar vertebra, pelvis, talus, etc. Since then, he has examined the associations between the three main neurocranial measurements, i.e., cranial length, cranial breadth and basi-bregamtic height, and the measurements thoroughly taken of each postcranial bone. Up to the present, this series of multivariate analyses have shown that cranial length is strongly associated with the sagittal and transverse diameters of the vertebral bodies, sacral breadths, costal chords, many humeral measurements, pelvic breadths and height, femoral lengths and thicknesses, and tibial lengths and thicknesses; that cranial breadth has no consistent association with any measurements of the vertebrae, ribs, sternum, scapula, clavicle,
or fibula; and that basi-bregmatic height is signif- icantly associated with the transverse diameters of the vertebral foramina of almost all the verte- brae (Mizoguchi, 1992, 1994, 1995, 1996, 1997, 1998a, b, 1999, 2000, 2001, 2002, 2003a, b, c).
In the present study, i.e., the final analysis of this series, the correlations between neurocranial and foot bone measurements are examined simi- larly toward solving the brachycephalization problem.
Materials and Methods
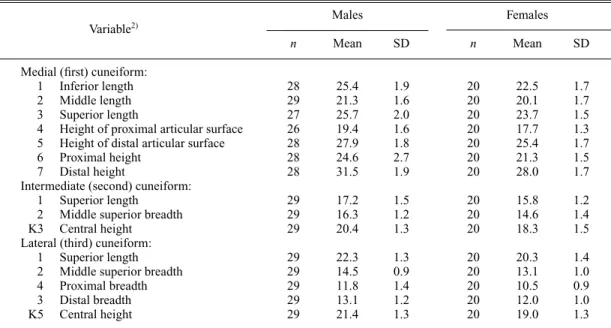
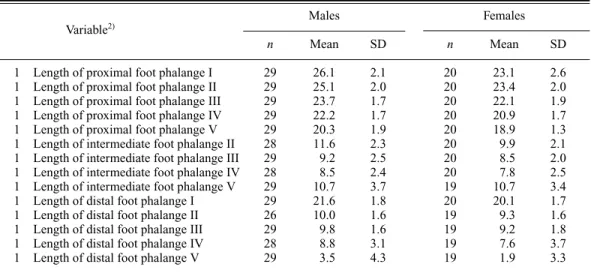
The data used here are the raw measurements of the neurocranium reported by Miyamoto (1924) and those of the talus, the calcaneus, the navicular bone, the cuboid bone, the medial (first), intermediate (second) and lateral (third) cuneiform bones, the first, second, third, fourth and fifth metatarsal bones, the first, second, third, fourth and fifth proximal foot phalanges, the sec- ond, third, fourth and fifth middle foot phalanges, and the first, second, third, fourth and fifth distal foot phalanges reported by Hirai and Tabata (1928). These are of the same skeletons of 30
Associations between the Neurocranium and the Foot Bones:
Toward the Solution of the Brachycephalization Problem
Yuji Mizoguchi
Department of Anthropology, National Science Museum 3–23–1 Hyakunincho, Shinjuku-ku, Tokyo, 169–0073 Japan
E-mail: mzgch@kahaku.go.jp
Abstract Aiming at clarifying the causes of brachycephalization in the end, the correlations be- tween neurocranial and foot bone measurements were examined using principal component analy- sis and Kaiser’s normal varimax rotation methods. The results show that, while neither cranial length nor breadth is consistently associated with any measurements of the foot bones, basi-breg- matic height is significantly associated with the size of the talus in both males and females and, only in females, also with the size of the other foot bones. Although it was tentatively suggested that a biomechanical factor relating to the balance in posture might be one of the causes for these associations, much more detailed analyses should be conducted in the future to solve this problem.
Key words : Neurocranium, Basi-bregmatic height, Foot bones, Talus, Posture
lived in the Kinai district. The basic statistics for three main neurocranial measurements, i.e., cra- nial length, cranial breadth and basi-bregmatic height, are presented in Mizoguchi (1994), and those for foot bone measurements are listed in Tables 1 to 7.
For examining the overall relations between the neurocranial and the foot bone measure- ments, principal component analysis (Lawley and Maxwell, 1963; Okuno et al., 1971, 1976;
Takeuchi and Yanai, 1972) was applied to the correlation matrices on them. The number of principal components was so determined that the cumulative proportion of the variances of the principal components exceeded 80%. The princi- pal components obtained in such a way were then transformed by Kaiser’s normal varimax rotation method (Asano, 1971; Okuno et al., 1971) into
different factors because these may reveal some other associations hidden behind the measure- ments dealt with.
The measurements of the talus and of the cal- caneus were, in practice, arbitrarily divided into two groups in carrying out the above multivariate analyses because of a statistical restriction on sample size and the number of variables, namely, because the number of individuals was too small, particularly in females, compared with the total number of variables to obtain the solutions. As for the other foot bones, such treatment was not made because the number of variables was small- er than the number of individuals observed.
The significance of factor loadings was tested by the bootstrap method (Efron, 1979a, b, 1982;
Diaconis and Efron, 1983; Mizoguchi, 1993). In order to estimate the bootstrap standard deviation
Table 1. Means and standard deviations for the measurements of the right talus in Japanese males and females.1) Males Females Variable2)
n Mean SD n Mean SD
1 Length 29 50.7 2.1 20 45.6 1.9
2 Breadth 29 40.2 2.4 20 35.9 2.3
3 Height 29 30.3 1.5 20 27.0 1.5
3(1) Medial height 29 31.9 1.8 20 28.1 1.9
K5 Lateral height 29 31.2 1.5 20 28.0 1.5
4 Length of trochlea 29 31.8 2.0 20 28.1 1.7
5 Middle breadth of trochlea 29 27.3 2.0 20 24.2 1.8
5(2) Anterior breadth of trochlea 29 27.9 1.9 20 24.4 1.8
5(1) Posterior breadth of trochlea 29 22.2 2.2 20 19.1 1.5
6 Height of trochlea 29 8.0 0.9 20 7.1 0.6
7 Total breadth of articular surface for lateral malleolus 29 22.8 2.2 20 22.4 1.8 7a Projective breadth of articular surface for lateral malleolus 29 8.3 1.6 20 8.0 1.4
8 Length of neck plus head 29 22.8 1.8 20 20.7 1.5
9 Length of head 29 32.2 1.6 20 28.0 1.8
10 Breadth of head 29 21.3 1.8 20 18.9 1.7
11 Height of head 29 13.6 1.8 20 11.9 1.3
12 Length of posterior calcaneal articular surface 29 30.4 1.7 20 27.2 1.8 13 Maximum breadth of posterior calcaneal articular surface 29 20.7 1.3 20 18.8 1.1 14 Depth of posterior calcaneal articular surface 29 7.2 1.0 20 5.9 0.6 15 Deflection angle of posterior calcaneal articular surface 29 45.8 4.4 20 45.8 4.7 K21 Deflection angle of post. calcaneal art. surf. after Adachi 29 51.1 5.0 20 51.5 5.0
16 Deflection angle of neck 29 20.3 3.3 20 19.0 4.0
K23 Deflection angle of neck after Adachi 29 17.4 6.4 20 14.2 7.1
17 Torsion angle of head 28 43.2 4.4 20 40.6 4.9
K25 Torsion angle of head after Volkov 29 38.4 5.6 20 38.1 5.8
1) The estimates of basic statistics listed here were recalculated by the present author on the basis of the raw data published by Hirai and Tabata (1928).
2) Bare-numbered variables are measurements according to Martin and Saller (1957), and those with the letter ‘K’
preceding the number are measurements according to Kiyono (1929).
Table 2. Means and standard deviations for the measurements of the right calcaneus in Japanese males and fe- males.1)
Males Females
Variable2)
n Mean SD n Mean SD
1 Maximum length 29 72.4 3.4 20 66.6 3.8
1a Physiological length 29 70.0 3.4 20 63.9 3.7
2 Middle breadth 29 40.7 2.4 20 36.3 2.6
3 Minimum breadth of body 29 26.2 2.1 20 23.1 2.0
4 Height 29 39.4 2.7 20 35.0 2.1
K6 Minimum height after Adachi 29 36.6 2.2 20 32.5 2.1
5 Length of body 29 53.0 2.5 20 48.8 3.6
6 Breadth of sustentaculum tali 29 13.3 1.9 20 11.2 1.3
7 Height of calcaneal tuber 25 44.1 2.8 20 39.2 2.4
8 Breadth of calcaneal tuber 29 30.5 1.9 20 26.3 2.2
9 Length of posterior articular surface 29 28.1 1.9 20 25.1 2.1
10 Breadth of posterior articular surface 29 20.9 1.8 20 18.6 1.3
11 Height of posterior articular surface 29 6.5 1.1 20 5.6 0.9
12 Maximum breadth of articular surface for cuboid 28 25.8 1.9 20 23.3 2.0
13 Height of articular surface for cuboid 28 20.5 1.9 20 18.7 2.1
14 Deflection angle of posterior articular surface 29 40.6 7.2 20 38.9 6.9
15 Talocalcaneal angle 29 5.3 7.7 20 6.9 5.9
1) The estimates of basic statistics listed here were recalculated by the present author on the basis of the raw data published by Hirai and Tabata (1928).
2) Bare-numbered variables are measurements according to Martin and Saller (1957), and those with the letter ‘K’
preceding the number are measurements according to Kiyono (1929).
Table 3. Means and standard deviations for the measurements of the right navicular bone in Japanese males and females.1)
Males Females
Variable2)
n Mean SD n Mean SD
1 Breadth 28 38.5 1.6 20 34.1 2.7
2 Height 28 28.4 2.2 20 25.9 2.7
3 Maximum length of posterior articular surface 28 27.7 1.6 20 24.6 1.5
4 Breadth of posterior articular surface 28 21.4 1.9 20 19.5 1.6
5 Depth of posterior articular surface 28 6.2 0.8 20 5.2 0.7
6 Maximum length of cuneiform facets 27 34.1 1.6 20 30.6 1.9
7 Minimum thickness 28 8.1 1.5 20 7.7 1.1
8 Maximum thickness 28 18.0 1.6 20 16.2 1.9
1) The estimates of basic statistics listed here were recalculated by the present author on the basis of the raw data published by Hirai and Tabata (1928).
2) Variable number according to Martin and Saller (1957).
Table 4. Means and standard deviations for the measurements of the right cuboid bone in Japanese males and fe- males.1)
Males Females
Variable2)
n Mean SD n Mean SD
1 Medial length 29 29.1 2.0 20 26.8 2.0
2 Lateral length 29 14.7 2.4 20 13.7 1.3
1) The estimates of basic statistics listed here were recalculated by the present author on the basis of the raw data published by Hirai and Tabata (1928).
Table 5. Means and standard deviations for the measurements of the right cuneiform bones in Japanese males and females.1)
Males Females Variable2)
n Mean SD n Mean SD
Medial (first) cuneiform:
1 Inferior length 28 25.4 1.9 20 22.5 1.7
2 Middle length 29 21.3 1.6 20 20.1 1.7
3 Superior length 27 25.7 2.0 20 23.7 1.5
4 Height of proximal articular surface 26 19.4 1.6 20 17.7 1.3
5 Height of distal articular surface 28 27.9 1.8 20 25.4 1.7
6 Proximal height 28 24.6 2.7 20 21.3 1.5
7 Distal height 28 31.5 1.9 20 28.0 1.7
Intermediate (second) cuneiform:
1 Superior length 29 17.2 1.5 20 15.8 1.2
2 Middle superior breadth 29 16.3 1.2 20 14.6 1.4
K3 Central height 29 20.4 1.3 20 18.3 1.5
Lateral (third) cuneiform:
1 Superior length 29 22.3 1.3 20 20.3 1.4
2 Middle superior breadth 29 14.5 0.9 20 13.1 1.0
4 Proximal breadth 29 11.8 1.4 20 10.5 0.9
3 Distal breadth 29 13.1 1.2 20 12.0 1.0
K5 Central height 29 21.4 1.3 20 19.0 1.3
1) The estimates of basic statistics listed here were recalculated by the present author on the basis of the raw data published by Hirai and Tabata (1928).
2) Bare-numbered variables are measurements according to Martin and Saller (1957), and those with the letter ‘K’
preceding the number are measurements according to Kiyono (1929).
Table 6. Means and standard deviations for the measurements of the right metatarsal bones in Japanese males and females.1)
Males Females Variable2)
n Mean SD n Mean SD
K2 Length of first metatarsal 29 54.7 2.7 20 51.7 2.6
K2 Length of second metatarsal 29 65.6 3.2 20 61.9 3.5
K2 Length of third metatarsal 29 63.4 3.4 20 59.8 3.6
K2 Length of fourth metatarsal 29 62.1 3.7 20 58.7 3.7
K2 Length of fifth metatarsal 29 59.0 3.2 20 55.7 3.3
11 Torsion angle of first metatarsal 29 2.4 5.4 20 2.4 4.2
11 Torsion angle of second metatarsal 28 5.2 5.1 20 3.6 3.7
11 Torsion angle of third metatarsal 29 16.1 4.8 20 18.5 4.2
11 Torsion angle of fourth metatarsal 29 15.6 5.7 20 21.4 4.2
11 Torsion angle of fifth metatarsal 29 10.3 5.5 20 10.8 6.8
1) The estimates of basic statistics listed here were recalculated by the present author on the basis of the raw data published by Hirai and Tabata (1928).
2) Bare-numbered variables are measurements according to Martin and Saller (1957), and those with the letter ‘K’
preceding the number are measurements according to Kiyono (1929).
of a factor loading, 1,000 bootstrap replications including the observed sample were used. The bootstrap standard deviation was estimated by di- rectly counting the cumulative frequency for the standard deviation in the bootstrap distribution.
The reality of a common factor such as repre- sented by a principal component or rotated factor was further tested, though indirectly, by evaluat- ing similarity between the factors obtained for males and females, i.e., by estimating a Spear- man’s rank correlation coefficient, rho (Siegel, 1956), between the variation patterns of the fac- tor loadings.
Statistical calculations were executed with the mainframe, HITACHI MP5800 System, of the Computer Centre, the University of Tokyo. The programs used are BSFMD for calculating basic statistics, BTPCA for principal component analy- sis and Kaiser’s normal varimax rotation, and RKCNCT for rank correlation coefficients. All of these programs were written in FORTRAN by the present author.
Results
analyses (PCAs) and the rotated solutions for the neurocranium and the talus are shown in Tables 8 to 11 and 13 to 16. And the degree of similarity, i.e., the Spearman’s rank correlation coefficients, between males and females in the variation pat- terns of factor loadings on the principal compo- nents (PCs) and/or rotated factors extracted are shown in Tables 12 and 17. Similarly, the results for the other foot bones are shown in Tables 18 to 47.
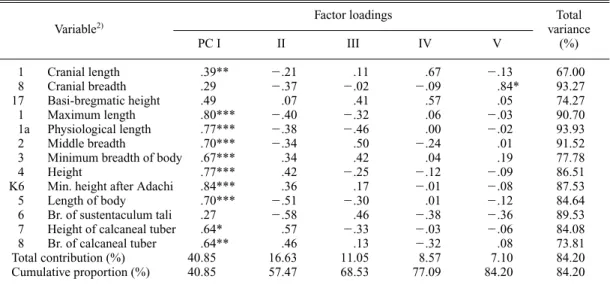
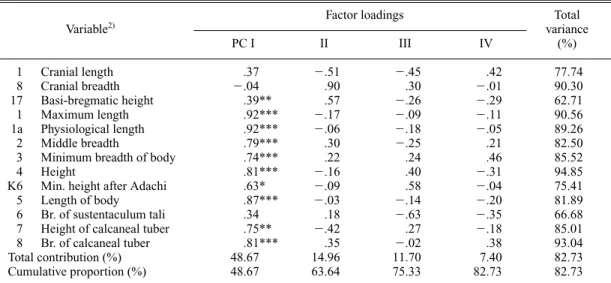
First of all, the PCAs and the rotated solutions for the talus show that there is no PC nor rotated factor common to males and females such as is significantly correlated with both cranial length or breadth and one or more talar measurements (Tables 8 to 11 and 13 to 16). However, PC I’s from the first data sets of both sexes were found to have significant correlations both with basi- bregmatic height and with many talar measure- ments (Tables 8, 10 and 12).
In the analyses for the calcaneus (Tables 18 to 21 and 23 to 26) , it was found that there was no PC nor rotated factor common to males and fe- males which was significantly correlated both with one or more cranial measurements and with
Table 7. Means and standard deviations for the measurements of the right foot phalanges in Japanese males and females.1)
Males Females Variable2)
n Mean SD n Mean SD
1 Length of proximal foot phalange I 29 26.1 2.1 20 23.1 2.6
1 Length of proximal foot phalange II 29 25.1 2.0 20 23.4 2.0
1 Length of proximal foot phalange III 29 23.7 1.7 20 22.1 1.9
1 Length of proximal foot phalange IV 29 22.2 1.7 20 20.9 1.7
1 Length of proximal foot phalange V 29 20.3 1.9 20 18.9 1.3
1 Length of intermediate foot phalange II 28 11.6 2.3 20 9.9 2.1
1 Length of intermediate foot phalange III 29 9.2 2.5 20 8.5 2.0
1 Length of intermediate foot phalange IV 28 8.5 2.4 20 7.8 2.5
1 Length of intermediate foot phalange V 29 10.7 3.7 19 10.7 3.4
1 Length of distal foot phalange I 29 21.6 1.8 20 20.1 1.7
1 Length of distal foot phalange II 26 10.0 1.6 19 9.3 1.6
1 Length of distal foot phalange III 29 9.8 1.6 19 9.2 1.8
1 Length of distal foot phalange IV 28 8.8 3.1 19 7.6 3.7
1 Length of distal foot phalange V 29 3.5 4.3 19 1.9 3.3
1) The estimates of basic statistics listed here were recalculated by the present author on the basis of the raw data published by Hirai and Tabata (1928).
2) Variable number according to Martin and Saller (1957).
Table 8. Principal component analysis of the correlation matrix on the first set of measurements of the neurocra- nium and the talus from Japanese males.1)
Factor loadings Total
Variable2) variance
PC I II III IV V (%)
1 Cranial length .30 .34 .28 .56 .51 85.26
8 Cranial breadth .31 .27 .51 .62 .26 88.55
17 Basi-bregmatic height .55* .21 .42 .43 .09 70.65
1 Length .92*** .07 .09 .06 .03 86.65
2 Breadth .87*** .10 .21 .08 .02 81.27
3 Height .79*** .37 .28 .03 .24 89.42
3(1) Medial height .75*** .40 .21 .02 .34 87.25
K5 Lateral height .86*** .30 .09 .04 .06 85.15
4 Length of trochlea .49* .63 .01 .09 .12 66.27
5 Middle br. of trochlea .76*** .56 .05 .09 .01 90.71
5(2) Ant. br. of trochlea .70*** .57 .07 .21 .13 87.90
5(1) Post. br. of trochlea .57*** .53 .21 .06 .13 67.03
6 Height of trochlea .16 .52 .60 .13 .27 75.09
7 T. br. of a. s. for l. m. .68** .51 .27 .14 .23 86.66
7a P. br. of a. s. for l. m. .45 .33 .63 .20 .39 89.22
Total contribution (%) 42.20 17.35 10.47 6.85 5.60 82.47
Cumulative proportion (%) 42.20 59.55 70.02 76.87 82.47 82.47
1) The sample size is 29. The number of the principal components shown here was so determined that the cumula- tive proportion of the variances of the principal components exceeded 80%.
2) See the second footnote to Table 1.
*P0.05; **P0.01; ***P0.001, by a two-tailed bootstrap test.
Table 9. Solution obtained through the normal varimax rotation of the first five principal components for the cor- relation matrix on the first set of measurements of the neurocranium and the talus from Japanese males.1)
Factor loadings Variable2)
Fac I II III IV V
1 Cranial length .03 .15 .08 .91* .04
8 Cranial breadth .10 .10 .93* .04 .07
17 Basi-bregmatic height .47 .28 .03 .58* .27
1 Length .61*** .59 .11 .22 .29
2 Breadth .51* .63 .16 .08 .35
3 Height .92* .12 .15 .05 .07
3(1) Medial height .92* .12 .06 .04 .05
K5 Lateral height .82* .24 .17 .10 .30
4 Length of trochlea .64 .21 .05 .09 .45
5 Middle br. of trochlea .24 .83 .33 .22 .06
5(2) Ant. br. of trochlea .17 .72 .51 .25 .07
5(1) Post. br. of trochlea .13 .79 .05 .15 .01
6 Height of trochlea .23 .76 .34 .11 .03
7 T. br. of a. s. for l. m. .59 .06 .13 .15 .69***
7a P. br. of a. s. for l. m. .15 .18 .01 .14 .90***
1) The sample size is 29. The cumulative proportion of the variances of the five principal components is 82.47%.
2) See the second footnote to Table 1.
*P0.05; **P0.01; ***P0.001, by a two-tailed bootstrap test.
Table 11. Solution obtained through the normal varimax rotation of the first five principal components for the correlation matrix on the first set of measurements of the neurocranium and the talus from Japanese females.1)
Factor loadings Variable2)
Fac I II III IV V
1 Cranial length .03 .34 .83 .02 .08
8 Cranial breadth .00 .12 .88 .05 .29
17 Basi-bregmatic height .10 .25 .16 .11 .90**
1 Length .25 .63 .03 .47 .33
2 Breadth .38 .80 .05 .25 .22
3 Height .32 .50* .29 .65*** .13
3(1) Medial height .21 .56* .26 .68** .08
K5 Lateral height .67 .45 .09 .50 .07
4 Length of trochlea .38 .33 .27 .66* .38
5 Middle br. of trochlea .03 .96 .06 .02 .04
5(2) Ant. br. of trochlea .03 .93 .04 .15 .21
5(1) Post. br. of trochlea .07 .80 .19 .20 .21
6 Height of trochlea .05 .01 .16 .89 .13
7 T. br. of a. s. for l. m. .80 .14 .13 .31 .11
7a P. br. of a. s. for l. m. .85*** .12 .04 .11 .02
1) The sample size is 20. The cumulative proportion of the variances of the five principal components is 85.64%.
2) See the second footnote to Table 1.
Table 10. Principal component analysis of the correlation matrix on the first set of measurements of the neurocra- nium and the talus from Japanese females.1)
Factor loadings Total
Variable2) variance
PC I II III IV V (%)
1 Cranial length .20 .68 .50 .01 .23 80.95
8 Cranial breadth .25 .51 .71 .21 .07 86.53
17 Basi-bregmatic height .50** .11 .32 .37 .65* 92.43
1 Length .88*** .08 .00 .01 .15 79.51
2 Breadth .90*** .12 .00 .22 .09 88.75
3 Height .81*** .25 .02 .26 .29 87.35
3(1) Medial height .84*** .16 .09 .32 .22 89.45
K5 Lateral height .85*** .29 .29 .05 .11 90.52
4 Length of trochlea .83*** .39 .06 .10 .20 90.35
5 Middle br. of trochlea .69* .56 .16 .13 .30 92.19
5(2) Ant. br. of trochlea .81*** .46 .18 .15 .07 92.58
5(1) Post. br. of trochlea .70*** .52 .11 .02 .05 76.68
6 Height of trochlea .46 .15 .13 .68 .35 83.21
7 T. br. of a. s. for l. m. .57 .34 .56 .18 .04 78.58
7a P. br. of a. s. for l. m. .17 .48 .52 .47 .12 75.50
Total contribution (%) 45.96 14.93 10.82 7.75 6.18 85.64
Cumulative proportion (%) 45.96 60.89 71.71 79.46 85.64 85.64
1) The sample size is 20. The number of the principal components shown here was so determined that the cumula- tive proportion of the variances of the principal components exceeded 80%.
2) See the second footnote to Table 1.
*P0.05; **P0.01; ***P0.001, by a two-tailed bootstrap test.
Table 12. Spearman’s rank correlation coefficients between males and females in the variation pattern of factor loadings on the principal components and/or rotated factors obtained from the first data sets of neurocranial and talar measurements.1)
Male PC I II III IV V Fac I II III IV V
Female PC I .85*** — — — .67** .72** — — — —
II — .65** — — — — .67** — .74** —
III — — — — — — — — — .63*
IV — — — — — — — — — —
V — — — — — — — — .54* —
Fac I — — — — — .52* — — — .85***
II .67** .58* — — .51* — .77*** — — —
III — — — — — — — — .61* —
IV — .71** — — — .73** — — — —
V — — — — — — — — — —
1) Only those rank correlation coefficients significant at the 5% level are listed here. The signs of rank correlation coefficients are removed because the signs of factor loadings are reversible. The original factor loadings are listed in Ta- bles 8, 9, 10 and 11.
*P0.05; **P0.01; ***P0.001, by a two-tailed test.
Table 13. Principal component analysis of the correlation matrix on the second set of measurements of the neuro- cranium and the talus from Japanese males.1)
Factor loadings3) Total
Variable2) variance
PC I II III IV V VI VII (%)
1 Cranial length .24 .49 .51 .10 .23 .21 .14 68.73
8 Cranial breadth .15 .60 .06 .32 .07 .33 .27 66.72
17 Basi-bregmatic height .56 .11 .36 .30 .20 .14 .48 82.93
8 Length of neck plus head .81 .03 .22 .02 .08 .02 .30 79.78
9 Length of head .76 .26 .20 .21 .02 .04 .09 73.86
10 Breadth of head .65 .15 .18 .27 .21 .16 .42 79.86
11 Height of head .56 .14 .29 .57 .04 .38 -.09 89.73
12 Len. of post. cal. a. s. .69 .21 .18 .31 .00 .39 .18 83.30
13 Max. br. of p. c. a. s. .50 .65 .04 .19 .20 .24 .11 82.60
14 Depth of p. c. a. s. .70 .30 .05 .44 .01 .37 .06 91.70
15 Def. ang. of p. c. a. s. .34 .72 .09 .07 .49 .12 .09 90.62
K21 Def. ang. of p. c. a. s. after Adachi .31 .79 .02 .04 .46 .11 .17 97.55
16 Def. ang. of neck .37 .31 .42 .34 .47 .34 .16 87.95
K23 Def. ang. of neck after Adachi .40 .29 .43 .62 .07 .08 .17 85.17
17 Tor. ang. of head .34 .41 .68 .10 .33 .06 .03 87.73
K25 Tor. ang. of head after Volkov .25 .30 .68 .00 .43 .07 .15 82.62
Total contribution (%) 26.58 17.93 12.06 9.30 7.21 5.31 4.80 83.18
Cumulative proportion (%) 26.58 44.51 56.56 65.86 73.07 78.38 83.18 83.18
1) The sample size is 28. The number of the principal components shown here was so determined that the cumula- tive proportion of the variances of the principal components exceeded 80%.
2) See the second footnote to Table 1.
3) No significant factor loading was found at the 5% level by two-tailed bootstrap tests.
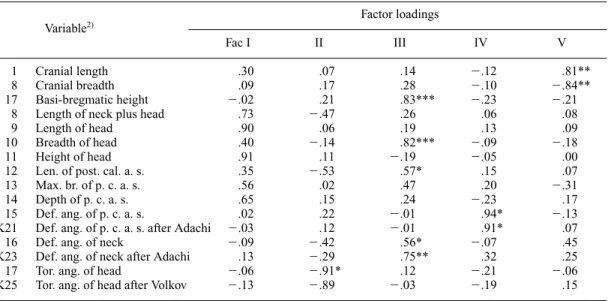
Table 14. Solution obtained through the normal varimax rotation of the first seven principal components for the correlation matrix on the second set of measurements of the neurocranium and the talus from Japanese males.1)
Factor loadings Variable2)
Fac I II III IV V VI VII
1 Cranial length .11 .67*** .19 .33 .04 .10 .28
8 Cranial breadth .06 .77*** .11 .06 .19 .15 .06
17 Basi-bregmatic height .09 .21 .20 .07 .14 .16 .83***
8 Length of neck plus head .58 .11 .02 .34 .05 .35 .46
9 Length of head .63 .20 .25 .14 .02 .41 .25
10 Breadth of head .76 .21 .12 .17 .01 .28 .23
11 Height of head .90* .01 .19 .05 .04 .11 .16
12 Len. of post. cal. a. s. .22 .11 .02 .20 .03 .85***.12
13 Max. br. of p. c. a. s. .19 .34 .15 .16 .24 .61* .44
14 Depth of p. c. a. s. .61 .50* .22 .08 .26 .40 .12
15 Def. ang. of p. c. a. s. .05 .11 .12 .07 .93*** .01 .11
K21 Def. ang. of p. c. a. s. after Adachi .07 .15 .11 .11 .96*** .00 .00
16 Def. ang. of neck .18 .09 .08 .91** .04 .03 .10
K23 Def. ang. of neck after Adachi .10 .02 .06 .70 .31 .50* .05
17 Tor. ang. of head .02 .02 .89 .09 .19 .04 .21
K25 Tor. ang. of head after Volkov .02 .01 .91 .03 .05 .03 .01
1) The sample size is 28. The cumulative proportion of the variances of the seven principal components is 83.18%.
2) See the second footnote to Table 1.
*P0.05; **P0.01; ***P0.001, by a two-tailed bootstrap test.
Table 15. Principal component analysis of the correlation matrix on the second set of measurements of the neuro- cranium and the talus from Japanese females.1)
Factor loadings Total
Variable2) variance
PC I II III IV V (%)
1 Cranial length .34 .09 .62 .10 .51 78.66
8 Cranial breadth .12 .34 .70 .39 .26 83.47
17 Basi-bregmatic height .47 .05 .61 .22 .44 83.39
8 Length of neck plus head .82** .01 .26 .03 .31 83.36
9 Length of head .71 .49 .36 .07 .11 87.98
10 Breadth of head .85** .05 .39 .12 .10 89.42
11 Height of head .44 .50 .53 .31 .27 88.44
12 Len. of post. cal. a. s. .79*** .22 .10 .25 .13 76.12
13 Max. br. of p. c. a. s. .64* .42 .23 .02 .15 66.29
14 Depth of p. c. a. s. .56 .25 .29 .31 .16 58.08
15 Def. ang. of p. c. a. s. .09 .59 .15 .73* .17 95.01
K21 Def. ang. of p. c. a. s. after Adachi .08 .43 .03 .80* .09 83.99
16 Def. ang. of neck .50 .54 .02 .26 .32 70.56
K23 Def. ang. of neck after Adachi .70* .13 .20 .48 .22 82.29
17 Tor. ang. of head .33 .76 .08 .02 .43 88.94
K25 Tor. ang. of head after Volkov .20 .82 .11 .10 .36 86.40
Total contribution (%) 29.25 18.71 13.07 12.30 8.08 81.40
Cumulative proportion (%) 29.25 47.96 61.02 73.32 81.40 81.40
1) The sample size is 20. The number of the principal components shown here was so determined that the cumula- tive proportion of the variances of the principal components exceeded 80%.
2) See the second footnote to Table 1.
Table 16. Solution obtained through the normal varimax rotation of the first five principal components for the correlation matrix on the second set of measurements of the neurocranium and the talus from Japanese fe- males.1)
Factor loadings Variable2)
Fac I II III IV V
1 Cranial length .30 .07 .14 .12 .81**
8 Cranial breadth .09 .17 .28 .10 .84**
17 Basi-bregmatic height .02 .21 .83*** .23 .21
8 Length of neck plus head .73 .47 .26 .06 .08
9 Length of head .90 .06 .19 .13 .09
10 Breadth of head .40 .14 .82*** .09 .18
11 Height of head .91 .11 .19 .05 .00
12 Len. of post. cal. a. s. .35 .53 .57* .15 .07
13 Max. br. of p. c. a. s. .56 .02 .47 .20 .31
14 Depth of p. c. a. s. .65 .15 .24 .23 .17
15 Def. ang. of p. c. a. s. .02 .22 .01 .94* .13
K21 Def. ang. of p. c. a. s. after Adachi .03 .12 .01 .91* .07
16 Def. ang. of neck .09 .42 .56* .07 .45
K23 Def. ang. of neck after Adachi .13 .29 .75** .32 .25
17 Tor. ang. of head .06 .91* .12 .21 .06
K25 Tor. ang. of head after Volkov .13 .89 .03 .19 .15
1) The sample size is 20. The cumulative proportion of the variances of the five principal components is 81.40%.
2) See the second footnote to Table 1.
*P0.05; **P0.01; ***P0.001, by a two-tailed bootstrap test.
Table 17. Spearman’s rank correlation coefficients between males and females in the variation pattern of factor loadings on the principal components and/or rotated factors obtained from the second data sets of neurocranial and talar measurements.1)
Male PC I II III IV V VI VII Fac I II III IV V VI VII
Female PC I .87*** — — — — — — .63** — — — — .69** —
II — .69** — .52* — — — — — .57* .53* .52* — —
III — — — — — — — — — — — — — —
IV — — — — .61* — — .61* — — — — — —
V — — — — — — — — — — — — — —
Fac I .71** — — — .51* — — .76*** — — — — — —
II — .55* — — — — — — — — — — — —
III — — — .54* — — — — — — .51* — .60* —
IV — .59* — — — — — — — .67** — .51* — —
V — — — — — — — — — — — — — —
1) Only those rank correlation coefficients significant at the 5% level are listed here. The signs of rank correlation coefficients are removed because the signs of factor loadings are reversible. The original factor loadings are listed in Ta- bles 13, 14, 15 and 16.
*P0.05; **P0.01; ***P0.001, by a two-tailed test.
Table 18. Principal component analysis of the correlation matrix on the first set of measurements of the neurocra- nium and the calcaneus from Japanese males.1)
Factor loadings Total
Variable2) variance
PC I II III IV V (%)
1 Cranial length .39** .21 .11 .67 .13 67.00
8 Cranial breadth .29 .37 .02 .09 .84* 93.27
17 Basi-bregmatic height .49 .07 .41 .57 .05 74.27
1 Maximum length .80*** .40 .32 .06 .03 90.70
1a Physiological length .77*** .38 .46 .00 .02 93.93
2 Middle breadth .70*** .34 .50 .24 .01 91.52
3 Minimum breadth of body .67*** .34 .42 .04 .19 77.78
4 Height .77*** .42 .25 .12 .09 86.51
K6 Min. height after Adachi .84*** .36 .17 .01 .08 87.53
5 Length of body .70*** .51 .30 .01 .12 84.64
6 Br. of sustentaculum tali .27 .58 .46 .38 .36 89.53
7 Height of calcaneal tuber .64* .57 .33 .03 .06 84.08
8 Br. of calcaneal tuber .64** .46 .13 .32 .08 73.81
Total contribution (%) 40.85 16.63 11.05 8.57 7.10 84.20
Cumulative proportion (%) 40.85 57.47 68.53 77.09 84.20 84.20
1) The sample size is 25. The number of the principal components shown here was so determined that the cumula- tive proportion of the variances of the principal components exceeded 80%.
2) See the second footnote to Table 2.
*P0.05; **P0.01; *** P0.001, by a two-tailed bootstrap test.
Table 19. Solution obtained through the normal varimax rotation of the first five principal components for the correlation matrix on the first set of measurements of the neurocranium and the calcaneus from Japanese males.1)
Factor loadings Variable2)
Fac I II III IV V
1 Cranial length .05 .32 .01 .75 .07
8 Cranial breadth .01 .24 .04 .02 .93*
17 Basi-bregmatic height .27 .02 .09 .81 .09
1 Maximum length .23 .88 .16 .19 .15
1a Physiological length .24 .92 .08 .07 .14
2 Middle breadth .34* .26 .78 .24 .27
3 Minimum breadth of body .71 .07 .22 .41 .23
4 Height .83* .40 .09 .02 .08
K6 Min. height after Adachi .83* .22 .18 .32 .02
5 Length of body .11 .86 .25 .14 .08
6 Br. of sustentaculum tali .10 .20 .92 .02 .08
7 Height of calcaneal tuber .81 .29 .29 .02 .13
8 Br. of calcaneal tuber .84 .03 .15 .04 .10
1) The sample size is 25. The cumulative proportion of the variances of the five principal components is 84.20%.
2) See the second footnote to Table 2.
Table 20. Principal component analysis of the correlation matrix on the first set of measurements of the neurocra- nium and the calcaneus from Japanese females.1)
Factor loadings Total
Variable2) variance
PC I II III IV (%)
1 Cranial length .37 .51 .45 .42 77.74
8 Cranial breadth .04 .90 .30 .01 90.30
17 Basi-bregmatic height .39** .57 .26 .29 62.71
1 Maximum length .92*** .17 .09 .11 90.56
1a Physiological length .92*** .06 .18 .05 89.26
2 Middle breadth .79*** .30 .25 .21 82.50
3 Minimum breadth of body .74*** .22 .24 .46 85.52
4 Height .81*** .16 .40 .31 94.85
K6 Min. height after Adachi .63* .09 .58 .04 75.41
5 Length of body .87*** .03 .14 .20 81.89
6 Br. of sustentaculum tali .34 .18 .63 .35 66.68
7 Height of calcaneal tuber .75** .42 .27 .18 85.01
8 Br. of calcaneal tuber .81*** .35 .02 .38 93.04
Total contribution (%) 48.67 14.96 11.70 7.40 82.73
Cumulative proportion (%) 48.67 63.64 75.33 82.73 82.73
1) The sample size is 20. The number of the principal components shown here was so determined that the cumula- tive proportion of the variances of the principal components exceeded 80%.
2) See the second footnote to Table 2.
*P0.05; **P0.01; ***P0.001, by a two-tailed bootstrap test.
Table 21. Solution obtained through the normal varimax rotation of the first four principal components for the correlation matrix on the first set of measurements of the neurocranium and the calcaneus from Japanese fe- males.1)
Factor loadings Variable2)
Fac I II III IV
1 Cranial length .03 .82 .08 .32
8 Cranial breadth .17 .88 .07 .31
17 Basi-bregmatic height .07 .35 .66 .25
1 Maximum length .70 .30 .41 .40
1a Physiological length .59 .26 .48 .49
2 Middle breadth .25 .07 .46 .74*
3 Minimum breadth of body .38 .04 .06 .84**
4 Height .95* .04 .13 .19
K6 Min. height after Adachi .78 .13 .19 .30
5 Length of body .63 .16 .51 .37
6 Br. of sustentaculum tali .00 .12 .81 .03
7 Height of calcaneal tuber .87* .27 .04 .15
8 Br. of calcaneal tuber .29 .03 .24 .89**
1) The sample size is 20. The cumulative proportion of the variances of the four principal components is 82.73%.
2) See the second footnote to Table 2.
*P0.05; **P0.01; ***P0.001, by a two-tailed bootstrap test.
Table 22. Spearman’s rank correlation coefficients between males and females in the variation pattern of factor loadings on the principal components and/or rotated factors obtained from the first data sets of neurocranial and calcaneal measurements.1)
Male PC I II III IV V Fac I II III IV V
Female PC I .71** — .56* — — — .64* — — —
II — — — — .68* — .60* — — .62*
III — .57* — — — .64* — — — —
IV — — — — — — — — — —
Fac I .80*** — — — — .62* — — — —
II — — — — — — .60* — — —
III — .64* — — — — — — — —
IV — — — — — — — — — .71**
1) Only those rank correlation coefficients significant at the 5% level are listed here. The signs of rank correlation coefficients are removed because the signs of factor loadings are reversible. The original factor loadings are listed in Ta- bles 18, 19, 20 and 21.
*P0.05; **P0.01; ***P0.001, by a two-tailed test.
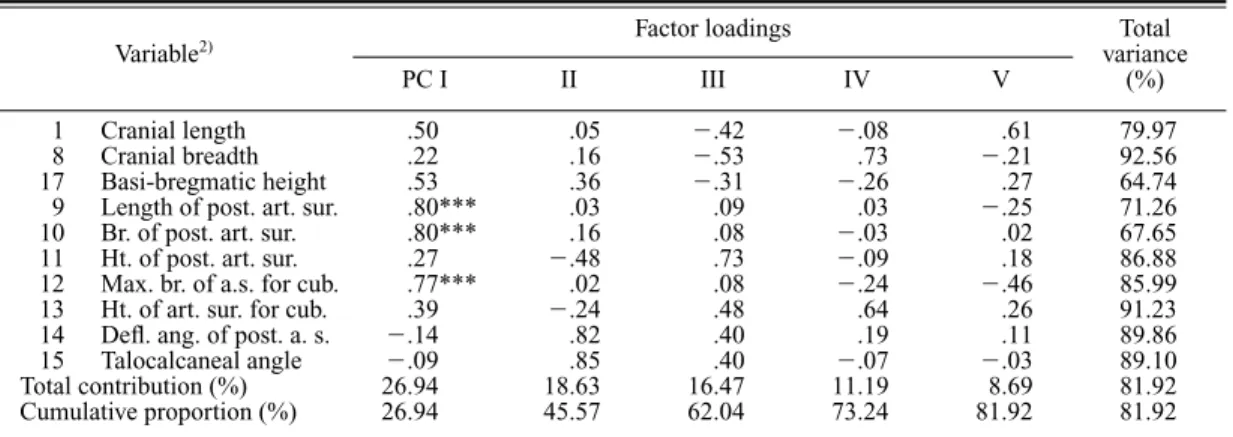
Table 23. Principal component analysis of the correlation matrix on the second set of measurements of the neuro- cranium and the calcaneus from Japanese males.1)
Factor loadings Total
Variable2) variance
PC I II III IV V (%)
1 Cranial length .50 .05 .42 .08 .61 79.97
8 Cranial breadth .22 .16 .53 .73 .21 92.56
17 Basi-bregmatic height .53 .36 .31 .26 .27 64.74
9 Length of post. art. sur. .80*** .03 .09 .03 .25 71.26
10 Br. of post. art. sur. .80*** .16 .08 .03 .02 67.65
11 Ht. of post. art. sur. .27 .48 .73 .09 .18 86.88
12 Max. br. of a.s. for cub. .77*** .02 .08 .24 .46 85.99
13 Ht. of art. sur. for cub. .39 .24 .48 .64 .26 91.23
14 Defl. ang. of post. a. s. .14 .82 .40 .19 .11 89.86
15 Talocalcaneal angle .09 .85 .40 .07 .03 89.10
Total contribution (%) 26.94 18.63 16.47 11.19 8.69 81.92
Cumulative proportion (%) 26.94 45.57 62.04 73.24 81.92 81.92
1) The sample size is 28. The number of the principal components shown here was so determined that the cumula- tive proportion of the variances of the principal components exceeded 80%.
2) See the second footnote to Table 2.
*P0.05; **P0.01; ***P0.001, by a two-tailed bootstrap test.
Table 24. Solution obtained through the normal varimax rotation of the first five principal components for the correlation matrix on the second set of measurements of the neurocranium and the calcaneus from Japanese males.1)
Factor loadings Variable2)
Fac I II III IV V
1 Cranial length .06 .15 .07 .08 .87
8 Cranial breadth .11 .06 .10 .95* .06
17 Basi-bregmatic height .33 .13 .19 .04 .69
9 Length of post. art. sur. .80 .03 .20 .10 .14
10 Br. of post. art. sur. .68 .10 .22 .02 .39
11 Ht. of post. art. sur. .21 .14 .63 .62 .13
12 Max. br. of a.s. for cub. .92* .07 .06 .06 .03
13 Ht. of art. sur. for cub. .13 .02 .94* .10 .00
14 Defl. ang. of post. a. s. .09 .94 .08 .07 .01
15 Talocalcaneal angle .07 .93 .12 .08 .03
1) The sample size is 28. The cumulative proportion of the variances of the five principal components is 81.92%.
2) See the second footnote to Table 2.
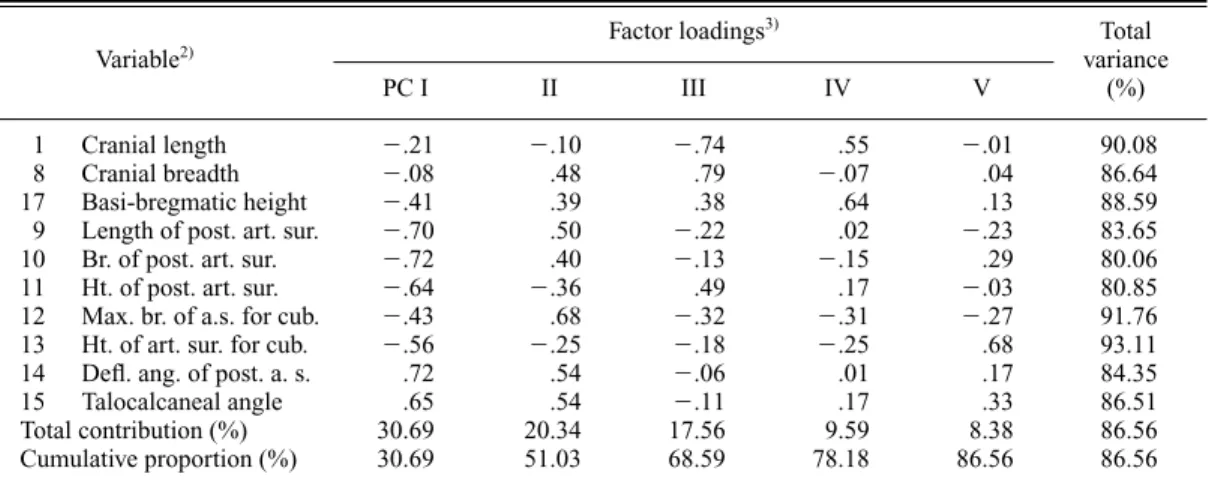
Table 25. Principal component analysis of the correlation matrix on the second set of measurements of the neuro- cranium and the calcaneus from Japanese females.1)
Factor loadings3) Total
Variable2) variance
PC I II III IV V (%)
1 Cranial length .21 .10 .74 .55 .01 90.08
8 Cranial breadth .08 .48 .79 .07 .04 86.64
17 Basi-bregmatic height .41 .39 .38 .64 .13 88.59
9 Length of post. art. sur. .70 .50 .22 .02 .23 83.65
10 Br. of post. art. sur. .72 .40 .13 .15 .29 80.06
11 Ht. of post. art. sur. .64 .36 .49 .17 .03 80.85
12 Max. br. of a.s. for cub. .43 .68 .32 .31 .27 91.76
13 Ht. of art. sur. for cub. .56 .25 .18 .25 .68 93.11
14 Defl. ang. of post. a. s. .72 .54 .06 .01 .17 84.35
15 Talocalcaneal angle .65 .54 .11 .17 .33 86.51
Total contribution (%) 30.69 20.34 17.56 9.59 8.38 86.56
Cumulative proportion (%) 30.69 51.03 68.59 78.18 86.56 86.56
1) The sample size is 20. The number of the principal components shown here was so determined that the cumula- tive proportion of the variances of the principal components exceeded 80%.
2) See the second footnote to Table 2.
3) No significant factor loading was found at the 5% level by two-tailed bootstrap tests.
Table 26. Solution obtained through the normal varimax rotation of the first five principal components for the correlation matrix on the second set of measurements of the neurocranium and the calcaneus from Japanese females.1)
Factor loadings Variable2)
Fac I II III IV V
1 Cranial length .00 .14 .93 .15 .04
8 Cranial breadth .06 .13 .79 .46 .07
17 Basi-bregmatic height .05 .16 .04 .92 .01
9 Length of post. art. sur. .19 .85 .12 .25 .05
10 Br. of post. art. sur. .11 .65 .03 .24 .55
11 Ht. of post. art. sur. .77 .08 .17 .40 .16
12 Max. br. of a.s. for cub. .09 .95* .03 .07 .00
13 Ht. of art. sur. for cub. .24 .05 .10 .04 .93
14 Defl. ang. of post. a. s. .88 .07 .15 .03 .19
15 Talocalcaneal angle .91 .10 .02 .14 .06
1) The sample size is 20. The cumulative proportion of the variances of the five principal components is 86.56%.
2) See the second footnote to Table 2.
*P0.05; **P0.01; ***P0.001, by a two-tailed bootstrap test.
Table 27. Spearman’s rank correlation coefficients between males and females in the variation pattern of factor loadings on the principal components and/or rotated factors obtained from the second data sets of neurocranial and calcaneal measurements.1)
Male PC I II III IV V Fac I II III IV V
Female PC I .81** — — — — .77** — — — —
II — — — — .76* — — — — —
III — — — — — — — — — —
IV — — — — — — — — — —
V — — — — — — .67* — — —
Fac I — .72* — — — — — .73* — —
II .87** — — — — .75* — — — .68*
III — — — — — — — — — —
IV — — — — — — — — — —
V — — — — — — — .66* — —
1) Only those rank correlation coefficients significant at the 5% level are listed here. The signs of rank correlation coefficients are removed because the signs of factor loadings are reversible. The original factor loadings are listed in Ta- bles 23, 24, 25 and 26.
*P0.05; **P0.01; ***P0.001, by a two-tailed test.
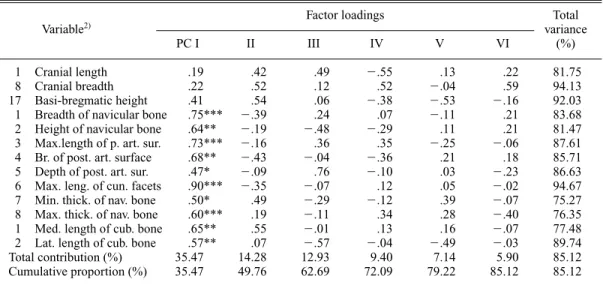
Table 28. Principal component analysis of the correlation matrix on the set of measurements of the neurocranium and the navicular and cuboid bones from Japanese males.1)
Factor loadings Total
Variable2) variance
PC I II III IV V VI (%)
1 Cranial length .19 .42 .49 .55 .13 .22 81.75
8 Cranial breadth .22 .52 .12 .52 .04 .59 94.13
17 Basi-bregmatic height .41 .54 .06 .38 .53 .16 92.03
1 Breadth of navicular bone .75*** .39 .24 .07 .11 .21 83.68
2 Height of navicular bone .64** .19 .48 .29 .11 .21 81.47
3 Max.length of p. art. sur. .73*** .16 .36 .35 .25 .06 87.61
4 Br. of post. art. surface .68** .43 .04 .36 .21 .18 85.71
5 Depth of post. art. sur. .47* .09 .76 .10 .03 .23 86.63
6 Max. leng. of cun. facets .90*** .35 .07 .12 .05 .02 94.67
7 Min. thick. of nav. bone .50* .49 .29 .12 .39 .07 75.27
8 Max. thick. of nav. bone .60*** .19 .11 .34 .28 .40 76.35
1 Med. length of cub. bone .65** .55 .01 .13 .16 .07 77.48
2 Lat. length of cub. bone .57** .07 .57 .04 .49 .03 89.74
Total contribution (%) 35.47 14.28 12.93 9.40 7.14 5.90 85.12
Cumulative proportion (%) 35.47 49.76 62.69 72.09 79.22 85.12 85.12
1) The sample size is 27. The number of the principal components shown here was so determined that the cumula- tive proportion of the variances of the principal components exceeded 80%.
2) See the second footnotes to Tables 3 and 4.
*P0.05; **P0.01; ***P0.001, by a two-tailed bootstrap test.
Table 29. Solution obtained through the normal varimax rotation of the first six principal components for the cor- relation matrix on the set of measurements of the neurocranium and the navicular and cuboid bones from Japanese males.1)
Factor loadings Variable2)
Fac I II III IV V VI
1 Cranial length .04 .07 .04 .89 .09 .09
8 Cranial breadth .09 .19 .09 .07 .03 .94**
17 Basi-bregmatic height .13 .18 .05 .39 .85** .00
1 Breadth of navicular bone .71 .02 .55** .02 .05 .15
2 Height of navicular bone .02 .23 .85*** .05 .20 .01
3 Max.length of p. art. sur. .87 .16 .15 .09 .17 .19
4 Br. of post. art. surface .32 .07 .83*** .17 .05 .15
5 Depth of post. art. sur. .78* .11 .04 .46 .05 .17
6 Max. leng. of cun. facets .61 .32 .65* .18 .09 .01
7 Min. thick. of nav. bone .16 .76 .28 .20 .14 .10
8 Max. thick. of nav. bone .33 .78*** .08 .19 .03 .01
1 Med. length of cub. bone .20 .73 .10 .19 .25 .30
2 Lat. length of cub. bone .04 .19 .44 .34 .74* .08
1) The sample size is 27. The cumulative proportion of the variances of the six principal components is 85.12%.
2) See the second footnotes to Tables 3 and 4.
*P0.05; **P0.01; ***P0.001, by a two-tailed bootstrap test.
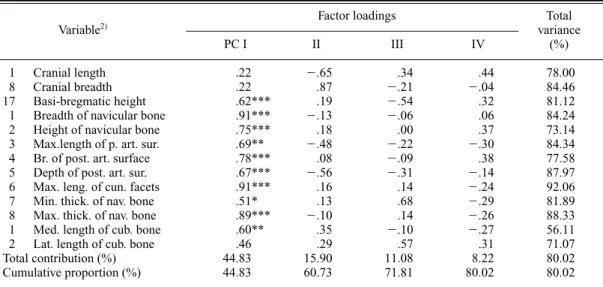
Table 30. Principal component analysis of the correlation matrix on the set of measurements of the neurocranium and the navicular and cuboid bones from Japanese females.1)
Factor loadings Total
Variable2) variance
PC I II III IV (%)
1 Cranial length .22 .65 .34 .44 78.00
8 Cranial breadth .22 .87 .21 .04 84.46
17 Basi-bregmatic height .62*** .19 .54 .32 81.12
1 Breadth of navicular bone .91*** .13 .06 .06 84.24
2 Height of navicular bone .75*** .18 .00 .37 73.14
3 Max.length of p. art. sur. .69** .48 .22 .30 84.34
4 Br. of post. art. surface .78*** .08 .09 .38 77.58
5 Depth of post. art. sur. .67*** .56 .31 .14 87.97
6 Max. leng. of cun. facets .91*** .16 .14 .24 92.06
7 Min. thick. of nav. bone .51* .13 .68 .29 81.89
8 Max. thick. of nav. bone .89*** .10 .14 .26 88.33
1 Med. length of cub. bone .60** .35 .10 .27 56.11
2 Lat. length of cub. bone .46 .29 .57 .31 71.07
Total contribution (%) 44.83 15.90 11.08 8.22 80.02
Cumulative proportion (%) 44.83 60.73 71.81 80.02 80.02
1) The sample size is 20. The number of the principal components shown here was so determined that the cumula- tive proportion of the variances of the principal components exceeded 80%.
2) See the second footnotes to Tables 3 and 4.
*P0.05; **P0.01; ***P0.001, by a two-tailed bootstrap test.
Table 31. Solution obtained through the normal varimax rotation of the first four principal components for the correlation matrix on the set of measurements of the neurocranium and the navicular and cuboid bones from Japanese females.1)
Factor loadings Variable2)
Fac I II III IV
1 Cranial length .20 .83 .16 .13
8 Cranial breadth .36 .81 .14 .21
17 Basi-bregmatic height .79* .25 .17 .31
1 Breadth of navicular bone .58 .03 .33 .63
2 Height of navicular bone .76* .03 .33 .21
3 Max.length of p. art. sur. .15 .11 .06 .90***
4 Br. of post. art. surface .79 .02 .24 .29
5 Depth of post. art. sur. .26 .22 .07 .87***
6 Max. leng. of cun. facets .39 .26 .61 .58
7 Min. thick. of nav. bone .04 .03 .88 .20
8 Max. thick. of nav. bone .30 .06 .54 .70*
1 Med. length of cub. bone .29 .49 .32 .37
2 Lat. length of cub. bone .41 .08 .71 .18
1) The sample size is 20. The cumulative proportion of the variances of the four principal components is 80.02%.
2) See the second footnotes to Tables 3 and 4.
*P0.05; **P0.01; ***P0.001, by a two-tailed bootstrap test.
Table 32. Spearman’s rank correlation coefficients between males and females in the variation pattern of factor loadings on the principal components and/or rotated factors obtained from the sets of measurements of the neurocranium and the navicular and cuboid bones.1)
Male PC I II III IV V VI Fac I II III IV V VI
Female PC I .81*** .71** — — — — .59* — .56* — — —
II — — — — — — — — — — — —
III — — .59* — — — — — — — — —
IV — — — .71** — — — — — — — —
Fac I — — — — — — — — — — — —
II — — — — — — — .62* — — — —
III — — .75** — — — — — .59* — — —
IV — — — — — — .87*** — — — — —
1) Only those rank correlation coefficients significant at the 5% level are listed here. The signs of rank correlation coefficients are removed because the signs of factor loadings are reversible. The original factor loadings are listed in Ta- bles 28, 29, 30 and 31.
*P0.05; **P0.01; ***P0.001, by a two-tailed test.
Table 33. Principal component analysis of the correlation matrix on the set of measurements of the neurocranium and the medial (C1), intermediate (C2) and lateral (C3) cuneiform bones from Japanese males.1)
Factor loadings Total
Variable2) variance
PC I II III IV V VI (%)
1 Cranial length .27 .33 .05 .71 .36 .02 80.91
8 Cranial breadth .32 .17 .21 .36 .46 .40 68.09
17 Basi-bregmatic height .38 .40 .03 .53 .51 .07 85.63
1 Inferior length (C1) .82*** .18 .08 .05 .05 .21 76.06
2 Middle length (C1) .87*** .10 .10 .12 .10 .17 82.81
3 Superior length (C1) .73*** .20 .31 .30 .23 .37 94.04
4 Ht. of prox. a. s. (C1) .17 .93** .12 .04 .04 .05 90.39
5 Ht. of dist. a. s. (C1) .78*** .16 .02 .08 .12 .47 86.85
6 Proximal height (C1) .42 .77* .09 .20 .23 .02 86.90
7 Distal height (C1) .87*** .16 .02 .04 .09 .24 85.15
1 Superior length (C2) .86*** .30 .15 .10 .14 .05 88.41
2 Middle sup. br. (C2) .78*** .42 .13 .00 .04 .17 82.72
K3 Central height (C2) .78*** .13 .37 .03 .11 .14 78.42
1 Superior length (C3) .69*** .05 .43 .02 .22 .02 70.97
2 Middle sup. br. (C3) .58*** .20 .44 .13 .34 .28 77.98
4 Proximal breadth (C3) .31 .44 .57 .31 .35 .17 86.81
3 Distal breadth (C3) .39 .30 .58 .36 .29 .21 83.36
K5 Central height (C3) .81*** .08 .29 .08 .05 .07 76.07
Total contribution (%) 41.68 13.83 8.22 7.37 6.40 4.81 82.31
Cumulative proportion (%) 41.68 55.51 63.73 71.10 77.50 82.31 82.31
1) The sample size is 26. The number of the principal components shown here was so determined that the cumula- tive proportion of the variances of the principal components exceeded 80%.
2) See the second footnote to Table 5.
*P0.05; **P0.01; ***P0.001, by a two-tailed bootstrap test.
Table 34. Solution obtained through the normal varimax rotation of the first six principal components for the cor- relation matrix on the set of measurements of the neurocranium and the medial (C1), intermediate (C2) and lateral (C3) cuneiform bones from Japanese males.1)
Factor loadings Variable2)
Fac I II III IV V VI
1 Cranial length .02 .38 .04 .80 .14 .00
8 Cranial breadth .13 .20 .02 .04 .78 .09
17 Basi-bregmatic height .30 .32 .06 .81** .05 .05
1 Inferior length (C1) .71* .07 .30 .16 .36 .01
2 Middle length (C1) .76** .00 .39 .00 .31 .02
3 Superior length (C1) .79 .10 .25 .04 .03 .50*
4 Ht. of prox. a. s. (C1) .04 .91* .21 .02 .00 .18
5 Ht. of dist. a. s. (C1) .68 .34 .28 .02 .11 .45
6 Proximal height (C1) .21 .86 .08 .07 .26 .10
7 Distal height (C1) .75** .33 .27 .14 .07 .28
1 Superior length (C2) .91** .11 .13 .02 .18 .04
2 Middle sup. br. (C2) .83** .23 .11 .19 .03 .17
K3 Central height (C2) .78* .33 .10 .20 .13 .04
1 Superior length (C3) .80* .19 .16 .04 .10 .00
2 Middle sup. br. (C3) .25 .09 .78* .16 .20 .15
4 Proximal breadth (C3) .17 .40 .16 .10 .44 .67***
3 Distal breadth (C3) .08 .17 .85 .07 .16 .21
K5 Central height (C3) .58* .12 .58 .10 .23 .10
1) The sample size is 26. The cumulative proportion of the variances of the six principal components is 82.31%.
2) See the second footnote to Table 5.
*P0.05; **P0.01; ***P0.001, by a two-tailed bootstrap test.
Table 35. Principal component analysis of the correlation matrix on the set of measurements of the neurocranium and the medial (C1), intermediate (C2) and lateral (C3) cuneiform bones from Japanese females.1)
Factor loadings Total
Variable2) variance
PC I II III IV (%)
1 Cranial length .13 .83 .09 .41 88.86
8 Cranial breadth .23 .77 .22 .11 71.50
17 Basi-bregmatic height .62*** .36 .08 .42 68.69
1 Inferior length (C1) .87*** .18 .23 .19 87.75
2 Middle length (C1) .77*** .33 .23 .28 84.28
3 Superior length (C1) .77** .21 .33 .36 86.84
4 Ht. of prox. a. s. (C1) .54** .10 .67 .34 86.75
5 Ht. of dist. a. s. (C1) .89*** .03 .06 .11 80.10
6 Proximal height (C1) .63*** .04 .62 .19 81.17
7 Distal height (C1) .89*** .22 .04 .01 84.92
1 Superior length (C2) .90*** .32 .11 .11 93.60
2 Middle sup. br. (C2) .80*** .35 .12 .12 80.06
K3 Central height (C2) .86*** .01 .34 .09 86.15
1 Superior length (C3) .83*** .06 .14 .26 78.51
2 Middle sup. br. (C3) .77*** .36 .25 .05 77.80
4 Proximal breadth (C3) .70*** .25 .11 .38 71.75
3 Distal breadth (C3) .73*** .19 .05 .13 58.76
K5 Central height (C3) .87*** .05 .25 .18 86.03
Total contribution (%) 55.13 11.82 7.89 5.92 80.75
Cumulative proportion (%) 55.13 66.94 74.83 80.75 80.75
1) The sample size is 20. The number of the principal components shown here was so determined that the cumula- tive proportion of the variances of the principal components exceeded 80%.
2) See the second footnote to Table 5.
*P0.05; **P0.01; ***P0.001, by a two-tailed bootstrap test.
Table 36. Solution obtained through the normal varimax rotation of the first four principal components for the correlation matrix on the set of measurements of the neurocranium and the medial (C1), intermediate (C2) and lateral (C3) cuneiform bones from Japanese females.1)
Factor loadings Variable2)
Fac I II III IV
1 Cranial length .17 .92 .04 .09
8 Cranial breadth .03 .78 .03 .33
17 Basi-bregmatic height .08 .13 .18 .79
1 Inferior length (C1) .85* .00 .19 .34
2 Middle length (C1) .88* .09 .19 .17
3 Superior length (C1) .91* .07 .13 .15
4 Ht. of prox. a. s. (C1) .17 .10 .90 .12
5 Ht. of dist. a. s. (C1) .67* .11 .33 .48
6 Proximal height (C1) .24 .07 .83 .24
7 Distal height (C1) .56 .23 .33 .62
1 Superior length (C2) .74* .27 .20 .53
2 Middle sup. br. (C2) .78* .21 .24 .29
K3 Central height (C2) .39 .08 .59 .59
1 Superior length (C3) .55 .11 .11 .68
2 Middle sup. br. (C3) .54 .41 .11 .56
4 Proximal breadth (C3) .28 .10 .06 .79
3 Distal breadth (C3) .35 .13 .28 .61
K5 Central height (C3) .38 .06 .49 .68
1) The sample size is 20. The cumulative proportion of the variances of the four principal components is 80.75%.
2) See the second footnote to Table 5.
Table 37. Spearman’s rank correlation coefficients between males and females in the variation pattern of factor loadings on the principal components and/or rotated factors obtained from the sets of measurements of the neurocranium and the cuneiform bones.1)
Male PC I II III IV V VI Fac I II III IV V VI
Female PC I .88*** — — — — — .74*** — — — — —
II — — .52* — — — .49* — — — — —
III — — — — — .47* — .54* — — — —
IV — — — — — — — — — — — —
Fac I .80*** — — .56* — — .78*** — — — — —
II — — .55* — — — — — — — — —
III — — — — — — — — — — — —
IV — — — — — — — — — — — —
1) Only those rank correlation coefficients significant at the 5% level are listed here. The signs of rank correlation coefficients are removed because the signs of factor loadings are reversible. The original factor loadings are listed in Ta- bles 33, 34, 35 and 36.
*P0.05; **P0.01; ***P0.001, by a two-tailed test.
Table 38. Principal component analysis of the correlation matrix on the set of measurements of the neurocranium and the metatarsal bones from Japanese males.1)
Factor loadings Total
Variable2) variance
PC I II III IV V (%)
1 Cranial length .36 .66 .16 .35 .13 72.88
8 Cranial breadth .29 .20 .43 .50 .43 73.29
17 Basi-bregmatic height .43 .31 .16 .46 .09 52.93
K2 Length of 1st metatarsal .87*** .12 .08 .15 .07 81.00
K2 Length of 2nd metatarsal .89*** .10 .21 .17 .17 91.18
K2 Length of 3rd metatarsal .95*** .06 .17 .11 .04 94.76
K2 Length of 4th metatarsal .93*** .00 .16 .10 .06 89.82
K2 Length of 5th metatarsal .91*** .00 .06 .15 .12 87.60
11 Torsion angle of 1st met. .30 .36 .32 .48 .65 97.46
11 Torsion angle of 2nd met. .23 .07 .83 .15 .20 80.39
11 Torsion angle of 3rd met. .67*** .08 .46 .19 .12 71.89
11 Torsion angle of 4th met. .50 .67* .32 .28 .05 87.74
11 Torsion angle of 5th met. .01 .86*** .09 .10 .33 85.74
Total contribution (%) 41.52 14.69 11.15 8.19 6.49 82.05
Cumulative proportion (%) 41.52 56.22 67.37 75.56 82.05 82.05
1) The sample size is 28. The number of the principal components shown here was so determined that the cumula- tive proportion of the variances of the principal components exceeded 80%.
2) See the second footnote to Table 6.
*P0.05; **P0.01; ***P0.001, by a two-tailed bootstrap test.
Table 39. Solution obtained through the normal varimax rotation of the first five principal components for the correlation matrix on the set of measurements of the neurocranium and the metatarsal bones from Japanese males.1)
Factor loadings Variable2)
Fac I II III IV V
1 Cranial length .13 .72 .28 .25 .23
8 Cranial breadth .15 .08 .09 .83 .04
17 Basi-bregmatic height .27 .45* .12 .49 .04
K2 Length of 1st metatarsal .86*** .15 .13 .07 .14
K2 Length of 2nd metatarsal .95*** .03 .06 .08 .02
K2 Length of 3rd metatarsal .94*** .00 .12 .19 .07
K2 Length of 4th metatarsal .92*** .07 .12 .17 .08
K2 Length of 5th metatarsal .91*** .06 .18 .06 .08
11 Torsion angle of 1st met. .17 .08 .08 .07 .96*
11 Torsion angle of 2nd met. .01 .15 .84 .27 .06
11 Torsion angle of 3rd met. .43 .00 .67 .20 .20
11 Torsion angle of 4th met. .34 .49 .64 .25 .22
11 Torsion angle of 5th met. .02 .89 .15 .20 .06
1) The sample size is 28. The cumulative proportion of the variances of the five principal components is 82.05%.
2) See the second footnote to Table 6.
*P0.05; **P0.01; ***P0.001, by a two-tailed bootstrap test.
Table 40. Principal component analysis of the correlation matrix on the set of measurements of the neurocranium and the metatarsal bones from Japanese females.1)
Factor loadings Total
Variable2) variance
PC I II III IV (%)
1 Cranial length .08 .72 .02 .31 61.64
8 Cranial breadth .33 .65 .02 .56 84.90
17 Basi-bregmatic height .60*** .21 .41 .21 61.48
K2 Length of 1st metatarsal .91*** .06 .20 .19 90.06
K2 Length of 2nd metatarsal .96*** .03 .03 .11 94.48
K2 Length of 3rd metatarsal .98*** .06 .03 .07 97.02
K2 Length of 4th metatarsal .97*** .12 .06 .00 96.48
K2 Length of 5th metatarsal .94*** .17 .03 .09 91.26
11 Torsion angle of 1st met. .00 .36 .83 .07 82.39
11 Torsion angle of 2nd met. .34 .60 .29 .43 73.56
11 Torsion angle of 3rd met. .26 .61 .36 .47 79.99
11 Torsion angle of 4th met. .07 .71 .53 .24 84.62
11 Torsion angle of 5th met. .35 .39 .03 .57 60.71
Total contribution (%) 40.88 19.70 10.78 10.07 81.43
Cumulative proportion (%) 40.88 60.58 71.36 81.43 81.43
1) The sample size is 20. The number of the principal components shown here was so determined that the cumula- tive proportion of the variances of the principal components exceeded 80%.
2) See the second footnote to Table 6.
Table 41. Solution obtained through the normal varimax rotation of the first four principal components for the correlation matrix on the set of measurements of the neurocranium and the metatarsal bones from Japanese fe- males.1)
Factor loadings Variable2)
Fac I II III IV
1 Cranial length .16 .72 .22 .13
8 Cranial breadth .27 .86 .19 .06
17 Basi-bregmatic height .59** .25 .45 .06
K2 Length of 1st metatarsal .88*** .04 .20 .28
K2 Length of 2nd metatarsal .95*** .02 .03 .19
K2 Length of 3rd metatarsal .98*** .07 .01 .03
K2 Length of 4th metatarsal .98*** .02 .02 .05
K2 Length of 5th metatarsal .95*** .01 .03 .04
11 Torsion angle of 1st met. .02 .07 .90 .08
11 Torsion angle of 2nd met. .43* .12 .47 .56
11 Torsion angle of 3rd met. .12 .29 .14 .82
11 Torsion angle of 4th met. .04 .81 .30 .31
11 Torsion angle of 5th met. .26 .01 .17 .71
1) The sample size is 20. The cumulative proportion of the variances of the four principal components is 81.43%.
2) See the second footnote to Table 6.
*P0.05; **P0.01; ***P0.001, by a two-tailed bootstrap test.
Table 42. Spearman’s rank correlation coefficients between males and females in the variation pattern of factor loadings on the principal components and/or rotated factors obtained from the sets of measurements of the neurocranium and the metatarsal bones.1)
Male PC I II III IV V Fac I II III IV V
Female PC I .84*** — — — — .83*** — .55* — —
II — — .87*** — — — — .63* — —
III — — — .57* — — — — .73** —
IV — — — — — — — — — —
Fac I .91*** — — — — .87*** — .69** — —
II — — .81*** — — — — .65* — .62*
III — .74** .58* — — — .64* — .71** .68*
IV — — .68* — — — — — — —
1) Only those rank correlation coefficients significant at the 5% level are listed here. The signs of rank correlation coefficients are removed because the signs of factor loadings are reversible. The original factor loadings are listed in Ta- bles 38, 39, 40 and 41.
*P0.05; **P0.01; ***P0.001, by a two-tailed test.
Table 43. Principal component analysis of the correlation matrix on the set of measurements of the neurocranium and the foot phalanges from Japanese males.1)
Factor loadings Total
Variable2) variance
PC I II III IV V (%)
1 Cranial length .35 .06 .32 .57 .51 81.11
8 Cranial breadth .23 .22 .56 .17 .17 47.64
17 Basi-bregmatic height .26 .38 .35 .55 .28 72.50
1 Length of prox. f. ph. I .86*** .09 .02 .03 .05 75.92
1 Length of prox. f. ph. II .90*** .07 .15 .12 .22 89.84
1 Length of prox. f. ph. III .91*** .04 .18 .06 .11 87.84
1 Length of prox. f. ph. IV .85*** .08 .27 .05 .31 89.69
1 Length of prox. f. ph. V .83*** .14 .17 .03 .28 81.77
1 Length of int. f. ph. II .84*** .05 .32 .08 .06 82.67
1 Length of int. f. ph. III .82*** .24 .18 .09 .08 76.67
1 Length of int. f. ph. IV .15 .43 .46 .60 .33 87.92
1 Length of int. f. ph. V .26 .82 .33 .02 .13 86.96
1 Length of dist. f. ph. I .74*** .31 .08 .26 .18 75.63
1 Length of dist. f. ph. II .33 .67 .18 .28 .40 82.78
1 Length of dist. f. ph. III .56** .46 .09 .26 .51* 86.33
1 Length of dist. f. ph. IV .66*** .40 .49 .23 .06 89.26
1 Length of dist. f. ph. V .53* .63 .34 .26 .20 90.81
Total contribution (%) 42.30 14.51 9.20 8.17 7.31 81.49
Cumulative proportion (%) 42.30 56.81 66.01 74.19 81.49 81.49
1) The sample size is 25. The number of the principal components shown here was so determined that the cumula- tive proportion of the variances of the principal components exceeded 80%.
2) See the second footnote to Table 7.
*P0.05; **P0.01; ***P0.001, by a two-tailed bootstrap test.
Table 44. Solution obtained through the normal varimax rotation of the first five principal components for the correlation matrix on the set of measurements of the neurocranium and the foot phalanges from Japanese males.1)
Factor loadings Variable2)
Fac I II III IV V
1 Cranial length .15 .04 .06 .85 .25
8 Cranial breadth .32 .07 .59 .09 .12
17 Basi-bregmatic height .14 .16 .12 .80 .17
1 Length of prox. f. ph. I .77** .33 .02 .16 .16
1 Length of prox. f. ph. II .91*** .17 .05 .21 .03
1 Length of prox. f. ph. III .87*** .19 .09 .23 .15
1 Length of prox. f. ph. IV .93*** .02 .12 .12 .06
1 Length of prox. f. ph. V .89*** .00 .06 .03 .15
1 Length of int. f. ph. II .67* .48 .29 .12 .24
1 Length of int. f. ph. III .63* .57 .02 .09 .20
1 Length of int. f. ph. IV .02 .35 .84 .01 .23
1 Length of int. f. ph. V .04 .87 .06 .11 .29
1 Length of dist. f. ph. I .74** .06 .06 .23 .38
1 Length of dist. f. ph. II .18 .27 .06 .02 .85***
1 Length of dist. f. ph. III .28 .12 .09 .06 .87**
1 Length of dist. f. ph. IV .53* .15 .66 .06 .39
1 Length of dist. f. ph. V .26 .91 .11 .01 .04
1) The sample size is 25. The cumulative proportion of the variances of the five principal components is 81.49%.
2) See the second footnote to Table 7.
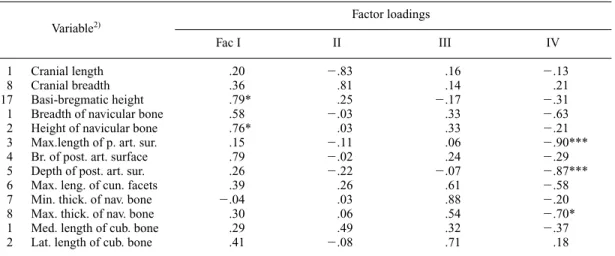
Table 45. Principal component analysis of the correlation matrix on the set of measurements of the neurocranium and the foot phalanges from Japanese females.1)
Factor loadings Total
Variable2) variance
PC I II III IV V (%)
1 Cranial length .03 .01 .83 .15 .40 86.89
8 Cranial breadth .13 .34 .81 .15 .06 82.55
17 Basi-bregmatic height .32 .67 .05 .16 .30 66.43
1 Length of prox. f. ph. I .60* .30 .09 .04 .65 87.20
1 Length of prox. f. ph. II .91*** .13 .03 .05 .13 86.60
1 Length of prox. f. ph. III .93*** .21 .12 .01 .00 93.00
1 Length of prox. f. ph. IV .93*** .19 .07 .01 .03 91.01
1 Length of prox. f. ph. V .92*** .27 .11 .08 .03 93.29
1 Length of int. f. ph. II .69*** .38 .33 .03 .22 77.76
1 Length of int. f. ph. III .67*** .53 .30 .12 .04 83.51
1 Length of int. f. ph. IV .08 .18 .10 .95* .02 94.21
1 Length of int. f. ph. V .00 .75 .51 .03 .34 94.65
1 Length of dist. f. ph. I .81*** .08 .10 .08 .08 69.05
1 Length of dist. f. ph. II .79*** .22 .08 .19 .22 76.15
1 Length of dist. f. ph. III .82*** .17 .19 .32 .06 84.16
1 Length of dist. f. ph. IV .74** .21 .13 .48 .25 91.09
1 Length of dist. f. ph. V .37 .74 .44 .12 .25 95.73
Total contribution (%) 43.87 14.84 12.46 8.15 6.17 85.49
Cumulative proportion (%) 43.87 58.71 71.17 79.32 85.49 85.49
1) The sample size is 18. The number of the principal components shown here was so determined that the cumula- tive proportion of the variances of the principal components exceeded 80%.
2) See the second footnote to Table 7.
*P0.05; **P0.01; ***P0.001, by a two-tailed bootstrap test.
Table 46. Solution obtained through the normal varimax rotation of the first five principal components for the correlation matrix on the set of measurements of the neurocranium and the foot phalanges from Japanese fe- males.1)
Factor loadings Variable2)
Fac I II III IV V
1 Cranial length .06 .15 .88 .01 .25
8 Cranial breadth .24 .09 .83 .01 .25
17 Basi-bregmatic height .50* .35 .17 .09 .50
1 Length of prox. f. ph. I .41 .08 .13 .04 .82
1 Length of prox. f. ph. II .88*** .03 .06 .15 .26
1 Length of prox. f. ph. III .94*** .09 .10 .11 .14
1 Length of prox. f. ph. IV .93*** .01 .07 .08 .16
1 Length of prox. f. ph. V .93*** .06 .15 .15 .10
1 Length of int. f. ph. II .51 .15 .38 .22 .55
1 Length of int. f. ph. III .50 .41 .50 .11 .40
1 Length of int. f. ph. IV .06 .01 .05 .97 .05
1 Length of int. f. ph. V .14 .95 .14 .05 .00
1 Length of dist. f. ph. I .77** .17 .19 .07 .17
1 Length of dist. f. ph. II .86 .08 .00 .11 .10
1 Length of dist. f. ph. III .87 .12 .09 .24 .08
1 Length of dist. f. ph. IV .63 .26 .19 .64 .03
1 Length of dist. f. ph. V .22* .93 .06 .01 .18
1) The sample size is 18. The cumulative proportion of the variances of the five principal components is 85.49%.
2) See the second footnote to Table 7.
*P0.05; **P0.01; ***P0.001, by a two-tailed bootstrap test.