Developing Forest Type Classification Methodology using High Resolution Satellite Image based on Tasseled Cap Transformation
Sungjae Kim, Yunwon Jo, Myunghee Jo Abstract
Recently there are many pilot studies for advanced application of first Korea national high resolution satellite image, which is called as KOMPSAT-MSC(Korean Multi-purpose Satellite-Multi-Spectral Camera), in Korea. In this study the forest type classification methodology is developed and its distribution map was constructed by applying high resolution satellite image, QuickBird-2, based on Tasseled Cap Transformation, especially through comparing the result of detailed filed surveying such as forest type, tree species, tree diameter, tree age and tree crown density in pilot study area.
Key words: QuickBird-2, Tasseled Cap Transformation, Forest type 1. Introduction
Recently the domestic technologies to manage forest area and to control all related information were developed very rapidly by integrating FGIS (Forest Geographic Information System), RS(Remote Sensing) and IT (Information technology).
As you know, the forest area is considered as the difficult area to access and do the detailed examination because its huge area size and its topographical thorny path in Korea. However, forest, itself, is regarded as the very important national resources so that the scientific way to monitor and extract the detailed information of forest area should be enhanced more and more.
Especially, the forest environment in Korea has been very often changed by some reasons such as nation land development policies or forest disasters so that the forest officials have to understand and monitor the very periodically by using satellite images.
In cases of the advanced forest nations such as Canada, U.S.A, Japan, there are their own certain way to extract the status of forest species, forest type, location, tree species, vegetation and forest pest distribution by using high 33 Buho-ri, Hayang-up, Kyungsan-si, Kyungsan bukdo, 712-701, Korea
Doctor course of Dept. of Satellite Geoinformatics Eng., Kyungil University
+82-53-857-7312,(Tel) +82-53-857-7313(Fax) [email protected] Http://geosat.kiu.ac.kr
satellite images and so that their forest resource could be managed in very scientific.
In Korea KOMPSAT-MSC, which is the first Korean high resolution satellite image data, has been considered as the very useful spatial data to manage the national resources such as water, agriculture and forest.
In related to studies, M. H. Jo(2005) had studied developing satellite images based forest mapping methodology and S. H. Lee(2003) had studied detecting forest pest area by using digital aerial photos and satellite images.
In this study the satellite images, QuickBird-2, based forest type classification distribution map was constructed by applying Tasseled Cap Transformation algorithm also its distribution map was compared and examined by field surveying factors the forest species, forest type, tree diameter, tree age and tree crown density.
FIGURE1. Study area
2. Study material and method s 2.1 Satellite images data processing
In this study QuickBird satellite image data was used to interpret farm classification when it was taken on 16 February 2004. For the image preprocessing, the geometric correction using GCP (Ground Control Point) correction and differential rectification using DEM (Digital Elevation Model) were used to correct the topographical distortion. The Nearest Neighbor Method interpolation method was used for 0.6m*0.6m pixel resampling.
FIGURE 2. Study flow diagram
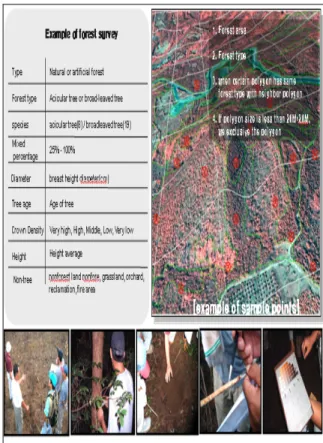
2.2 Field Surveying
In order to inspect the result from satellite images, the filed forest surveying data was sued expect national forest in pilot study area. In addition, the sample points distribution map based on 1/5,000 scale map was first constructed.
While constructing ample point’s distribution map, there were some considerations such as ID of sample points, its longitude and latitudes and rectangular coordinates information. Also, there were some GIS data to help the interpretation of image data such as road, administration boundary, main figures. Finally three are sample 36 sample points at least 20m×20m size per point as shown in figure 2. For further additional filed data the static GPS surveying data was performed by using Laica SR510.
FIGURE 2. Field Surveying method and its contents
3. The extraction of forestry characteristic using Tasseled-Cap Transformation
Tasseled-Cap is the method to acquire the certain information through amplifying the optical information also the reflection characteristic of vegetation on each season (Kauth and Thomas (1976))
Although the constant value of Tasseled-cap transformation can be altered depending on its purpose and its value can be acquired through filed survey, it is difficult to gain the exact constant value actually.
Tasseled-Cap Transformation can be presented surface physical status in linear equation. Especially it can be used to analyze vital power, soil moisture and soil
brightness from satellite image data by using regression analysis and rectangular function.
The coefficients of Tasseled-Cap Transformation depend on the sensor differences and linear transformation. In this study, coefficients of James H.
Horne were used to analyze satellite image.
+ 0.326 x blue + 0.509 x green + 0.560 x red + 0.567 x nir - 0.311 x blue - 0.356 x green - 0.325 x red + 0.819 x nir - 0.612 x blue - 0.312 x green + 0.722 x red - 0.081 x nir - 0.650 x blue + 0.719 x green - 0.243 x red - 0.031 x nir
TABLE1. Tasseled-Cap Transformation coefficients Figure 4 shows the result distribution map of applying Tasseled-Cap Transformation in naenam myen in Gyeongju, Korea. It is easily figured that higher vital power area and lower vital power area also higher soil brightness and lower higher soil brightness according Greenness and Brightness.
FIGURE1. Comparison between TCT distribution map and field surveying
4. Comparison between TCT distribution map and field surveying
The satellite images used in this study it was identified in winter season data so that conifer tree has higher vital power than broad-leaved tree. The result of this research, 15 of 18 sample points in A area were identified in conifer tree(83%) while 14 of 18 sample points in B area were identified in broad-leaved tree(78%) as shown in Figure 4.
5. Conclusions
In this study the forest type classification methodology is developed and its distribution map was constructed by applying high resolution satellite image, QuickBird-2, based on Tasseled Cap Transformation, especially through comparing the result of detailed filed surveying such as forest type, tree species, tree diameter, tree age and tree crown density in pilot study area. The summary of this study are as following.
1. The result of integrating between Tasseled-Cap Transformation distribution map and field surveying shows the 80% accuracy through mapping29 of 36 sample points correctly so that Tasseled-Cap Transformation analysis has high efficiency in analyzing forest type classification..
2. As you know the coefficients of Tasseled-Cap Transformation really depends on the sensor of satellite image so that the coefficients should be re calculated.
However, the constant value, which is already acquired, could be used by linear transformation. Thus, the band characteristic, itself, of row image data could be reflected on its analysis.
3. In previous study, the satellite images in summer or fall season were often used to acquired forest information. However, the satellite images winter season could be very useful to extract forest classification between conifer tree and broad-leaved tree.
For further study, there should be more research on wavelength information band based on filed surveying data for identification of each forest species and tree species. Also, there should be more expanded study area and surveying cases for more real application in forest area.
References
James H. Horne, 2003. A TASSELED CAP TRANSFORMATION FOR IKONOS IMAGES.
ASPRS 2003 Annual Conference Proceedings John R. Jensen, 2000, Introductory digital image
processing-second edition, Prentice Hall.
Wan-Young Song, 2006. Developing the classification method of forest type using high resolution satellite images and SML(Spatial Modeling Language) in Jeju, pp.33-36
Myung-Hee Jo, 2006. Analyzing Forest Characteristic of the parasitic volcano(ORM) using Multi-temporal High Resolution Satellite Images and SML(Spatial Modeling Language), Proceedings of ISRS 2006 PORSEC, pp.294-296
Sung-Jae Kim, 2007. Development of FUndmental District Map Construction Method For Selecting Forest Location Using GIS And RS, 2007 Asian Conference on Remote Sensing, pp.106