PAPER
SLA-Aware and Energy-E ffi cient VM Consolidation in Cloud Data Centers Using Host State Binary Decision Tree Prediction Model
Lianpeng LI†, Jian DONG†a), Decheng ZUO†,Nonmembers, Yao ZHAO†,Member, andTianyang LI†,Nonmember
SUMMARY For cloud data center, Virtual Machine (VM) consolida- tion is an effective way to save energy and improve efficiency. However, inappropriate consolidation of VMs, especially aggressive consolidation, can lead to performance problems, and even more serious Service Level Agreement (SLA) violations. Therefore, it is very important to solve the tradeoffbetween reduction in energy use and reduction of SLA violation level. In this paper, we propose two Host State Detection algorithms and an improved VM placement algorithm based on our proposed Host State Binary Decision Tree Prediction model for SLA-aware and energy-efficient consolidation of VMs in cloud data centers. We propose two formulas of conditions for host state estimate, and our model uses them to build a Bi- nary Decision Tree manually for host state detection. We extend Cloudsim simulator to evaluate our algorithms by using PlanetLab workload and ran- dom workload. The experimental results show that our proposed model can significantly reduce SLA violation rates while keeping energy cost ef- ficient, it can reduce the metric of SLAV by at most 98.12% and the metric of Energy by at most 33.96% for real world workload.
key words: VM consolidation, Binary Decision Tree, SLA-aware, energy- efficient, cloud data centers
1. Introduction
Cloud computing is a pay-per-use model that provides us- able, convenient and on-demand resource use. Today more and more enterprises and research institutions choose cloud computing for reducing the total cost of ownership and im- proving work efficiency. But cloud data centers are consum- ing more and more power, so cloud service providers need to improve resource efficiency to save money, for example, Google company can save more than a million dollars per year by reducing just 3% power[1].
Virtual Machine (VM) consolidation technique is an effective method for saving power by reducing active phys- ical servers[2]. It has been found that about 30% power is used by idle servers in cloud data centers which causing un- necessary carbon dioxide emissions[3]. VM consolidation technique reassigns VMs to as few physical hosts as possi- ble. After that the idle servers can be turned into low power mode, so the overall energy consumption can be effectively reduced.
However, VM consolidation may cause performance Manuscript received December 25, 2018.
Manuscript revised May 12, 2019.
Manuscript publicized July 11, 2019.
†The authors are with the Department of Computer Science and Technology, Harbin Institute Of Technology, Harbin, 150001, China.
a) E-mail: [email protected] DOI: 10.1587/transinf.2018EDP7441
problems because all VMs in IaaS environment share the un- derlying physical resources. Quality of Service (QoS) which is formalized via Service Level Agreement (SLA) is critical for both cloud providers and users. So there exists a trade- offbetween energy efficiency and performance - minimizing energy consumption on the premise of meeting SLA. There- fore, we need to carefully develop a VM migration scheme.
An effective method is to migrate VMs according to the state of the host at the next moment. If the host is overloaded at the next moment, some VMs should be migrated out of the host to avoid performance degradation. If the host is lightly loaded at the next moment, then the host should be shut down to save energy. Therefore, all VMs should be migrated out of the host.
Some studies[4],[5] have found that the energy con- sumption of servers is linearly related to their CPU utiliza- tion. So in this paper, a prediction model is proposed to forecast the future host state based on host CPU utilization and named Host State Binary Decision Tree Prediction (HS- BDTP) model. The main objective of HSBDTP model is to minimize the power consumption and SLA violation level.
Compared to other supervised machine learning methods, decision tree classifier is a simple and efficient classification model, which is often used for prediction. The main contri- butions of this paper are the following.
1. We propose a HSBDTP model to predict the future host state based on Binary Decision Tree classifier in cloud data centers.
2. Based on our HSBDTP model, we design two host state detection algorithms, which can accurately predict the overloaded and underloaded of the host.
3. We propose two formulas of conditions for host state estimate. Unlike other researches who usext+1(x is the vector of host CPU utilization) at timet+1 to decide whether a host is overloaded/underloaded in the next time, we use the 4 CPU utilizationxt,xt+1,xt+2,xt+3at timet,t+1,t+2,t+3 to build four conditions for host state estimate.
4. Using our host state detection algorithm, we improve the VM placement algorithm to avoid invalid VM placement.
5. We extend the Cloudsim[6] simulator to implement the proposed algorithms in this paper for performance evaluation.
The remainder of this paper is organized as follows.
Copyright c⃝2019 The Institute of Electronics, Information and Communication Engineers
The related work is discussed in Sect. 2. In Sect. 3 we in- troduce our HSBDTP model. Our VM consolidation algo- rithms based on HSBDTP Model are shown in Sect. 4. We give the performance evaluation in Sect. 5. In Sect. 6 we conclude our paper and discuss some future directions.
2. Related Work
VM consolidation technology can be divided into Non- Predictive VM consolidation method and Predictive VM consolidation method according to whether or not to pre- dict the future use of resources. Non-Predictive VM con- solidation method makes decisions for VM migration just considering the current server resource utilization. Ahamed et al.[7]propose a Non-Predictive VM consolidation algo- rithm. If the current server CPU utilization is greater than 90%, then the server is considered overloaded, and some VMs should be migrated from the server. Again, If the cur- rent server CPU utilization is less than 10%, then the server is considered underloaded, and all VMs should be migrated from the server, after that, the server can be turned into sleep mode for power saving. In [8]–[10]authors propose two Non-Predictive VM consolidation policies: Median Abso- lute Deviation (MAD) and Inter Quartile Range (IQR). Al- though threshold can be dynamically adjusted with the re- sults of the above two statistical methods, but no predictions are made.
On the contrary, Predictive VM consolidation method migrates VMs based on prediction of server future resource utilization. The examples of Predictive VM consolidation algorithms are[11]–[13]. In[11], If the current server CPU utilization is greater than the upper threshold, then the server is considered overloaded, and if the current server CPU uti- lization is less than the upper threshold, a linear regression function is trained to estimate the server future CPU utiliza- tion, and if the estimation of server future CPU utilization is greater than the upper threshold, the server is considered overloaded too, and some VMs should be migrated from the overloaded server to save power. Mohammad et al.[12]pro- pose an Iterative Weighted Linear Regression (IWLR) host overloaded algorithm. The authors use IWLR algorithm to predict host future CPU utilization values at next time and the time after next. If host future CPU utilization at next time is bigger than 1(the host total capacity), then the host is predicted overloaded, and some VMs should be migrated to other hosts; if host future CPU utilization at time after next is bigger than 1, then the host is marked as under pres- sure, and the host will not accept any new VMs. Suhib et al.[13]propose a host prediction model based on first order Markov chain. Hosts are divided into three states based on their CPU utilization, O stands for overloaded load state, N stands for normal load state, U stands for underloaded load state. The next time state can be predicted according to a state transition probability matrix, and if the next state is O, meaning the host will be overloaded in the next time, some VMs should be migrated from this host.
Our previous studies have proposed two Predictive VM
consolidation methods: linear regression method[14]and Bayesian classifier method[15]. Linear regression method predicts by training a regression function. Different from the native simple linear regression, we propose a Robust- SLR prediction model which uses eight methods to amend the prediction. Bayesian classifier method classifies and pre- dicts by calculating class prior probability and class condi- tional probability. We propose a HSNBP model based on Bayesian classifier for host overloading detection. We will compare our HSBDTP model with our previous studies and some other methods mentioned above in Sect. 5.
Compare to Non-Predictive VM consolidation algo- rithms, Predictive VM consolidation algorithms will display lower SLA violations because of migrating VMs out from predicted overloaded hosts. But inaccurate prediction may lead to unnecessary VM migration, resulting in performance degradation. So in this paper, we are committed to find- ing more effective machine learning prediction algorithm.
We have proposed a novel host state prediction model based on Binary Decision Tree classifier named Host State Binary Decision Tree Prediction model. Compared to other super- vised machine learning methods, decision tree classifier is a simple and efficient classification model, which is often used for prediction. Some studies[16],[17]have shown that De- cision Tree methodology has excellent performance in many aspects, and it does not require too much tedious work from developers and end users.
Dabbagh et al.[18] have proposed a random choice VM placement algorithm. It chooses the destination active servers randomly for VM migration. And if no available active server, it turns on a new server to accommodate the target VMs. Farahnakian et al.[19]discuss a Best Fit VM placement algorithm. It chooses the active server with the minimum residual resource for VM migration. A Power Aware Best Fit Decreasing (PABFD) algorithm has been proposed for VM placement[8],[20], it chooses the least power increasing host for a VM migration. The algorithm is a greedy algorithm, so VMs are often consolidated aggres- sively.
3. Host State Binary Decision Tree Prediction Model We select Classification And Regression Trees(CART)[21]
for our HSBDTP model in this paper. The CART construc- tion algorithm generate a binary decision tree by recursive partitioning of a data set D. CART uses measurement of
”impurity”[22]for optimal partitioning. For example, a fea- tureS splits a data set Dinto subsetsD1at left child node N1andD2at right child nodeN2. The Gini Impurity at split S is:
Gini(D,S)=|D1|
|D| ×Gini(N1)+|D2|
|D| ×Gini(N2) (1) whereGini(N1) denotes the Gini Impurity of left child node N1, andGini(N2) denotes the Gini Impurity of right child nodeN2.
Then the best split can be calculated by Eq. (2). From
Eq. (2), we can see that the Gini Impurity of every possible split is determined, and the split with minimum Gini Impu- rity is selected as the best split.
split best=argmin(Gini(D,Si)),∀Si∈S (2) In this paper, we propose a Host State Binary Decision Tree Prediction model based on a binary decision tree clas- sifier to predict whether a host is overloaded/underloaded.
According to the decision tree theory, we need to formulate n+1-dimensional feature vector (a1,a2, . . . ,an,c) firstly. So choosing the suitable features and their label are the two key problems. Here we use the historic mean values of host CPU utilization as the input feature vector. Suppose the observa- tions CPU utilizationxt,xt−1,xt−2, . . . ,xt−n+1from n preced- ing points at timet,t−1,t−2, . . . ,t−n+1, then we get the vectorX=(xt,xt−1,xt−2, . . . ,xt−n+1). The input feature vec- torYcan be transformed from vectorXusing Eq. (3) which is shown as follows:
Y =(y1,y2, . . . ,yn),yk=(xt+xt−1+. . .+xt−k+1)/k, 1≤k≤n
(3) For host overloading detection method, a host can be divided into overloaded state and normal state; and for host underloading detection method, a host can be divided into underloaded state and normal state. So the domain of class labelcis{1,0}in our model, the class 1 is the over- loaded/underloaded state of host, and the class 0 is the nor- mal state of host. So how to decide the give input vectorY is overloaded/underloaded or normal is important. In other researches, people usext+1to decide whether a host is over- loaded/underloaded at next time. But our research finds that this method is really not accurate and not enough, there are at least two shortcomings for this single point predic- tion method which uses only one CPU instantaneous value.
Firstly, the host CPU instantaneous value often becomes too high or too low due to some sudden situation, but this sit- uation usually lasts only for a very short time. The single point prediction method using this abnormal value will lead to wrong prediction results. Secondly, if the CPU of a host is high or low in a short period of time, such as the last acquisi- tion cycle, but it is in normal state for a long time afterwards, it is also inappropriate to predict that the host is overloaded or underloaded. Because VM migration has negative impact on performance, and the cost of migration is likely to be greater than that of non-migration, so it is not appropriate to migrate too frequently. Our statistical analysis of the actual data also confirms this point. It finds that compared with single value prediction method, the accuracy of prediction can be improved from 34% to 93% for PlanetLab[20]data by using the multi value prediction method proposed in this paper. Our multi value prediction method is a decision tree predicting method which is shown in Fig. 1. We use the 4 CPU utilizationxt,xt+1,xt+2,xt+3at timet,t+1,t+2,t+3 to build four conditions. The formulas of conditions which are used on Fig. 1 are as follows:
Fig. 1 A Binary Decision Tree
C1 :xt>O1∧xt+1>O1
C2 :xt+1+xt+2>O2∨xt+1+xt+3>O2
∨xt+2+xt+3>O2
C3 :xt+xt+1+xt+2>O3∨xt+1+xt+2+xt+3>O3
∨xt+xt+2+xt+3>O3
C4 :xt+xt+1+xt+2+xt+3>O4
(4) C1 :xt<U1∧xt+1<U1
C2 :xt+1+xt+2<U2∨xt+1+xt+3<U2
∨xt+2+xt+3<U2
C3 :xt+xt+1+xt+2<U3∨xt+1+xt+2+xt+3<U3
∨xt+xt+2+xt+3<U3
C4 :xt+xt+1+xt+2+xt+3<U4
(5) conditions (4) is for host overloading detection, and conditions (5) is for host underloading detection. In (4) and (5), the key thing is to choose the values ofO1,O2,O3,O4
andU1,U2,U3,U4. Here we use the statistical analysis and experiment verification methods to choose the appropriate range of values firstly. Then we use the Gini Impurity which is the default splitting criterion used by CART[22]in binary decision tree to find the exactly values.
split best overload=argmin(|Gini(D,Si)−Ro|),
∀Si∈S (6)
split best underload=argmin(|Gini(D,Si)−Ru|),
∀Si∈S (7)
Next we would build a binary decision tree for host state detection. In this paper, we use an improved splitting criterion which is shown in Eq. (6) and (7) to build a binary decision tree manually, the detail is shown on algorithm 1.
In Eq. (6) and (7), we add an adjustment coefficient to the default equation respectively. The reasons for this modifica- tion can be explained as follows. In our model, the judgment conditions of overloaded and underloaded of hosts are sub- optimal solutions. Therefore, the split based on suboptimal
Algorithm 1HSBDTreeBuild(D,F,T)
Input: The train data setD, the feature vectorF, and the tree typeT;
Output: the root node of the Host State Binary Decision Tree,root;
1: ifthe depth of the tree is 10then
2: root=createNode();
3: ifT=Othen//building HOBDTree
4: root.test cond=split best overload;
5: end if
6: ifT=Uthen//building HUBDTree
7: root.test cond=split best underload;
8: end if
9: le f tchild=createNode();
10: le f tchild.lable=1;
11: rightchild=createNode();
12: rightchild.lable=0;
13: else
14: root=createNode();
15: ifT=Othen//building HOBDTree
16: root.test cond=split best overload;
17: end if
18: ifT=Uthen//building HUBDTree
19: root.test cond=split best underload;
20: end if
21: le f tchild=createNode();
22: le f tchild.lable=1;
23: rightchild=HS BDT reeBuild(D−Dle f t,F,T);
24: end if
25: returnroot;
solutions will lead to system errors, and the adjustment co- efficient can be considered as a revise for the system errors of the model. Because the interval of utilization measure- ments is 5 minutes in our experiment workload data, the last 50 minutes is enough for predicting the short future state, so we let n=10 in our experiment. For any input vectorY, we use the binary decision tree to classify it. If the input vec- torY is assigned to class 1, meaning the host will be over- loaded/underloaded at next time, otherwise the input vector Yis assigned to class 0, meaning the host will be normal at
next time.
On algorithm 1, the inputs are the train data setD, the feature vector F, and the tree typeT. There are two types of tree in our model, Binary Decision Tree for Host Over- loading detection (HOBDTree) and Binary Decision Tree for Host Underloading detection (HUBDTree). The feature vectorFis (y1,y2, . . . ,y10). Our HSBDTreeBuild algorithm is for building HOBDTree/HUBDTree, and the depth of HOBDTree/HUBDTree is 11. On algorithm 1, we firstly use the split which is shown in Eq. (6) and (7) to split the data set and create the left and right child nodes(line 13-24). Then we split the last data set and create the last left and right child nodes(line 1-12). Finally the HOBDTree/HUBDTree tree is returned for host state detection (line 25).
4. SLA-Aware and Energy-Efficient VM Consolidation Based on HSBDTP Model
We split VM consolidation problem into four subproblems:
(1) host overloading detection problem; (2) host underload- ing detection problem; (3) VM selection problem; and (4) VM placement problem. Next, we will study the four sub- problems separately.
4.1 Host Overloading Detection
We use our proposed HSBDTreeBuild algorithm to build a binary decision tree for detecting when a host is overload- ing. Algorithm 2 is the pseudo-code of Host Overloading Detection (HOD) algorithm.
Initially, when the host accumulates less than 10 histor- ical CPU utilization data, we use a static threshold method to detect whether a host is overloaded. Here we set the thresh- old to 90% (line 1-4). Then, we calculate the input vectorY according to Eq. (3) (line 6-12). After that we build a HOB- DTree using the HSBDTreeBuild algorithm (line 13). Then we use the HOBDTree for host overloading detection (line 14). Finally, if the host is overloaded, it will return true, otherwise it will return false(line 15-19).
4.2 Host Underloading Detection
We use our proposed HSBDTreeBuild algorithm to build a binary decision tree for detecting when a host is Underload- ing. Algorithm 3 is the pseudo-code of Host Underloading Detection (HUD) algorithm.
Initially, when the host accumulates less than 10 histor- ical CPU utilization data, we use a static threshold method to detect whether a host is underloaded. Here we set the thresh- old to 10% (line 1-4). Then, we calculate the input vectorY according to Eq. (3) (line 6-12). After that we build a HUB- DTree using the HSBDTreeBuild algorithm (line 13). Then we use the HUBDTree for host underloading detection (line 14). Finally, if the host is underloaded, it will return true, otherwise it will return false(line 15-19).
Algorithm 2Host Overloading Detection(HOD) Input: host;
Output: boolean;
1: n=10;
2: utilizationHistory=host.getutilizationHistory();
3: if utilizationHistory.lenth<n then
4: return host.getT otalRequestedMips() > 0.90 ∗ host.getT otalMips();
5: else
6: for i=0 ton−1 do
7: x[i]=utilizationHistory[n−i−1];
8: end for
9: for i=0 ton−1 do
10: y[i]= x[0]+x[1]i+1+...+x[i];
11: end for
12: Y =(y[0],y[1], . . . ,y[n−1]);
13: HOBDT ree=HS BDT reeBuild(D,F,O);
14: class=HOBDT ree(Y);
15: if class==1 then
16: returntrue;
17: else
18: returnfalse;
19: end if
20: end if
4.3 VM Selection
VM selection strategy is not the focus of this paper, so here is just a brief introduction to the strategy used in this pa- per.In this paper we choose the most commonly used Mini- mum Migration Time (MMT) strategy[8]as the VM selec- tion policy. The MMT strategy chooses a VM with the min- imum migration time. One or more VMs should be selected from the overloaded host, and the overloaded host applies the MMT strategy iteratively until it is not overloaded.
4.4 VM Placement
The PABFD[8], [20] VM placement algorithm, which chooses the least power increasing host for VM migration, is usually an efficient algorithm. But it is a greedy algo- rithm, and VMs are often consolidated aggressively. In this paper we propose a more efficient algorithm which is called
Algorithm 3Host Underloading Detection(HUD) Input: host;
Output: boolean;
1: n=10;
2: utilizationHistory=host.getutilizationHistory();
3: if utilizationHistory.lenth<n then
4: return host.getT otalRequestedMips() < 0.10 ∗ host.getT otalMips();
5: else
6: for i=0 ton−1 do
7: x[i]=utilizationHistory[n−i−1];
8: end for
9: for i=0 ton−1 do
10: y[i]= x[0]+x[1]i++...+1 x[i];
11: end for
12: Y =(y[0],y[1], . . . ,y[n−1]);
13: HU BDT ree=HS BDT reeBuild(D,F,U);
14: class=HU BDT ree(Y);
15: if class==1 then
16: returntrue;
17: else
18: returnfalse;
19: end if
20: end if
HSBDTP Power Aware Best Fit Decreasing (HPABFD) al- gorithm by improving the PABFD algorithm. Algorithm 4 is the pseudo-code of our HPABFD algorithm. If a host is go- ing to be overloaded or underloaded, then it is obviously not an ideal target host for VM placement, because soon some or all of its VMs will be migrated to other hosts. Therefore, our algorithm first detects whether a host is overloaded or under- loaded using the HOD/HUD algorithm proposed above. If the host is overloaded or underloaded, the host will be di- rectly excluded from the list of candidate hosts.
5. Performance Evaluation
5.1 Experiment Setup
We have simulated a heterogeneous data center with 800 nodes using the Cloudsim toolkit. There are two types of machines: HP ProLiant ML110 G4 servers and HP ProLiant ML110 G5 servers, each of which accounts for half. Table
Algorithm 4 HSBDTP Power Aware Best Fit Decreasing (HPABFD)
Input: hostS et,vmList;
Output: the allocation o f hosts f or vms;
1: sortvmListin descending order according to CPU uti- lization;
2: forvm invmListdo
3: minPower=MAX;
4: allocatedHost=NU LL;
5: forhost inhostS etdo
6: ifHU D(host) return truethen
7: continue;
8: end if
9: ifHOD(host) return truethen
10: continue;
11: end if
12: ifhost has enough resources for vmthen
13: newPower=getPower(host,vm);
14: ifnewPower<minPowerthen
15: allocatedHost=host;
16: minPower=newPower;
17: end if
18: end if
19: ifallocatedHost is not NULLthen
20: allocation.add(vm,allocatedHost);
21: end if
22: end for
23: end for
24: returnallocation;
Table 1 Configuration of hosts
Hosts CPU type Frequency(GHz)CoresRAM(GB) HP Proliant G4Intel Xeon 3040 1.86 2 4 HP Proliant G5Intel Xeon 3075 2.86 2 4
1 shows the configuration of hosts, Table 2 shows the power consumption characteristics of the servers, and Table 3 lists the characteristics of the VM types.
5.2 Workload Data
We evaluate our prediction model using random workload
and real world workload:
• Random Workload: Fifty VMs are running on fifty het- erogeneous servers in the data center. Each VM runs an application with 300 bytes of input and 300 bytes of output. The CPU utilization of VMs are generated using random variables. The simulation experiment is running for 24 hours.
• Real Workload (PlanetLab data): PlanetLab is the monitoring part of the CoMon project. Every five min- utes, It collectes the CPU utilization data from thou- sands of servers which are located at more than 500 places around the world[20]. We choose three different days of the workload traces in our simulations. Table 4 shows the characteristics of each workload.
5.3 Performance Metrics
We have used several metrics to evaluate the performance of the algorithms. The main metrics are described below.
• Energy: The mode of energy consumption is based on the real data from the SPECpower benchmark[23].
The mode of energy consumption of the servers that we used in this paper is shown in Table 2. We can see that the energy consumption of the server in sleep state is much less than the sever in active state.
• SLA Violation(SLAV): When a cloud provider fails to provide service to customers in accordance with service level agreement, a SLA violation will occur.
SLAV[8] is an independent metric that can be mea- sured by SLA violation time per active host (SLATAH) and performance degradation due to migration(PDM).
The two metrics are independent and have the same ef- fect on SLAV. So the SLAV metirc can be calculated as following:
S LAV=S LAT AH×PDM (8)
We are going to introduce SLATAH and PDM below.
• SLATAH: When host is experiencing 100% utilization, it can not provide service, so SLATAH can be calcu- lated as follows:
S LAT AH= 1 N
∑N
i=1
Toi
Tai (9)
whereN is the number of hosts; Toi is the total time during which the hostiis experiencing the 100% uti- lization; the total time of the hostiwhich in active state isTai.
• PDM: Live migration of VMs has negative impact on application performance. The PDM can be calculated as follows:
PDM= 1 N
∑N
i=1
Cd i
Cr i (10)
whereNis the number of VMs;Cd iis the performance
Table 2 Power consumption by the selected servers at different load levels in Watts
Server sleep 0% 10% 20% 30% 40% 50% 60% 70% 80% 90% 100%
HP Proliant G4 10 86 89.4 92.6 96 99.5 102 106 108 112 114 117
HP Proliant G5 10 93.7 97 101 105 110 116 121 125 129 133 135
Table 3 Characteristics of the VM types
VM type CPU(MIPS) RAM(GB)
High-CPU medium instance 2500 0.85
Large instance 2000 1.70
Small instance 1000 1.70
Micro instance 500 0.61
Table 4 Workload data characteristics (CPU utilization)
Date Hosts VMs Mean St.dev.
03/03/2011 800 1052 12.31% 17.09%
22/03/2011 800 1516 9.26% 12.78%
20/04/2011 800 1033 10.43% 15.21%
random 50 50 — —
degradation of the VMidue to migrations, Here it is set to 10% of the CPU utilization[24];Cr iis the total CPU capacity requested by the VMi.
5.4 Simulation Results and Analysis
In this section, we first use the two kinds of workload introduced above to do some simulation experiments on Cloudsim simulator, then we choose eight algorithms which are used in Cloudsim as benchmarks for comparative experi- ments, and finally we choose five state-of-the-art algorithms in recent years for comparative analysis.
The benchamrk algorithms are NPA(None Power Aware)[6], DVFS[25], THR-MMT-1.0[8], THR-MMT- 0.8[8], IQR-MMT-1.5[8], MAD-MMT-2.5[8], LR-MMT- 1.2[8], and LRR-MMT-1.2[8]. The hosts which use the NPA policy consume their maximum power all the time. The THR-MMT-1.0 algorithm uses the fixed threshold of 100%.
Figures 2–4 illustrate the Energy Consumption, SLAV, num- ber of VM migrations for the main algorithms respectively with the PlanetLab data sets of ”20110303”, ”20110322”, and ”20110420”. Because compare to the dynamic algo- rithms, the NPA, DVFS, and THR-MMT-1.0 are obviously not at the same level, so we don’t show their results on Figs. 3–5. But we can find the results of all the algorithms and all the metrics in Table 5. Table 5 shows the de- tails of experimental results with the PlanetLab data set of
”20110303”.
From the simulation results, we have got the follow- ing conclusions: (1) VM consolidation technique signifi- cantly surpasses NPA and DVFS; (2) because of reducing the level of SLA violations observably, dynamic heuris- tics algorithms considerably outperform the static heuris- tics algorithm(THR-MMT-1.0) ; (3) our proposed HSBDTP algorithm can significantly outperforms the benchmarks of
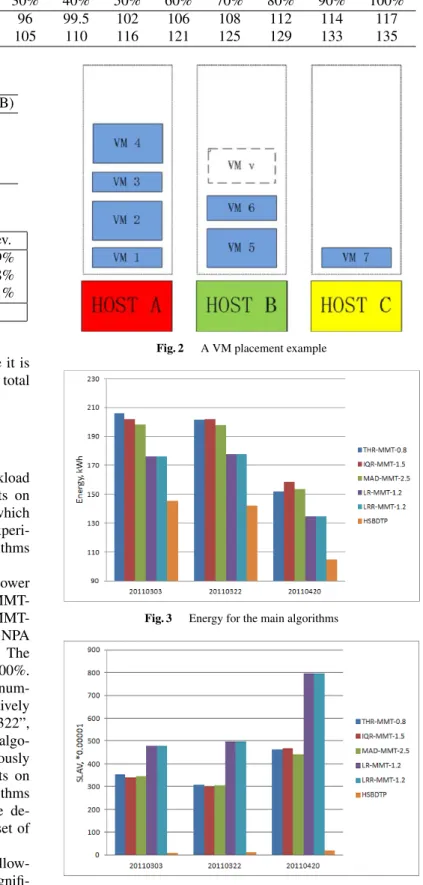
Fig. 2 A VM placement example
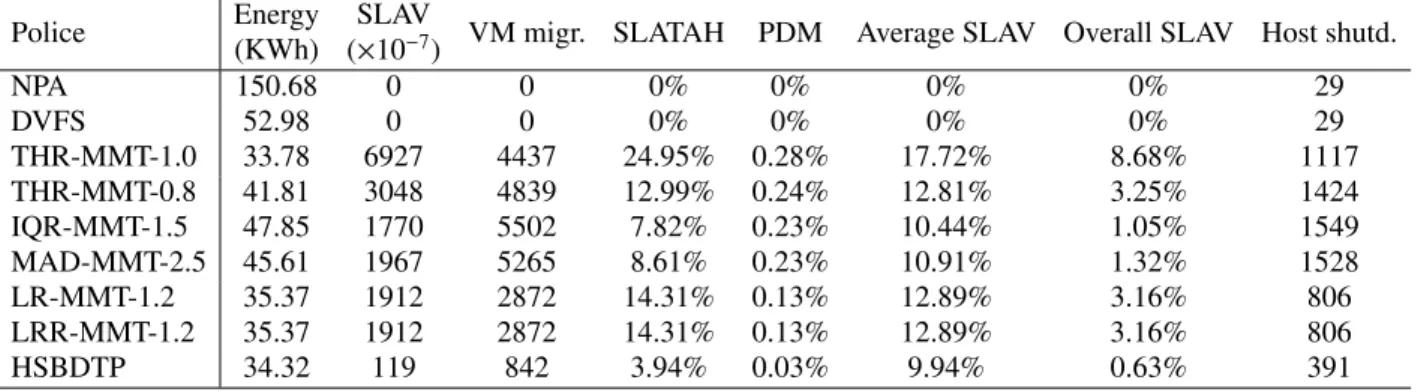
Fig. 3 Energy for the main algorithms
Fig. 4 SLAV for the main algorithms
three Non-Predictive VM consolidation algorithms and two Predictive VM consolidation algorithms. (4) Figs. 3–5 show that our proposed HSBDTP algorithm can reduce the metric
of Energy by at most 33.96%, average 25.96%, it can reduce the metric of SLAV by at most 98.12%, average 97.09%, and it can reduce the metric of number of VM migrations by at most 86.53%, average 83.56%. (5) We can get some other detail metrics from Table 5, it shows that our proposed HSB- DTP algorithm can reduce the metric of SLATAH by at most 82.11%, average 80.23%, it can reduce the metric of PDM by at most 87.5%, average 86.49%, it can reduce the metric of Overall SLAV by at most 93.33%, average 90.74%, and it can reduce the metric of number of host shutdowns by at most 75.04%, average 73.32%.
We also do some simulation experiments with random
Fig. 5 VM Migrations for the main algorithms
Table 5 Simulation results of the HSBDTP algorithm and benchmark algorithms (PlanetLab data)
Police Energy
(KWh)
SLAV
(×10−7) VM migr. SLATAH PDM Average SLAV Overall SLAV Host shutd.
NPA 2410.8 0 0 0% 0% 0% 0% 466
DVFS 787.84 0 0 0% 0% 0% 0% 466
THR-MMT-1.0 173.24 3088 48335 16.43% 0.19% 9.19% 0.58% 6491
THR-MMT-0.8 205.97 354 28843 4.97% 0.07% 10.11% 0.08% 6395
IQR-MMT-1.5 201.92 340 28350 4.91% 0.07% 10.1% 0.08% 6301
MAD-MMT-2.5 198.16 345 28162 4.93% 0.07% 10.13% 0.08% 6232
LR-MMT-1.2 176.15 478 28615 5.87% 0.08% 9.67% 0.15% 5483
LRR-MMT-1.2 176.15 478 28615 5.87% 0.08% 9.67% 0.15% 5483
HSBDTP 145.59 9 3885 1.05% 0.01% 9.90% 0.01% 1596
Table 6 Simulation results of the HSBDTP algorithm and benchmark algorithms (random workload)
Police Energy
(KWh)
SLAV
(×10−7) VM migr. SLATAH PDM Average SLAV Overall SLAV Host shutd.
NPA 150.68 0 0 0% 0% 0% 0% 29
DVFS 52.98 0 0 0% 0% 0% 0% 29
THR-MMT-1.0 33.78 6927 4437 24.95% 0.28% 17.72% 8.68% 1117
THR-MMT-0.8 41.81 3048 4839 12.99% 0.24% 12.81% 3.25% 1424
IQR-MMT-1.5 47.85 1770 5502 7.82% 0.23% 10.44% 1.05% 1549
MAD-MMT-2.5 45.61 1967 5265 8.61% 0.23% 10.91% 1.32% 1528
LR-MMT-1.2 35.37 1912 2872 14.31% 0.13% 12.89% 3.16% 806
LRR-MMT-1.2 35.37 1912 2872 14.31% 0.13% 12.89% 3.16% 806
HSBDTP 34.32 119 842 3.94% 0.03% 9.94% 0.63% 391
workload, and get similar results with the real workload experiments. Table 6 illustrates the Energy Consumption, SLAV, number of VM migrations and the other detail met- rics using the random workload for the benchmark algo- rithms and our proposed algorithm. From the observed sim- ulation results, we can see that our proposed HSBDTP algo- rithm can reduce the metric of Energy by at most 28.28%, average 16.70%, it can reduce the metric of SLAV by at most 96.10%, average 94.43%, and it can reduce the metric of number of VM migrations by at most 84.70%, average 80.28%.
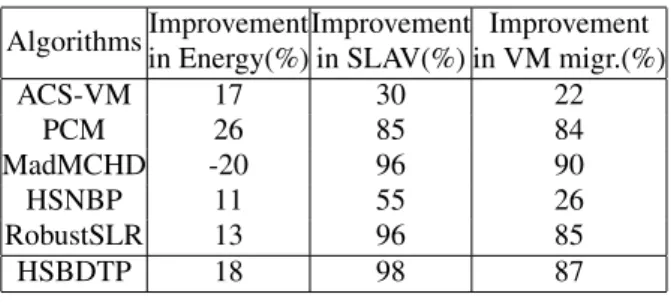
In order to compare with the researches in recent years, we choose ACS-VM[11], PCM[12], MadMCHD[13], and our two previous studies HSNBP[14], RobustSLR[15]as the benchmark algorithms, and calculate the Energy, SLAV, and number of VM migrations improvement percentages comparing to LR-MMT-1.2[8] policy using the PlanetLab data set of ”20110322”. For the RobustSLR model, we choose the MAE(10) strategy with the best overall perfor- mance[15]. The results are shown in Table 7. From the results, we can see that although our HSBDTP algorithm is about 10% improvement less than PCM in the metric of Energy, but it reduces the metric of SLAV by about 80%
compared with PCM. Compared with MadMCHD, our HS- BDTP algorithm has almost the same improvement in the metrics of SLAV and number of VM migrations, but it re- duces the metric of Energy by about 40%. Compared with ACS-VM, our HSBDTP algorithm performs much better in all the three metrics. For our previous studies, HSBDTP
Table 7 Improvement percentages for benchmark algorithms compared to LR-MMT-1.2
AlgorithmsImprovement in Energy(%)
Improvement in SLAV(%)
Improvement in VM migr.(%)
ACS-VM 17 30 22
PCM 26 85 84
MadMCHD -20 96 90
HSNBP 11 55 26
RobustSLR 13 96 85
HSBDTP 18 98 87
algorithm is much better than HSNBP, and Compared with RobustSLR, HSBDTP algorithm reduces the metric of En- ergy by about 6%, it reduces the metric of SLAV by about 50%, and it reduces the metric of number of VM migrations by about 13%.
The reasons for the performance improvement can be summarized as follows: Firstly, the most important reason is that we have established an effective decision tree pre- diction model. The multi value prediction method proposed in our model is more accurate than the single value predic- tion method, and the prediction accuracy of the PlanetLab data can be greatly improved from 34% to 93%. And we in- troduce adjustment coefficient to improve the default split- ting criterion to eliminate system errors. We also choose the appropriate input for the model. All these optimiza- tion measures enable us to establish a more accurate predic- tion model. Secondly, based on the above prediction model, we construct two effective host state prediction algorithms.
They can predict host overloaded and underloaded more ac- curately, so that we can choose when to migrate VMs more accurately. Thirdly, our improved VM placement algorithm excludes overloaded and underloaded hosts from the target hosts, which greatly avoids the invalid migration of VMs.
We will illustrate this point with an example. As shown in Fig. 2, it is obvious that the host B is the most suitable target host for VM v, because if VM v is migrated to host A or host C, then the host A and C will likely be detected overloaded or underloaded at the next moment, then the newly migrated VM v will probably face a second migration.
6. Conclusion and Future Directions
In this paper, we have proposed a HSBDTP model to pre- dict the future host state based on host CPU utilization. We propose two formulas of conditions for host state estimate, and our model uses them to build a Binary Decision Tree manually for host state detection. We have proposed two Host Overloading/Underloading Detection algorithms based on our proposed HSBDTP model in order to minimize the power consumption and SLA violation. We have also pro- posed an improved VM placement algorithm which is called HSBDTP Power Aware Best Fit Decreasing algorithm based on our model.
We have extended the Cloudsim simulator for perfor- mance evaluation of our proposed algorithms using Plan-
etLab workload and random workload. The experimental results have shown that our proposed algorithms can signif- icantly outperform the benchmark algorithms. It can reduce the metric of Energy by at most 33.96% and reduce the met- ric of SLAV by at most 98.12% for real workload, and for random workload it can reduce the metric of Energy by at most 28.28% and reduce the metric of SLAV by at most 96.10%. As a future work, we plan to optimize our model to further improve energy efficiency and reduce SLA vio- lations by considering a variety of resource types, such as CPU, RAM, and NET.
Acknowledgments
This work has been supported by a grant from the Na- tional Natural Science Foundation of China (Grant No.
61100029).
References
[1] A. Qureshi, R. Weber, H. Balakrishnan, J. Guttag, and B. Maggs,
“Cutting the electric bill for internet-scale systems,” Proc. ACM SIGCOMM 2009, vol.39, pp.123–134, 2009.
[2] M. Pedram, “Energy-efficient datacenters,” IEEE Trans. Comput.- Aided Design Integr. Circuits Syst., vol.31, no.10, pp.1465–1484, Oct. 2012.
[3] L.A. Barroso and U. H¨olzle, “The case for energy-proportional com- puting,” Computer 2007, vol.40, no.12, pp.33–37, Dec. 2007.
[4] X. Fan, W.-D. Weber, and L.A. Barroso, “Power provisioning for a warehouse-sized computer,” Proc. 34th Annual International Sym- posium on Computer Architecture (ISCA 2007), pp.13–23, ACM New York, NY, USA, 2007.
[5] D. Kusic, J.O. Kephart, J.E. Hanson, N. Kandasamy, and G. Jiang,
“Power and performance management of virtualized computing en- vironments via lookahead control,” Cluster Computing 2009, vol.12, no.1, pp.1–15, March 2009.
[6] R.N. Calheiros, R. Ranjan, A. Beloglazov, C.A.F. De Rose, and R.
Buyya, “Cloudsim: a toolkit for modeling and simulation of cloud computing environments and evaluation of resource provisioning al- gorithms,” Software: Practice and Experience (SPE), vol.41, no.1, pp.23–50, Jan. 2011.
[7] F. Ahamed, S. Shahrestani, and B. Javadi, “Security Aware and Energy-Efficient Virtual Machine Consolidation in Cloud Comput- ing Systems,” 2016 IEEE Trustcom/BigDataSE/ISPA, Aug. 2016.
[8] A. Beloglazov and R. Buyya, “Optimal online deterministic al- gorithms and adaptive heuristics for energy and performance effi- cient dynamic consolidation of virtual machines in cloud data cen- ters,” Concurrency and Computation: Practice and Experience 2012, vol.24, no.13, pp.1397–420, Sept. 2012.
[9] A. Beloglazov, J. Abawajy, and R. Buyya, “Energy-aware resource allocation heuristics for efficient management of data centers for cloud computing,” Future Generat. Comput. Syst., vol.28, no.5, pp.755–768, May 2012.
[10] A. Beloglazov, Energy-efficient Management of Virtual Machines in Data Centers for Cloud Computing, Ph.D. dissertation, Dept. Com- put. Inf. Syst., Univ. Melbourne, Parkville, VIC, Australia, 2013.
[11] F. Farahnakian, A. Ashraf, T. Pahikkala, P. Liljeberg, J. Plosila, I.
Porres, I. Porres, and H. Tenhunen, “Using ant colony system to consolidate vms for green cloud computing,” IEEE Trans. Services Computing, vol.8, no.2, pp.187–98, 2015.
[12] M.A. Khoshkholghi, M.N. Derahman, A. Abdullah, S. Subrama- niam, and M. Othman, “Energy-Efficient Algorithms for Dynamic Virtual Machine Consolidation in Cloud Data Centers,” IEEE Ac- cess, 2017.
[13] B.M. Suhib, A. Anjali, G. Nishith, and Z. Marzia, “Markov Pre- diction Model for Host Load Detection and VM Placement in Live Migration,” IEEE Access, 2018.
[14] L. Li, J. Dong, D. Zuo, and J. Wu, “SLA-Aware and Energy-Efficient VM Consolidation in Cloud Data Centers Using Robust Linear Re- gression Prediction Model,” IEEE Access, 2019.
[15] L. Li, J. Dong, D. Zuo, and J. Liu, “SLA-Aware and Energy-Efficient VM Consolidation in Cloud Data Centers Using Host States Naive Bayesian Prediction Model,” 2018 IEEE Intl Conf on Parallel and Distributed Processing with Applications, Ubiquitous Computing and Communications, Big Data and Cloud Computing, Social Com- puting and Networking, Sustainable Computing and Communica- tions, 2018.
[16] P.A. Chou, “Optimal Partitioning for Classification and Regression Trees,” IEEE Trans. Pattern Anal. Mach. Intell., vol.13, no.4, April 1991.
[17] Y. Li, “Predicting materials properties and behavior using classifi- cation and regression trees,” Materials Science and Engineering, A, vol.433, no.1-2, pp.261–268, Oct. 2006.
[18] M. Dabbagh, B. Hamdaoui, M. Guizani, and A. Rayes, “Toward energy-efficient cloud computing: Prediction, consolidation, and overcommitment,” IEEE Netw., vol.29, no.2, pp.56–61, 2015.
[19] F. Farahnakian, T. Pahikkala, P. Liljeberg, J. Plosila, N.T. Hieu, and H. Tenhunen, “Energy-aware vm consolidation in cloud data centers using utilization prediction model,” IEEE Trans. Cloud Computing, vol.7, no.2, pp.524–536, 2016.
[20] A. Beloglazov and R. Buyya, “Managing overloaded hosts for dy- namic consolidation of virtual machines in cloud data centers under quality of service constraints,” IEEE Trans. Parallel Distrib. Syst., vol.24, no.7, pp.1366–1379, July 2013.
[21] L. Breiman, J.H. Friedman, R.A. Olshen, and C.J. Stone, “Classi- fication and Regression Trees,” vol.40, no.3, p.874, Belmont, CA:
Wadsworth, Sept. 1984.
[22] D. Steinberg and P.L. Colla, CART: Tree-structured nonparametric data analysis, Salford Systems, San Diego, CA, 1995.
[23] The SPECpower benchmark. http://www.spec.org/power/ssj2008/. [24] C.L. Dumitrescu and I. Foster, “GangSim: A simulator for grid
scheduling studies,” Proc. IEEE Int. Symp. Cluster Comput. Grid (CCGrid), vol.2, pp.1151–1158, May 2005.
[25] H. Hanson, S.W. Keckler, S. Ghiasi, K. Rajamani, F. Rawson, and J.
Rubio, “Thermal response to DVFS: analysis with an Intel Pentium M,” Proc. International Symposium on Low Power Electronics and Design, ISLPED 07, pp.219–224, Aug, 2007.
Lianpeng Li received the B.S. and M.S.
degrees from Harbin Institute of Technology in 2006 and 2010. He is currently persuing the Ph.D. degree in computer science at Harbin In- stitute of Technology, His research interests in- clude parallel computation and cloud comput- ing, fault tolerant computer.
Jian Dong received Ph.D. degree in com- puter science and technology from Harbin Insti- tute of Technology, in 2008. From 2012 to 2017, he was an associate professor with the school of computer science and technology, HIT. Since 2017, he has been a professor with the school of computer science and technology, HIT. His re- search interests include fault tolerant computer, parallel computation and cloud computing.
Decheng Zuo received his Ph.D. degree from Harbin Institute of Technology (China) in 2000. He was assigned by the Ministry of Sci- ence and Technology of China, to lead the 863 major projects “High-end Fault-tolerant Com- puter System” in 2008. He created the “High- end Computer Evaluating Engineering Technol- ogy Research Center” of Heilongjiang Province of China in 2010 and served as the director till now. In 2011, Prof. ZUO was elected to be the vice-director of the Fault Tolerant Comput- ing Committee under China Computer Federation. His research interests include: computer architecture, fault tolerant computing, computer sys- tems performance evaluation technology, wireless sensor network, wear- able computing, mobile computing, etc.
Yao Zhao received the B.S. and M.S.
degrees from Harbin Institute of Technology in 2011 and 2013.He is currently persuing the Ph.D. degree in computer science at Harbin In- stitute of Technology, where his research inter- ests include reliability and availability in cloud computing.
Tianyang Li received the B.S. degree from Harbin Institute of Technology in 2018. He is currently persuing the Ph.D. degree in computer science at Harbin Institute of Technology, where his research interest is the reliability of software.