117
C
The Hollowing out of the Capital Markets and the Corporate Financing in Japan*
Yasuhiro Kobayashi
* This paper is a part of overseas research that the author studied at The University of Liverpool in England, for one year. The author is grateful to Dr. Arthur Thomas who is the head of department, for his instructive ad vices. Needless to say, all errors and responsibilities of this paper belog to
the author.
1 The Hollowing Out and Internationalization of the Capital Markets
This paper investigates the hollowing out of the capital markets in Japan and the change in the nature of fund raising by Japanese companies since 1990.
In 1980s, the capital markets moved towards deregulation and the international security investment greatly increased between developed countries. The financial and capital markets were also affected by the increased securitization of finance, and during this period financial compe- tition grew stronger in the markets of each country.
These developments in financial mechanisms are based on the interna- tionalization of business, especially, the global competition between multi- national enterprises, and multinational financial institutions, which in- vested funds on the cross border basis, and which have practiced inter-
118 AgilAiSM32AM 3(283)
penetration on the foreign direct investment.
It is important for understanding the trend towards internationalization to note that multinational enterprises and multinational banks
, which have been growing after the establishment of EEC in 1958, developed various kinds of financial innovation in the Euro markets , such as the concept of floating rate, derivatives, FRN , and Swap transactions. In addition, they have transmitted those innovations to the domestic market of each country.
Japanese companies also diversified their sources for raising funds , and this resulted in the high ratio of direct financing in their capital composi - tion.
However, since 1990, Japanese economy , thus far, remains in recession and is prevented from going up from the bottom because of the sharp contraction of corporate stock markets in 1990 .
As Japanese economic growth and capital equipment investment in 1980s were sustained by the prosperity of the stock market giving high stock prices and with low cost equity finance for companies , the decline of share prices and the contraction of the securities markets after the burst- ing of the bubble economy in 1990 entrapped the economic and business conditions in a state of depression. This was because business manage- ment and its financial activities depended excessively on hidden assets and fictitious capital generation in the securities markets .
We now have to discuss whether the Japanese capital markets have
"hollowed out" in tho
se circumstances. We consider that the hollowing out occurs in conditions of advancing internationalization , and it is an inevita- ble phenomenon when this proceeded.
Firstly, we look at the trends in international security investment in Japan.
(282) The Hollowing out of the Capital Markets and the Corporate Financing in Japan
Figure 1 Securities Investment in JAPAN
119
Net Purchases of Japanese Securities by Foreign Investors V bils. r
5, 000T 4.866
4,000 3,000 2, 000 1,000 ' Stocks
I -1, 000
-2, 000 -3, 000 -4, 000
-8, 000I
bils.~
00 000
0
,000 ,000
Bonds
--11 169
1985 86 87 88 89 90 91 92 93 94
1985 86 87 88 89 90 91 92 93 94
US$ bils.
Net Purchases of Foreign
8
5
9
Stocks
CI
I6 ^
3 ^
0
-3
Securities US$ bils.
100 90 4.1 80 70 60 50 40 30 20 10 0
1985 86 87 88 89 90 91 92 93 94
by Japanese Investors
- Bonds
^
61.0
I.
1 I
^
1985 86 87 88 89 90 91 92 93 94
Source : TSE, Fact Book 1995, pp. 93 and 95.
Figures 1 shows the in-out security investment in Japan. Foreign invest- ment in Japanese securities increased after the stock price decrease of 1990.
and foreign investors preferred to invest more in stocks than bonds. It is reason why the stock price dropped to a reasonable price for foreign
investors who have expected the growth of corporate Japan.
Net balance (purchases) of Japanese stock by foreign investors in 1990 increased by 2,723 billion yen to 4,866 billion yen. Foreign investors wanted to get assets denominated yen, under the rising yen, and furthre- more, this proceeded the international diversification of investment.
On the other hand, Japanese investment in foreign securities has always
included more bonds than stocks because Japanese investors, mainly
120 fiffrvilaM3240 3 ~. (281)
institutional investors, purchased the euro yen bonds issued by foreign governments and relatived agencies or by Japanese companies who wished to avoid foreign exchange risk. It seems that the hollowing out of the capital markets in Japan is related to market problems involving euro yen bonds and domestic bonds.
The problems of "hollowing out" in the capital market which is dis - cussed in Japan can be summed up in the three points given below ;
(1) Some foreign companies listed on the Tokyo Stock Exchange with- drew their listing and moved to the Asian capital markets , such as Hong Kong, Singapore.
(2) Asian capital markets emerged quickly and two years ago , big Chinese companies were listed on the New York Stock Exchange by passing the Tokyo Stock Exchange.
(3) Japan's stock trading is increasing on the London market (SEAQ international). In addition, it is said that the euro yen bond market has developed more rapidly than the domestic bond markets in Japan .
Table 1 Number of Listed Companies on the Tokyo Stock Exchange
1985 86 87 88 89 90 91 92 93 94
Domestic 1476 1499 1532 1571 1597 1627 1641 1651 1667 1689
Foreign 21 52 88 112 119 125 125 119 110 93
Source : Toushou Youran Fact Book, Tokyo Stock Exchange, Various Years.
As Table 1 shows, in 1990 and 1991, the listed number of foreign companies were record high of 125. Although Tokyo foreign stock market was established in December 1973 and has been developed by gradual process of deregulation, some foreign companies decided to end their listing after 1990 and 1991 because of depressing stock market condition and the decline in the number of shareholders. As a result , the number of listed foreign companies eventually decreased to 93 in 1994.
1985 86 87 88 89
Domestic Foreign
1476 21
1499 52
1532 88
1571 112
1597 119
93 1667
110 ---1-__--- 94
. 1661 i 119
1689 93
(280) T.inheJapan Hollowing out of the Capital Markets and the Corporate Financing 121 Further, American companies as General Electric, Amex, Ford Mortors, Allied Signal, announced their departure from the Tokyo stock market, and ended their listing on June 1995, and the number of foreign listing eventually fell to 83 in June this year (For these see Nihon Keizai newspaper, 25th March 1995).
The reason of their withdrawal are all related to the declining volume of stock trading and that the listing fee is a considerable burden on listed foreign companies. Also, it costs a great to make the documents for negotiable securities available in Japanese. Those foreign company's delis- ting on the Tokyo stock market were accepted by the Tokyo Stock Exchange which aimed to create an international financial center, as a decline of its position in Asia, and also it is held that it will be serious affair
if the Tokyo market becomes merely a local or regional market.
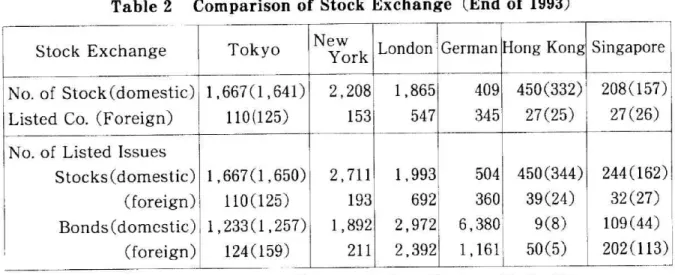
Table 2 Comparison of Stock Exchange (End of 1993)
Stock Exchange TokyoNYLondon German Hong Kong Singapore No. of Stock (domestic) 1,667 (1,641) 2,208 1, 865 409 450 (332) 208 (157) Listed Co. (Foreign) 110 (125)153 547 345 27 (25) 27 (26) No. of Listed Issues
Stocks (domestic) 1,667(1,650) 2,711 1, 993 504 450 (344) 244 (162) (foreign) 110 (125)193 6921 360 39(24) 32 (27) Bonds(domestic) i 1,233(1,257) 1,892 2,972 6,380, 9(8) 109(44)
nge Tokyo New
York London German Hong Kong Singapore
,mestic)
~ign)
1,667(1,641) 110(125)
2,208 153
1,865 547
409 345
450(332) 27(25)
208(157) 27(26)
sues
mestic) oreign)
^mestic) Foreign)
1,667(1,650) 110(125) 1,233(1,257)
124(159)
2,711 193 1,892
211
1,993 692 2,972 2,392
504 360 6,380 1,161
450 (344) 39(24)
9(8) 50(5)
244 (162) 32(27) 109(44) 202(113)!
Note ; Numbers of Tokyo, Hong kong, Singapore in Parenthesis are No. in 1991.
Source ; Data are from Toushou Youran Fact Book, 1993 & 1995, Tokyo Stock Exchange.
Table 2 shows that the listed number of foreign companies in the Asian market is growing. We should notice that bond markets in Hong Kong and Singapore markedly increased the number of foreign listings. In addition to those circumstances, two Chinese enterprises, such as Shanhai Sekiyu Kako in July 1993 and Santon Kanou Hatsuden in August 1994, listed on
122 rgi M 32 M 3
(279)
the New York Stock Exchange but not on the Tokyo market .
But it appears to us that the above factors are not always leading to hollowing out. We may put the points briefly as follow .
Speaking about points 1 and 2, firstly, foreign companies' delisting on the Tokyo Stock Exchange was caused by the lingering depression in the Tokyo stock market. It will be able to solve the problem if the market in Japan recovers from the recent low levels. It is natural for China to prefer the New York capital market with its largest scale for fund raising for Chinese companies.
Simultaneously, at the present, the Singapore government introduced a new tax treatment to stimulating inward investment from foreign coun - tries, and gave preferential treatment in the form of tax exemption for a non-resident who received dividends in Singapore .
It will be understood that markets closely inter-related , and at present, financial competition has become stronger between Japan and the DAES
(Dynamic Asian Economies).
Finally, the third point is as follow ;
Japanese stock trading on the London market (SEAQ International) increased to 13 trillion yen in 1994, compared with 10 trillion in 1990. It is considered that this increase does not mean the hollowing out of the Japanese stock market. The amount of foreign trading of Japan's stocks on the Tokyo Stock Exchange simultaneously increased since 1990
, and increased to about 33 trillion yen in 1994 (Koizumi , R. [2], pp. 58-59.). It is, therefore, concluded that the increase of Japan's stock trading on London market may be related to the growth of foreigner's investment into the Japanese stock in Tokyo.
At the present, foreign institutional investors have especially diversified
their investments internationally, and invested more in Japanese stocks in
(278) T. Hollowing out of the Capital Markets and the Corporate Financing in Japan 123
Japan. We must notice that the increase of Japan's stock trading on the London market is attracted by the purchase of stock of foreign investors on the Tokyo stock market. Therefore, it is not necessarily to be seem as a hollowing out phenomenon in Japan.
However it is possible to say that if euro yen bonds markets are growing more rapidly, domestic bonds markets inclusive of Samurai bonds will suffer from the hollowing out. To protect from hollowing out, it is neces- sary to review the issuing fees and the guideline relative to the bond issues, and relax the regulations on bond markets in Japan.
Table 3 Overall volume of borrowing facilities $ billion
Tr,ctriiman+c
I 1 NO 1991 1992 ! 1993 1994
Instruments1990 19
Bonds222.9(55.4)1308.7
Equities7.3 23.4
Syndicated loans124.5(1.6) 116.0
Committed back-up facilities 7.0(0.1) 7.7 A. Total securities & facilities 368.7(57.1)455.8
ECP programmes48.3 (5.9) 35.9
ynutcatea ioans
Committed back-up facilities7.0(0.1) 7.7(0.2) ' 6.7(-) 8.2( -) 4.9( ) A. Total securities & facilities 368.7(57.1)455.8(72.3)481.8(57.1)666.6(61.9)679.6(39.3)
ECP programmes48.3 (5.9) 35.9 (7.1) 28.9 (2.6) 38.4 (1.0) 31.8 (2.7) MTEN programmes17.9(1.1) 44.3(4.4) 99.0(15.8)113.6(22.4) 243.1(31 .2)' B. Total uncommitted borrowing 66,2(7.0) 80.2 (11 .5) 127.9 (18.4)152.0 (23.4) 274.9 (33.9)
GRAND TOTAL (A + B) '434.9(64.1)536.0(83.8)609.7(75.5)818.6(85.3)954.5(73.2) Note Note ; Numbers in parenthesis are volume of Japan.
Source ; Data are caluculated from Financial Market Trends(60), February 1995.
Table 3 describes the instruments of financing in the international financial and capital markets. It is clear that the grand total increased by
17 percent from previous years, to the historical high of 955 billion dollars in 1994. The numbers in parenthesis show the amount of Japanese offer- ings. Japan has mainly offered securities in terms of bonds, and has occupied a high market share of convertible bond and bond with warrant in those markets.
Table 4 shows a Japanese percentage of instruments of financing on every year in those markets. As Japanese stock price was high during the
__ 1
1992 1993 1994
1) 333.7(56.2) 481.0(61.0) 426.9(38.5)
23.5 40.7 44.9
117.9(0.9) 136.7(0.9) 202.8(0.8) 6.7( ) 8.2( ._.) 4.9( )
124 M 32 4 3
(277) Table 4 Rate of Japanese Financing in the international Capital and
Financial Market(%)
Ins truments 1990 1991 1992 1993 1994
Straight Bonds Convertible Bonds Warrant Bonds Floating Rate Note Stocks
Syndicated Credits ECP programmes MTEN Programmes NIF
12.
61.
95.
21.
1.
12.
6.
1.
71 32 30 56
29 21 15 43
15.57 26.73 90.82 8.74
19.78 9.93 2.60
12.09 46.15 83.44 18.81
0.76 9.0 15.96
9.29 27.62 77.67 7.74
0.66 2.60 19.71
6.
17.
84.
6.
0.
8.
12.
61 97 85 75
39 49 83
Note ; Numbers are Rate of every years and instruments .
Source; Culculated from data in Financial Market Trends (60), February 1995.
bubble economy until 1990 , large proportion of equities related bonds were issued by Japan, and attracted many investors to those bonds due to link with Japan's high stock price . In the next section, we examine the Japanese financing by bonds issues in the international capital market
, as we saw already on figure 1 that Japanese have invested much earlier in overseas issued bonds.
2 Corporate Financing and Deregulations
It was discussed earlier that an increase of yen denominated euro bonds hollow out the Japanese domestic bonds markets . To prove it, we analize the financing of Japanese listed companies in domestic and foreign mar - kets since 1990.
Firstly, on the domestic market , in 1994, a total of funds raised amounted to 6,583 billion yen, to 77 .5 percent in the grand total , although straight bond issues have much decreased . Because the stock market has modestly improved and investors shifted to convertible bonds . Accordingly, as a lot of issues of convertible bond and stock covered the decrease of straight
(276) TheinHollowing out of the Capital Markets and the Corporate Financing Japan 125 bond, the sum of funds raised increased. It is the reason why at that time,
investors expected that the national economy and corporate performance can recover because the environments for bonds issues were in good order and they could issued convertible bonds at below 1 percent.
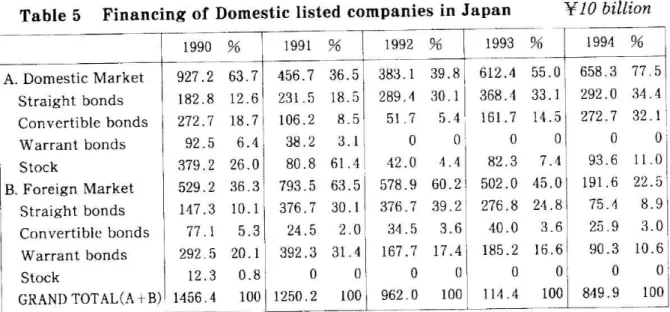
Secondly, on the foreign market, as Table 5 described, the rate of foreign financing increased remarkably, more than 60 percent beyond the domes- tic market in 1991 and 1992. However, in 1994, the amount of funds raised on the foreign market decreased to 22.5 percent and to 1,916 billion yen,
from 5,020 billion yen of previous year. The reason why Japanese bond issue overseas decreased, is that Japanese companies returned to the national market. That is to say, Japanese companies preferred to issue bonds in the national market that was reformed by the relaxation of criterion for eligible bonds and a low interest well below 1 percent.
Table 5 Financing of Domestic listed companies in Japan 1991
A. Domestic Market 927 .2 63. 7
Straight bonds 182 .8 12. 6
Convertible bonds 272 .7 18. 7
Warrant bonds 92 .5 6. 4
Stock 379 .2 26. 0
B. Foreign Market 529 .2 36. 3
Straight bonds 147 .3 10. 1
Convertible bonds 77 .1 5. 3
Warrant bonds 292 .5 20. l
Stock 12.3 0. 81
GRAND TOTAL(A +B) 1456 .4 100
1990 % 1991 % 1992 % 1993 Domestic Market 927.2 63.7 456.7 36.5 383.1 39.8 612.4 Straight bonds 182.8 12.6 231.5 18.5 289.4 30.1 368.4 Convertible bonds 272.7 18.7 106.2 8.5 51.7 5.4 161.7
Warrant bonds92.5 6.4 38.2 3.1 0 0 0
Stock379.2 26.0 80.8 61.4 42.0 4.4 82.3
Foreign Market 529.2 36.3 793.5 63.5 578.9 60.2 502.0 Straight bonds 147.3 10.1 376.7 30.1 376.7 39.2 F 276.8 Convertible bonds 77.1 5.3 24.5 2.0 34.5 3.6 40.0 Warrant bonds292.5 20.1 392.3 31.4 167.7 17.4 185.2
Stock12.3 0.8 0 0,1 0 0 0
GRAND TOTAL(A - -B) 1456.4 100 1250.2 100 962.0 100 114.4 Note; numbers of Stock included volume of Exercise of Warrants.
Source ; Culculated from data in Shouken Toukei Nenpou, 1994, p. 134.
Y10 billion
1994
55.0 658 .3 77 5 33 .1 292 .0 34 4
14 .5 272 .7 32 1
0 0 0
7 .4 93.6 11 0
45 .0 191 .6 22 5
24.8 75.4 3.6 25.9 16.6 90.3
0, 0
100 849.9
8.9' 3.0 10.6
100
However, the amount of funds raised by Japanese companies in foreign securities markets has gradually increased since 1990, except for 1994.
What the Table 5 makes clear is that Japanese companies issued external bonds in yen, such as foreign bonds and euro bonds, but have hardly
126 rtt if 32 s, 3(275)
issued stock. Also, bonds with warrant are always issued overseas
, while few are issued in national market . The increase of bonds with warrants issued by Japanese companies in foreign markets indicates that the such bonds have effective means of hedging foreign exchange risks for Japa - nese companies, which have a lot of assets overseas under the rising yen
. Table 6 External bonds issues in yen1( billion
Foreign issues in tokyo Euro-yen bonds
(Non Resident)
(Japan) TOTAL
(of which : by LDCs)
1990 1991 1992 1993 1994
1,131 3,268 2,214 1,054 4,399 65
705 4,811 1,562 3,249 5,516 185
924 4,277 1,703 2,574 5,201 155
1,719 4,921 2,041 2,880 6,640 420
1,123 6,789 5,395 1,394 7,912 545
Source ; Culculated from data in Financial Market Trends(60), p. 66.
Table 6 gives the external bond issues in yen , and a comparison of foreign issues in Tokyo(Samurai bond) and euro yen bond . The govern- ments and agencies, large companies of each country actively issued yen denominated bonds in the foreign and national markets in accordance with the development of the internationalization of the yen . Foreign issues in Tokyo that are bonds in yen issued by non-residents
, namely Samurai bond, increased from 1991. The reason why Samurai bond issues increased is that it could be issued at a low interest , as compared with the interest of other developed countries, although Japan's long term interest were on an upward trend until September 1994. But Samurai bonds then decreased by 596 billion yen from previous year , to 1,123 billion yen in 1994. The reason for this is that as the Samurai bond issued by sovereign countries
, like Sweden and Finland, was in a large quantity in 1993. it appeared a reaction in 1994 (Ueda, Y.[13], p. 2).
The important point to note about the hollowing out is that the euro yen
(274) T. Hollowing out of the Capital Markets and the Corporate Financing in Japan 127
bond issued by foreigners and Japanese became large recently, and each amount of these bonds were always much more than Samurai bonds.
As we have seen on the Table 6, the volume of euro yen bond issues has remarkably doubled from 3,268 billion yen in 1990 to record high of 6,789
billion yen in 1994 due to a great demand for yen. This increase was based
on non-resident issues of 5,395 billion yen in 1994, twice as much as previous year.
There are mainly two reasons behind growth of euro yen bonds mar- kets. First, although Japanese government has prohibited a primary sale into Japan during the 90 day after the euro yen bonds were issued, but on
1st January 1994, the Ministry of Finance in Japan removed the 90 day
"lock -up" for euro yen bonds issued by foreign sovereign borrowers and their agencies in order to correspond with the internationalization of the yen, but it remained for domestic companies. This lifting of 90 day
"lock -up" must have stimulated the issues of euro yen bonds. Second, it is clear that the Japanese institutional investors recomposed their portfolios towards yen denominated bonds in order to avoid foreign exchange risks
under the appreciation of the yen. In addition to this, the important thing is that the euro yen bond markets are more favorable than Samurai and domestic markets because of low commission rates, a smooth issue proce- dures, and the market liquidity for bonds. In other words, the problem is that the Tokyo markets involve such obstacles which should have seem removed.
Table 7 External bonds issues of JapanY 10 billion
1990 1991 1992 1993 1994
Overseas bond issues Euro yen issues
Rate of Euro yen bond (%)
516.9 105.4
793.5 324.9
578.9 502.0
257.4 288.0
20.4 40.9 44.5 57.4
191.6 139.4 72.8 Source : Culculated from Financial Market Trends (60) and Shauken Toukei Nenpou, 1994.
128 A re A 32 M 3 -(273)
Table 7 shows a rate and an amount of euro yen bond issued by Japan in the external bonds issues . A rate of euro yen bond issued continued to grow every year, to 72.8 percent in 1994. Of course, this is the reason why overseas bond issues of Japan declined to 1 ,916 billion yen. But even so, as a rate of euro yen bond issues increased beyond 50 percent
, against the overseas bond issues since 1993 , it is clear that foreign financing of Japanese companies has a tendency to concentrate on euro yen bond issues.
And so, continuously, Table 8 draws a comparison of the domestic bond issues and euro yen bond issued by Japanese . Especially, a rate of euro yen bond issues of Japan against the domestic bond issues is extremely high
, over 50 percent during 1991 and 1993 . Judging from this, we can recognize a phenomenon of the hollowing out in the Japanese bond market in these terms.
Table 8 Domestic bond and Euro Yen bond issued by Japanese Companies Y 10 billion
1990 1991 1992 1993 1994
Domestic bonds Euro yen bond
Rate of Euro yen bond (%)
548.0 105.4 19.2
375.9 341.1 324.9 257.4
86.4 75.4
530.1 288.0 54.3
564.7 139.4 24.7
Source; Culculated from Financial Market Trends (60) and Shouken Toukei Nenpou, 1994.
What we have tried to show in this section is why euro markets are preferred to raising yen, not to domestic markets . If Japanese companies preferred continuously to issue in the euro yen bond markets than domes- tic bond markets, Japanese bond markets will be inevitable to fall into the hollowed out description. It is necessary to make a convenient market for resident and non-resident borrowers by putting Japanese bond market in order. It is certain that the euro market will continue to expand due to greater internationalization. Furthermore, investment and financing are
(272) TinheJapan Hollowing out of the Capital Markets and the Corporate Financing 129 becoming greater in the foreign markets. Accordingly, the problems which Japanese bond market need to solve are to try to create conditions similar to those found in the euro markets, and which correspond with
greater internationalization.
To this end, on January 1995, Tokyo Stock Exchange(TSE) announced deregulations for the securities market. First of all, they improved the regulations relative to the listing for foreign companies as follows.
(a) TSE admits a listing application from such foreign companies even if their stock has not been listed on foreign stock exchange.
(b) TSE accepts a foreign applicant if the necessary financial docu- ments are submitted, even though within a financial year they make a large merger.
(c) The usual guideline about the scale of listed companies has been repealed, and only eligibility criteria is applied as follow ; namely, shareholder's equity or net asset must be a minimum of 10 billion yen, and pre tax profits are a minimum of 2 billion yen for last 3 years.
(d) The new rule for dividend payments that have to paid for the latest financial year instead of 3 years is applied to foreign applicant. This rule does not apply to foreign applicant that is to be privatized.
(e) Applicants must maintain the liquidity of stocks and the number of shareholder must be a minimum of 1000 to enable them to keep such liquidity.*
(*For these see TSE Fact Book 1995, pp. 2 and 3 about the details of the rule)
The Japanese Ministry of Finance also announced a relaxation relative to international bond trading, and introduced the all inclusive licence rule for issuing of euro yen bonds and Samurai bonds by non-resident, and equally to foreign bond issues by Japanese. This rules imply that those
130 A fftda 32 AM 3(271)
entities were enabled to issue bond under licence at the beginning of it s financial year. These rules were applied on 1st April 1995
. Furthermore, the Ministry of Finance allowed a primary sale of euro yen bond into Japan by non-resident, including sovereign and its relatives from January
1996.
The Ministry of Finance also put into practice 4 points of deregulation relating to bond markets to accord with the greater internationalizatio
n of capital markets. Those points are ; first , to abolish a criterion for eligible bonds ; second, to establish satisfying disclosure rules ; third
, to admit the issuing of bonds with warrants of "over-the -counter registered com - panies" ; fourth, to abolish the financial standard rule that should be satisfied for issues of bonds . The above amended rules come into effect on 1st January 1996.*
(* For the above rules in detail, see Junich Naito , "Tekisai Kijun no Kihonteki
Minaoshi ni Tsuite" Kousyasai Geppou , pp. 10 and 22, April 1995.)
All those deregulations in Japan are aim to eliminate the hollowing out of the domestic capital markets by proceeding to liberalize and increase the efficiency of those markets. Of course , currently, it is an effective way to solve those problems. we consider that it is a necessary condition and a useful method. But the important thing in Japan is that the Japanese companies have to bring up individual shareholders and take a positive attitude to foster securities markets . Japanese companies thus far , if anything, did not pay much attention to the shareholders position . In the next section, we discuss the financial performance of Japanese companies in that content.
(270) The Hollowing out of the Capital Markets and the Corporate Financing in Japan
131
3 An assessment of Corporate Finance and the Capital Market in Japan
Capital market is a main source for capital raising for corporate finan- cial activities. To maintain an effective market for the listed stocks far more is needed than relaxing various rules. Here we discuss the present state of Japanese corporate finance in relation to the stock market.
Five years have passed already since stock market in Japan was de- pressed. The probability of hollowing out will always be present and a lot of difficulty will arise in Japanese financial system from this change. The
value of the stocks of the 1st listed on the TSE declined 178 trillion yen from March 1990 to March 1995. The recession of the stock market since January 1990 shook the Japanese companies that have depended on hidden financial income, like unrealized profits. Accordingly, it is impor- tant to rebuilt the capital market to ensure an efficient capital allocation in the future. One method that has recently been tried is to stimulate a "mini stock market" and the market in over-the-counter registered companies.
The Ministry of Finance and Japan Securities Dealers Association decid- ed to establish the "mini stock market" to enable investors to buy and sell stocks listed on the TSE with a minimum of one tenth of previous amounts of funds. This system is such that it enable to trades to be undertaken in small lots of 100 units. "Mini stocks" which are traded in the over-the-counter market are stocks of companies without listing on the stock exchange, and same price on the stock exchange is applied to stock on the "mini stock market".
Especially, an assignment of stock market in Japan was how to protect the flight from the market of individual stockholders. Also in Japan, minimum level for stock investment was high in comparison with Europe
132 Ft# ;lit 0 3 2 A 3 (269)
and United States of America. Mini amount for stock investment is 310 thousand yen in America, 5 thousand yen in France , 35 thousand yen in Germany, 450 thousand yen in Great Britain . But in Japan, it is most high of 910 thousand yen(For these see Nihon Keizai newspaper , 19th April 1995).
Japanese stock markets have always centered on the needs of corporate investors, and in addition , many listed stocks have cross holdings by corporate investors. Accordingly , Japanese stock market is not very acces- sible for individual investors .
From July 1995, when the mini stock market was founded
, Japanese investors will be able to invest to stocks with on average amounts under 90 thousand yen. Individual investors are able to invest in high grade stocks with unit price of one tenth than before , and therefore, it is possible to call on funds from individual investors into the capital market . At the present, in Japanese stock markets, over-the-counter markets are strong- ly expected to prosper for the middle scale companies in comparison with 1st listed markets which remain in depress . Developing over the-cou- nter market provides a chance to raise funds for many middle scale companies. Therefore, it is now one of the main methods so as to recover the efficiency of markets by introducing competition between the 1st listed market and the over-the-counter market .
Some measures are exercised to recover the stagnant stock markets in Japan, in order to return individual stockholders to stock market . One of important thing is that Japanese companies have to improve their finan - cial activities, such as stockholding structures , payout ratio and a rate of return on equities as compared with before , and that it makes stock markets able to anticipate increases of the rate of return on stocks .
Figure 2 describes the stockownership in all listed companies , and those have not changed. On March 1994, a rate of shareholding by financial
(268) The Hollowing out of the Capital Markets and the Corporate Financing in Japan
Figere 2 Shareownership in JAPAN
70 60 50 40 30 20 10
Change Shareownership
Individuals & Others (Excluding Foreigners)
Financial Institutions
(Excluding Investment Trusts)
Foreigners
133
Source : TSE, Fact Book 1995, p. 73.
institutions and business corporations are 43.8 percent and 23.9 percent respectively. By contrast, individuals & others are 23.7 percent, as low as ever. Although a rate of shareholding in business corporations and finan- cial institutions in total showed a slight decrease from 69.2 percent in 1992 to 67.7 percent in 1994, it means that they sold out their stocks partly in order to obtain a hidden financial income. This is not to say that the mutual stockholding structures became greatly changed. It is necessary for the efficiency of stock market to abolish the tax on securities trading,
to amend the double taxation of dividends and to cut down to the international level of corporate income tax. In addition to these, there should also be changed in the presentation of financial results by corn-
134 ift Ae %32AM 3 (267)
panies.
Table 9 Business Results and Listed Companies)
Distribution of Profits (All Non---Financial
1988 1989 1990 1991 1992 1993 1994 No. of Companies
Total Liabilities & New Worth Amount of Shareholders' Equity Current Profits
Financial Expenses After-tax Profits
Amount of Cash Dividends Shareholders' Equity Ratio Ratio Before--Interest Current
Profits to Total Assets Ratio of After-tax Profits to
Shareholders' Equity (ROE) Ratio of Dividends to Shareholders'
Equity
Dividend Payout Ratio
(Y. trils.)A (Y trils.)B (y trils.)C (Y trils.)D (Y trils.)E (Y trils.)F (%)B/A (%) (C+D)/A (%)E/B (%)F/B (%)F/E
1,620 1,666 1,797 250.2 282.8 340.3 68.7 80.2 100.1 10.0 12.6 14.6 5.7 5.9 7.1 4.5 5.8 7.1 1.7 1.9 2.2 27.4 28.4 29.4 6.5 6.9 6.8 7.0 7.8 7.7 2.6 2.6 2.4 37.1 33.0 31.7
1,868 373.9 110.4 15.3 9.3 7.6 2.4 29.5
6.8 7.2 2.2 31.3
1,905 388.7 116.7 13.3 9.4 6.7 2.4 30.0
5.9 5.9 2.1 36.2
1,920 389.2 119.0 10.2 7.9 4.5 2.4 30.6
4.7 3.8 2.0 53.3
1,968 394.3 122.8 8.5 7.1 3.4 2.2 31.1
3.9 2.8 1.8 65.9 Source ; TSE, Fact Book 1995, p. 33,
Table 9 explain the business results and distribution of profits . In this Table, Shareholders' Equity Ratio increased by 7.9 percent, as compared with ten years ago to record high of 31 .4 percent in 1994, because many Japanese companies have gathered a lot of equity capital by carrying out the equity financing, taking advantage of the opportunity of high stock prices during the bubble economy. However, on the contrary, Current Profits and After-Tax Profits have decreased in three consecutive years as many companies were affected by the decline of sales and the increase of fixed cost. Equipment investment and the consumers' demands have suffered from depression, and this affected company performance . And the Ratio of Before-Interest Current Profits to Total Assets , that is general profitability for the companies, decline to historical low of 3.94 percent.
In 1993, the Ratio of Current Profits to Equity and the Ratio of Return
on Equity (ROE), calculated from this data, shows a decrease over five
(266) T. Hollowing out of the Capital Markets and the Corporate Financing in Japan 135
consecutive years. Moreover, Amount of Cash Dividends decreased to 2.2 trillion yen in 1994. But Dividend Payout Ratio amounted to historical high of 65.86 percent, because many Japanese companies left dividends despite reduced profit margins. Dividend Payout Ratio has shown a declin- ing trend in the year when profits increased as compared with previous years, but moved the other way in the year when profits decreased.
This is because Japanese companies in general trend to pay dividends with a certain fixed rate vis-a-vis the face value of a stock regardless of
profit level. At present, such a custom of payment system is meaningless in recent times when market price remain at high levels. It must be noted that Japanese companies need to pay dividends according to their profit margin instead of on the face value of their stock.
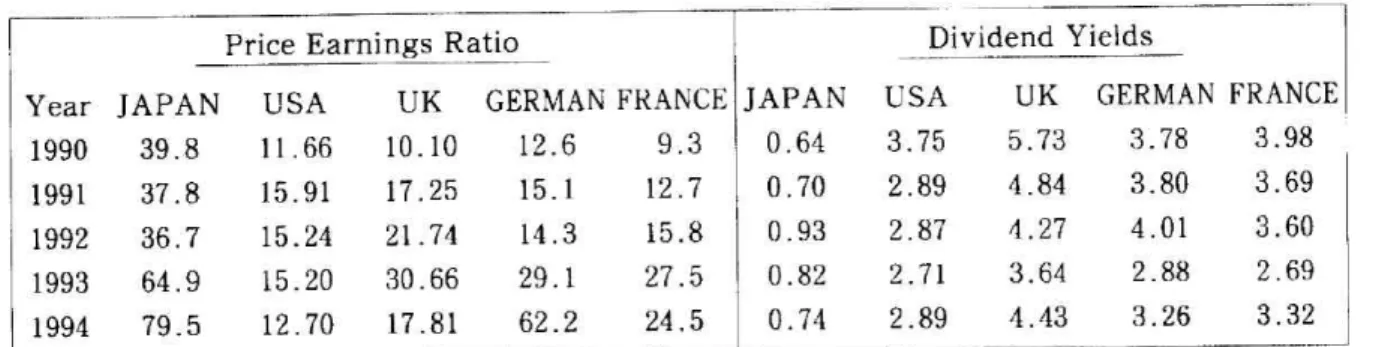
Table 10 Price Earnings Ratio & Dividend Yields
Price Earnings RatioDividend Yields
Year JAPAN USA UK GERMAN FRANCE JAPAN USA UK GERMAN FRANCE
1990 39.8 11.66 10.10 12.6 9.3 0.64 3.75 5.73 3.78 3.98
1991 37.8 15.91 17.25 15.1 12.7 0.70 2.89 4.84 3.80 3.69
1992 36.7 15.24 21.74 14.3 15.8 0.93 2.87 4.27 4.01 3.60
1993 64.9 15.20 30.66 29.1 27.5 0.82 2.71 3.64 2.88 2.69
1994 79.5 12.70 17.81 62.2 24.5 0.74 2.89 4.43 3.26 3.32
Source : Tokyo Stock Exchange, °Toushou Youran Fact Book", 1995.
As Table 10 also shows, the Japanese Price Earnings Ratio(PER) is high of 79.5 in comparison with other countries, and the conditions of high stock price is still continuing. As this ratio indicates how times the current stock price against earnings per stock is, those high levels in Japan makes
it difficult for individual investors to enter the stock markets.
Furthermore, Japanese Dividend Yield is always less than 1 percent, low
of 0.74 percent in 1994 in spite of other countries always being over 2
percent. The dividend policy of Japanese companies tends to generalize
the dividend level to that of the interest level since the stocks are issued at
136 !p1JS M 32 3(265)
the market price rather than at par value . In those circumstances, it seems reasonable to say that, dividend which stockholders obtain is certainly the same to interest or less than it.
Moreover, as we consider that Japanese official discount rate is record low of 1 percent from January 1995, dividend yield in Japan as Table 10 shows, is too low at under 1 percent . Japanese companies must recognize why stock investment has low attractions for individual investors
, and what kind of dividend policy is suitable for the position of stockholders .
4 Conclusion
We have discussed whether the Japanese capital markets suffer from the hollowing out in the international securities investments , and also, what are the implications of that for the financial policy of companies .
Corporate capital and funds always move into the efficient markets seeking profitability. As we already noticed , the Japanese capital market is lossing its efficiency, and its attractions for stockholders , because of crossholding of stock and the financial behavior of companies , such as distribution of income. It is important . that, first, some regulations and rules have to be relaxed as found on the international and euro markets . In addition, it is desirable to ensure that individual investors are able to invest in securities with safety.
In those cases, it is very important programme in Japan to see how to improve the mutual stockholding between companies , and to promote the transition of stockownership to individuals .
Second, the Japanese companies must change their attitudes to individ- ual stockholders concerning dividend policy , dividend payout ratio and other various ratios already described. Especially , in 1980s, the Japanese companies has been developed by using high stock price in the capital
(264) T. Hollowing out of the Capital Markets and the Corporate Financing in Japan 137 markets, which has given large companies a lot of hidden financial income or hidden assets.
After the bubble economy burst in 1990, Japanese companies are now troubled with debt finance because of raising funds by excessively equity
financing. It is reason why companies are unable to convert debt raised into equity capital because of low stock price than before. Accordingly, a priority for Japanese companies is to improve their attitudes that depend on hidden financial income and its assets, and to establish effective capital markets for raising funds and investment.
References
(1) BIS, Recent Innovations in International banking, April 1986.
(2) Koizumi, R. "London Shizyo Ni Okelu Nihonkabu Torihiki Ni Tsuite", Faina- nsu, March 1995.
(3) Kokusai Hikiuke Kyoukai "1994 nen No Honpou Gaisai No Hakkou Zyokyo", Kokusai Hikiuke Geppo, No. 462, 1995.
(4) Nakazawa, Y. "Kokusai Kinyu Senta Toshiteno Tokyo Sizyo No Syourai Ni Tsuite", Keizai Geppo, November 1994.
(5) Naito, Z. "Tekisai Kijun No Kihonteki Minaosi Ni Tsuite", Kousyasai Geppo, April 1995.
(6) Okazaki, K. "Heisei 6nenchu No Kyojusya Gaisai Hakko No Douko", Kokusai Kinyu, May 1995.
(7) OECD Financial Markets Trends, No. 60, Februrary 1995.
(8) Shirota, Z. London No Kikantousika To Shouken Shijyo Houritsu Bunkasya,
1995.
(9) Syudo, M. "Kinyu Shijyo No Kasseika To Kinyu Inobeisyon", Nichigin Kotari, No. 36, 1994.
(10) TSE. Tosyo Youran, 1995.
(11) TSE. Syouken, January 1995.
(12) TSE. Gaikoku Kabushiki Shijyo No KinouKyouka Ni Tomonau Jyoujyo Syoki- soku Nadono Kaisei Ni Tsuite.
(13) Ueda, Y. "Nihon Kinyu Kyougi", Kousyasai Geppo, March 1995.
September 1996