九州大学学術情報リポジトリ
Kyushu University Institutional Repository
末梢血細胞とEBウィルス感染型不死化リンパ球細胞 株におけるゲノムワイドなDNAメチル化の比較解析研 究
谷口, 愛樹
https://doi.org/10.15017/1928615
出版情報:Kyushu University, 2017, 博士(理学), 課程博士 バージョン:
権利関係:
Genome-wide DNA methylation analysis in peripheral blood cells and Epstein-Barr virus-transformed lymphoblastoid cell lines
Itsuki Taniguchi
Division of Genomics,
Medical Institute of Bioregulation,
Kyushu University
i
Contents
Abstract --- ii
General introduction --- 1
Chapter 1: Methylation level measurement and methylation site selection --- 6
Chapter 2: Global difference between PBCs and LCLs --- 8
Chapter 3: Association with CpG islands --- 16
Chapter 4: Association with distance from transcription start site --- 18
Chapter 5: Association with promoter type --- 21
Chapter 6: The methylation level difference in age-associated methylation site 25 Discussion --- 27
Conclusion --- 28
Acknowledgements --- 30
Funding --- 30
Abbreviations --- 30
References --- 31
Supplementary files --- 36
Appendix --- 38
ii Abstract
DNA methylation profiles in epidemiological studies may uncover the molecular mechanisms through which genetic and environmental factors contribute to the risks of multifactorial diseases.
There are two types of commonly used DNA bioresource, peripheral blood cells (PBCs) and Epstein-Barr virus (EBV)-transformed lymphoblastoid cell lines (LCLs), which are available for genetic epidemiological study. Recently, several groups showed a substantial difference in DNA methylation status between them using the relatively small size of paired samples. To confirm and extend the results, I here analyzed the methylation status of autosomes for 192 and 92 DNA samples obtained from PBCs and LCLs, respectively using the Human Methylation 450K array.
After excluding SNP-associated methylation sites and low call sites, 400,240 sites were subjected to analysis using a generalized linear model with cell type, sex, and age as the independent variables. I found that the large proportion of sites showed lower methylation level in LCLs in comparison with PBCs, which is consistent with previous reports. I also performed gene ontology (GO) enrichment analysis with the genes containing the significantly methylated sites, and found that the GO terms correlated with development are enriched. This trend is seen in the genes whose expression are changed whether the cells are infected with EBV. Furthermore, I investigated the correlation between DNA methylation level and gene expression in the differentially methylated sites, and it is uncovered that there is no significant correlation. Therefore, the DNA methylation changes correlate with gene expression change indirectly, and there may be various factors in the regulation of gene expression. I also found that significantly different methylation sites tend to be located on the outside of CpG island and in the region relatively far from transcription start site.
In addition, I observed that the methylation change of the sites in the low-CpG promoter region
was remarkable. Finally, it was shown that correlation between chronological age and aging-
associated methylation sites in ELOVL2 and FHL2 in LCLs was weaker than that in PBCs. In
iii
conclusion, I found that the methylation levels of highly methylated sites of the low-CpG-density
promoters in PBCs decreased in the LCLs, suggesting that the methylation sites located in low-
CpG-density promoters could be sensitive to demethylation in LCLs. Despite being generated
from a single cell type, LCLs may not always be a proxy for DNA from PBCs in studies of
epigenome-wide analysis attempting to elucidate the role of epigenetic change in disease risks.
1 General introduction
Epidemiological study in multifactorial diseases
Recent years, human genome analysis technology is developed dramatically, and we have become possible to identify disease-related DNA methylation changes at the genome-wide level.
DNA methylation is one of the important epigenetic factors in the regulation of gene expression. In addition to sequence variants, it is increasingly accepted that this DNA modification may be implicated in the susceptibility of various multifactorial diseases (1–3).
Since accomplishment of human genome project and improvement of the gene analysis technology, many studies targeted the association between gene alteration and disease have reported. Specifically, a lot of genes responsible for the hereditary disorder have been identified.
However, there is some disease which is not able to identify the responsible gene only by analyzing the genome sequence. Such disorder caused by a combination of genetic and environmental factors, therefore these are called multifactorial disorders. Whereas most of the genetic factors have the congenital effect to disorder, the environmental factors give acquired change to the genome. The genome modification from environmental factors is called epigenome.
Epigenome
The epigenome is defined by Waddington et al. in 1942 (4, 5). Initially, it was defined to explain the mechanism of the gene expression change that was important to the cell differentiation at the developmental stage.
Today, DNA methylation, histone modification, and nucleosome are studied actively in the
study of the epigenome. In particular, a lot of researches of DNA methylation are supported and
conducted by research organizations, for example, the Cold Spring Harbor Laboratory, American
Association for Cancer Research (AACR), the Gordon Research Conferences (GRC), the
2
Federation of American Societies for Experimental Biology (FASEB), and Keystone Symposia.
In addition, large-scale cooperative researches are launched in Europe (The Networks of Excellence ‘The Epigenome’ and ‘EpiGeneSys’), the USA (US National Institutes of Health (NIH) Roadmap Epigenomics Project and ENCODE), Canada, Asia, and worldwide (the International Human Epigenome Consortium (IHEC)). Therefore, the epigenome study, in particular, DNA methylation, is gathering attention from all over the world.
DNA methylation
In most of the DNA methylation studies, the researchers focus on the 5-methylcytosine in CpG dinucleotides. There are several types of research that report the methylation of non-CpG sequence in some species (6–8), however, which functions remain unknown.
Most of the effects of DNA methylation on gene expression are suppression (9). X- chromosome inactivation, imprinting, and some tissue-specific gene are common phenomena by DNA methylation alteration. Additionally, it is known that the DNA methylation changes in CpG- rich regions known as CpG islands (CGIs) in the transcriptionally regulated region, for example, promoter, enhancer, and insulator, are closely associated with gene expression.
The inducer of DNA methylation change
The DNA methylation change is induced by various factors. Tobacco smoke is one of the
most popular inducers of DNA methylation change (10–20). In particular, it is revealed that
smoking in pregnancy period is strongly associated with the global DNA methylation change in
the fetus (11, 19, 21). Additionally, traffic-related air pollution is also correlated with DNA
methylation alteration (22–24). Furthermore, aging is the key factor of global DNA methylation
change (25, 26).
3 DNA methylation change in cancer
In cancer, the abnormality of DNA methylation status has reported. It is revealed that mutations and/or deletions in tumor suppressor genes are related to cancer development.
Additionally, in the recent cancer epigenome study, it is revealed that the alteration of DNA methylation in tumor suppressor gene reduce its expression, and induce cancer development (27).
The study of epigenome alteration in various types of the tumor was performed, and its data are available in The Cancer Genome Atlas (https://cancergenome.nih.gov/).
Major bioresources for epidemiological studies
Because it is essential to use relatively large samples in searching for genes that are susceptible to multifactorial diseases, the DNA sources are limited to some cell types. The peripheral blood cells (PBCs) are one of the suitable cell types for analysis.
Epstein-Barr Virus (EBV) -transformed immortalized lymphoblastoid cell lines (LCLs) are also used to obtain DNA. EBV, also known as human herpesvirus 4 (HHV-4), were found by Epstein et al. (28) in the tumor cell from the patient of Burkitt’s lymphoma. This finding is the first evidence of the tumor induced by viruses. EBV infection may also be associated with the development of the Hodgkin’s disease, undifferentiated nasopharyngeal carcinoma, immunoblastic lymphomas arising in immunocompromised individuals, and T and NK cell lymphomas (29). LCLs can be generated from both healthy individuals and patients and supply an unlimited source of genomic DNA. Additionally, LCLs and PBCs have been successfully used for gene expression analyses (30).
However, it is known that DNA methylation status varies between cell types (31). Therefore,
to extend our knowledge of the difference in DNA methylation status between LCLs and PBCs is
important in human population studies that use these DNA sources to elucidate the epigenetic
4 risks for multifactorial diseases.
Study design
Figure 1 shows the general flow of this study. I designed experiments to compare the DNA methylation status between LCLs and PBCs at an epigenome-wide level using approximately 400,000 methylation data sites from 92 LCL and 192 PBC samples obtained using the Human Methylation 450K array. I analyzed global differences in methylation profiles and the degree of difference in methylation level of each site in terms of location (inside or outside the CpG island, the distance from transcription start site and promoter type) between LCLs and PBCs.
Additionally, the association strength of methylation levels at the aging-related methylation sites
in FHL2 and ELOVL2 with chronological age was compared between LCLs and PBCs.
5 Figure 1: The study design.
Illumina HumanMethylation 450 K
PBCs: 192
samples Fukuoka-based cohort studyLCLs: 92
samplesRiken Bioresource Center Cell Bank
473,864 methylation sites
400,240
methylation sitesGenomic Region Global Difference
Gene Ontology Analysis Principal Component Analysis
Volcano Plot
Gene Expression
CpG Island (CGI)
CGI and TSS
Transcription Start Site (TSS)
Promoter Type
Age associated methylation site
•low call ratio
•dbSNP
•outlier value
6
Chapter 1: Methylation level measurement and methylation site selection Subjects
EBV-transformed LCLs derived from 92 healthy Japanese subjects were provided by the Riken Bioresource Center Cell Bank (32). PBCs were obtained from 192 participants of a baseline survey of the general population from a Fukuoka-based cohort study (33, 34). This study was performed in accordance with the principles of the Declaration of Helsinki and was approved by the Institutional Review Board at Kyushu University.
DNA methylation chip assay
Genomic DNA was bisulfite-treated using the EZ-96 DNA Methylation Kit (Zymo Research Corporation, Orange, CA), which combines bisulfite conversion and DNA cleanup in a 96-well plate. Genome-wide DNA methylation profiles were obtained using the Illumina HumanMethylation450 BeadChip (Illumina, San Diego, CA) according to the manufacturer’s instructions. The GenomeStudio V2011.1 (Methylation Module version 1.9.0) was employed to determine the beta values that reflected the estimated methylation level for each CpG site. The beta value was calculated as: Max (signal for methylation, 0) / [Max (signal for methylation, 0) + Max (signal for unmethylation, 0) + 100]. Using this metric, the DNA methylation level was represented by a number between 0 (no methylation) and 1 (complete methylation). The signal intensities were normalized to the internal controls and background prior to beta value calculation.
Selection and classification of DNA methylation sites
The flowchart of methylation sites selection is shown in Figure 2. Among 473,864
methylation sites on the autosomes, 1,305 sites showing low calls (< 0.95) were removed for
further analyses. To eliminate SNP-associated methylation sites, I screened the nearest SNP for
each methylation site using the dbSNP135 database (SNPs categorized in weight = 1 group,
7
http://www.ncbi.nlm.nih.gov/SNP/). I found 72,318 sites in which SNPs were located on the C or G site. Additionally, one methylation site demonstrated an outlier value. After removing these sites; 400,240 methylation sites on the array were available for further analyses.
Statistical Analysis
To evaluate the difference in methylation level of each site, the data were analyzed using modeling individual Illumina beta values using a generalized linear model (glm) with cell type (LCLs or PBCs), age and sex as the independent variables. P-values and the difference in methylation level for each cell type were obtained. The statistical power to detect methylation differences of 0.25 and 0.5 between 192 PBCs and 92 LCLs was estimated to be 50.2% and 97.5%, respectively at a significance level of P = 0.05 using G*Power 3.1 software (35).
Figure 2: The selection of methylation sites.
The methylation sites showing low call ratio, associated with SNPs, and outlier value are removed in this study, and remained 400,240 sites are used in follow analysis.
methylation sites on autosomes
473,864
available methylation sites
400,240
low call ratio(<0.95)
1,305
Outlier Value
1
Associated with SNPs (dbSNP135)
72,318
positionsite C G-2 -1 0 +1 +2
8
Chapter 2: Global difference between PBCs and LCLs Cluster analysis
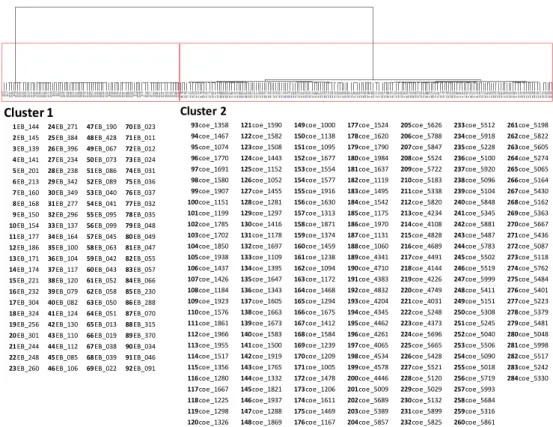
To assess the global difference of DNA methylation levels between LCLs and PBCs, I performed a hierarchical cluster analysis using the methylation data of 400,240 sites on autosomes obtained using the 450K methylation array. Figure 3 shows the results of hierarchical cluster analysis. The distance was calculated at Euclid distance and analyzed with the Ward method. Red rectangles show two major clusters. Sample names are shown as a list below the dendrogram.
LCLs and PBCs were completely separated into different clusters by whole epigenome methylation status.
Figure 3: Hierarchical cluster analysis.
Upper part shows the dendrogram of the cluster analysis. Lower part shows the list of the samples classified in each cluster.
Cluster 1
1EB_144 24EB_271 47EB_190 70EB_023 2EB_145 25EB_384 48EB_428 71EB_011 3EB_139 26EB_396 49EB_067 72EB_012 4EB_141 27EB_234 50EB_073 73EB_024 5EB_201 28EB_238 51EB_086 74EB_031 6EB_213 29EB_342 52EB_089 75EB_036 7EB_160 30EB_349 53EB_040 76EB_037 8EB_168 31EB_277 54EB_041 77EB_032 9EB_150 32EB_296 55EB_095 78EB_035 10EB_154 33EB_137 56EB_099 79EB_048 11EB_177 34EB_164 57EB_045 80EB_049 12EB_186 35EB_100 58EB_063 81EB_047 13EB_171 36EB_104 59EB_042 82EB_055 14EB_174 37EB_117 60EB_043 83EB_057 15EB_221 38EB_120 61EB_052 84EB_066 16EB_232 39EB_079 62EB_058 85EB_230 17EB_304 40EB_082 63EB_050 86EB_288 18EB_324 41EB_124 64EB_051 87EB_070 19EB_256 42EB_130 65EB_013 88EB_315 20EB_301 43EB_110 66EB_019 89EB_370 21EB_244 44EB_112 67EB_038 90EB_034 22EB_248 45EB_085 68EB_039 91EB_046 23EB_260 46EB_106 69EB_022 92EB_091
Cluster 2
93coe_1358 121coe_1590 149coe_1000 177coe_1524 205coe_5626 233coe_5512 261coe_5198 94coe_1467 122coe_1582 150coe_1138 178coe_1620 206coe_5788 234coe_5918 262coe_5822 95coe_1074 123coe_1508 151coe_1095 179coe_1790 207coe_5847 235coe_5228 263coe_5605 96coe_1770 124coe_1443 152coe_1677 180coe_1984 208coe_5524 236coe_5100 264coe_5274 97coe_1691 125coe_1152 153coe_1554 181coe_1637 209coe_5722 237coe_5920 265coe_5065 98coe_1580 126coe_1052 154coe_1577 182coe_1119 210coe_5183 238coe_5096 266coe_5164 99coe_1907 127coe_1455 155coe_1916 183coe_1495 211coe_5338 239coe_5104 267coe_5430 100coe_1151 128coe_1281 156coe_1630 184coe_1542 212coe_5820 240coe_5848 268coe_5162 101coe_1199 129coe_1297 157coe_1313 185coe_1175 213coe_4234 241coe_5345 269coe_5363 102coe_1785 130coe_1416 158coe_1871 186coe_1970 214coe_4108 242coe_5881 270coe_5667 103coe_1702 131coe_1178 159coe_1374 187coe_1131 215coe_4828 243coe_5487 271coe_5436 104coe_1850 132coe_1697 160coe_1459 188coe_1060 216coe_4689 244coe_5783 272coe_5087 105coe_1938 133coe_1109 161coe_1238 189coe_4341 217coe_4491 245coe_5502 273coe_5118 106coe_1437 134coe_1395 162coe_1094 190coe_4710 218coe_4144 246coe_5519 274coe_5762 107coe_1426 135coe_1647 163coe_1172 191coe_4383 219coe_4226 247coe_5999 275coe_5484 108coe_1184 136coe_1343 164coe_1468 192coe_4832 220coe_4749 248coe_5411 276coe_5401 109coe_1923 137coe_1605 165coe_1294 193coe_4204 221coe_4031 249coe_5151 277coe_5223 110coe_1576 138coe_1663 166coe_1675 194coe_4345 222coe_5248 250coe_5308 278coe_5379 111coe_1861 139coe_1673 167coe_1412 195coe_4462 223coe_4373 251coe_5245 279coe_5481 112coe_1966 140coe_1583 168coe_1584 196coe_4261 224coe_5696 252coe_5040 280coe_5048 113coe_1955 141coe_1500 169coe_1239 197coe_4065 225coe_5665 253coe_5506 281coe_5998 114coe_1517 142coe_1919 170coe_1209 198coe_4534 226coe_5428 254coe_5090 282coe_5517 115coe_1356 143coe_1765 171coe_1005 199coe_4578 227coe_5521 255coe_5018 283coe_5242 116coe_1280 144coe_1332 172coe_1478 200coe_4446 228coe_5120 256coe_5719 284coe_5330 117coe_1667 145coe_1821 173coe_1206 201coe_5009 229coe_5029 257coe_5993
118coe_1225 146coe_1937 174coe_1611 202coe_5689 230coe_5132 258coe_5684 119coe_1298 147coe_1288 175coe_1469 203coe_5389 231coe_5899 259coe_5316 120coe_1326 148coe_1869 176coe_1167 204coe_5857 232coe_5825 260coe_5861
9 Principal component analysis
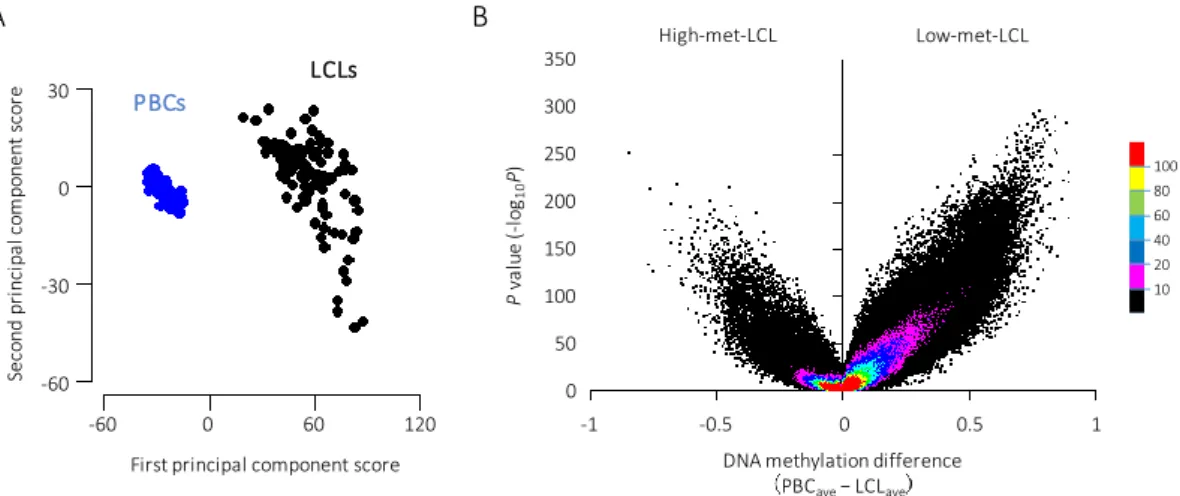
The results of the principal component analysis are shown in Figure 4A. The LCL and PBC groups were clearly distinguished by their first principal component score. In addition, the PBC samples were distributed within a narrow range, whereas the LCL samples showed a relatively wide range in the second principal component score. These results suggest that there is a global difference in DNA methylation levels between these cell types and that the levels are more diverse in LCLs than in PBCs.
Volcano plots
I then examined the difference in methylation level for each site using a glm adjusted for age and sex. As shown in the volcano plot in Figure 4B, the sites showing lower levels in LCL than in PBC were predominant (low-met-LCL group). The 138,871 sites (34.7% of the total) showed
−log
10(P-value) > 10; among these sites, 85.1% were in the low-met-LCL group. This inclination
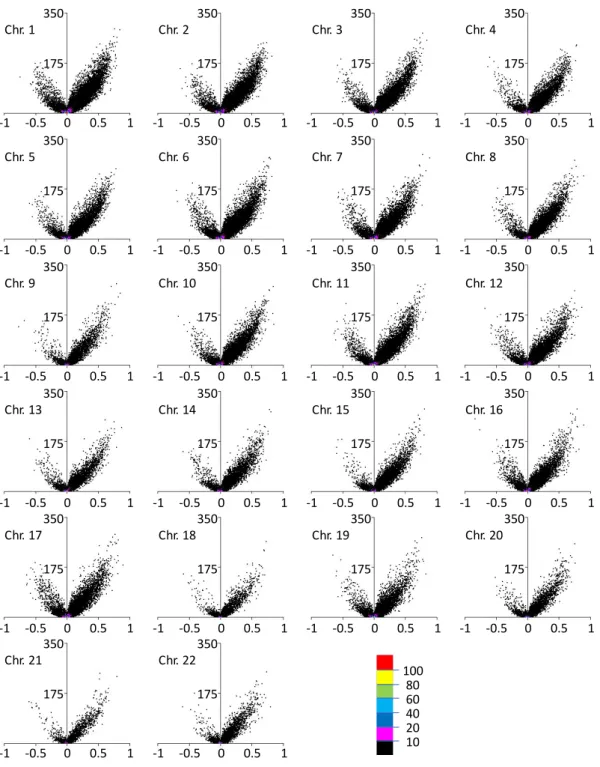
was observed in each autosome (Figure 5). Therefore, it was suggested that the main difference
in DNA methylation between LCLs and PBCs was hypomethylation in the LCLs and that the
change in methylation levels occurred globally in the autosomes.
10
Figure 4: Global difference in the DNA methylation level between the LCLs and PBCs (A) Principal component analysis (PCA) plot. PCA was performed using the methylation level of the 400,240 sites on autosomes. The LCL and PBC samples are shown in black and blue dots, respectively. (B) Volcano plot with the difference of the average of DNA methylation level on the x-axis and the P-value (−log
10(P-value)) obtained via glm analysis on the y-axis.
Each color shows the dot density (100 < n, 80 < n ≤ 100, 60 < n ≤ 80, 40 < n ≤ 60, 20 < n ≤ 40, 10 < n ≤ 20 and n ≤ 10 per unit area (0.002 × 1 for x and y-axis, respectively) in red, yellow, green, sky blue, blue, pink and black, respectively).
First principal component score
Second principal component score
-60 -30
120 0
-60 30
0
60
A
PBCs
LCLs
100 80 60 40 20 10
0 -0.5
-1 0.5 1
350 300 250 200 150 100 50 0 Pvalue (-log10P)
DNA methylation difference PBCave− LCLave
B High-met-LCL Low-met-LCL
11
Figure 5: Volcano plot for each autosomal chromosome.
Volcano plot for each autosome with the difference of the average of DNA methylation levels on the x-axis and the P-value (−log
10(P-value)) obtained via glm analysis on the y-axis. Each color shows the dot density (100 < n, 80 < n ≤ 100, 60 < n ≤ 80, 40 < n ≤ 60, 20 < n ≤ 40, 10 <
n ≤ 20 and n ≤ 10 per unit area (0.002 × 1 for the x-axis and y-axis, respectively) in red, yellow, green, sky blue, blue, pink and black, respectively).
100 80 60 40 20 10 350
175
0 0.5 1
-0.5 -1
Chr. 1
350
175
0 0.5 1
-0.5 -1
Chr. 2
350
175
0 0.5 1
-0.5 -1
Chr. 3
350
175
0 0.5 1
-0.5 -1
Chr. 4
350
175
0 0.5 1
-0.5 -1
Chr. 5
350
175
0 0.5 1
-0.5 -1
Chr. 6
350
175
0 0.5 1
-0.5 -1
Chr. 7
350
175
0 0.5 1
-0.5 -1
Chr. 8
350
175
0 0.5 1
-0.5 -1
Chr. 9
350
175
0 0.5 1
-0.5 -1
Chr. 10
350
175
0 0.5 1
-0.5 -1
Chr. 11
350
175
0 0.5 1
-0.5 -1
Chr. 12
350
175
0 0.5 1
-0.5 -1
Chr. 13
350
175
0 0.5 1
-0.5 -1
Chr. 14
350
175
0 0.5 1
-0.5 -1
Chr. 15
350
175
0 0.5 1
-0.5 -1
Chr. 16
350
175
0 0.5 1
-0.5 -1
Chr. 17
350
175
0 0.5 1
-0.5 -1
Chr. 18
350
175
0 0.5 1
-0.5 -1
Chr. 19
350
175
0 0.5 1
-0.5 -1
Chr. 20
350
175
0 0.5 1
-0.5 -1
Chr. 21
350
175
0 0.5 1
-0.5 -1
Chr. 22
12 Gene ontology analysis
Additionally, to investigate the association between DNA methylation change and gene biological function, I performed gene ontology enrichment analysis. In this study, I annotated reference gene name from UCSC Genome Bioinformatics database (http://genome.ucsc.edu/index.html) to the 6,689 methylation sites located inside of gene region and have a significant difference of methylation level between PBCs and LCLs (−log
10(P-value)
> 100). The 3,779 genes were annotated to the methylation sites. The details of the result are shown in Table 1.
Then, I performed gene ontology (GO) enrichment analysis with DAVID (https://david.ncifcrf.gov/home.jsp), and the results in all sites, high-met-LCL, and low-met-LCL are shown in Supplementary Table 1, Supplementary Table 2, and Table 2, respectively. It is revealed that the GO terms associated with development are significantly enriched in low-met- LCL group (GO:0007275 (multicellular organism development), P-value of 1.27×10
-34; GO:0048731 (system development), P-value of 5.89×10
-32; GO:0048856 (anatomical structure development), P-value of 4.43×10
-29; GO:0044767 (single-organism developmental process), P- value of 5.27×10
-29; GO:0032502 (developmental process), P-value of 9.93×10
-29).
Table 1: Gene ontology analysis
GO Term site gene DAVID ID
Biological Process %
Cellular
Component %
Molecular Function %
All 6,689 3,779 3,524 2,973 84.4 3,146 89.3 2,936 83.3
High-met-LCL 568 427 408 366 89.7 385 94.4 378 92.6
Low-met-LCL 6,121 3,448 3,208 2,694 84.0 2,851 88.9 2,644 82.4
13 Table 2: GO term enrichment analysis in low-met-LCL
Term
(Biological Process) Description Count % P -Value FDR
GO:0044707 single-multicellular organism process 1,241 38.7 4.33E-36 8.80E-33 GO:0007275 multicellular organism development 1,048 32.7 9.49E-34 1.93E-30 GO:0032501 multicellular organismal process 1,409 43.9 2.75E-33 5.58E-30
GO:0048731 system development 938 29.2 4.24E-32 8.61E-29
GO:0048856 anatomical structure development 1,134 35.3 4.81E-30 9.77E-27 GO:0044767 single-organism developmental process 1,133 35.3 9.27E-30 1.88E-26
GO:0032502 developmental process 1,158 36.1 2.12E-29 4.30E-26
GO:0030154 cell differentiation 797 24.8 5.74E-26 1.17E-22
GO:0023052 signaling 1,236 38.5 5.50E-24 1.12E-20
GO:0044699 single-organism process 2,329 72.6 9.09E-24 1.85E-20
Term
(Cellular Component) Description Count % P -Value FDR
GO:0071944 cell periphery 1,168 36.4 3.76E-52 6.01E-49
GO:0005886 plasma membrane 1,141 35.6 3.71E-50 5.93E-47
GO:0044459 plasma membrane part 653 20.4 3.14E-40 5.01E-37
GO:0045202 synapse 243 7.57 6.75E-31 1.08E-27
GO:0097458 neuron part 367 11.4 7.46E-31 1.19E-27
GO:0005887 integral component of plasma membrane 414 12.9 1.43E-26 2.29E-23 GO:0031226 intrinsic component of plasma membrane 426 13.3 2.58E-26 4.12E-23
GO:0044456 synapse part 192 5.99 1.69E-23 2.70E-20
GO:0043005 neuron projection 262 8.17 5.05E-21 8.07E-18
GO:0030054 cell junction 344 10.7 7.10E-21 1.13E-17
Term
(Molecular Function) Description Count % P -Value FDR
GO:0022836 gated channel activity 122 3.8 9.34E-21 1.63E-17
GO:0022838 substrate-specific channel activity 148 4.61 1.60E-20 2.79E-17
GO:0005216 ion channel activity 143 4.46 5.88E-20 1.03E-16
GO:0046873 metal ion transmembrane transporter activity 141 4.4 8.58E-20 1.50E-16
GO:0005261 cation channel activity 112 3.49 3.32E-19 5.79E-16
GO:0022803 passive transmembrane transporter activity 152 4.74 6.51E-19 1.14E-15
GO:0015267 channel activity 151 4.71 1.35E-18 2.36E-15
GO:0015075 ion transmembrane transporter activity 209 6.51 8.37E-14 1.46E-10 GO:0005244 voltage-gated ion channel activity 72 2.24 1.56E-13 2.72E-10 GO:0022832 voltage-gated channel activity 72 2.24 1.56E-13 2.72E-10
14
Association with gene expression and DNA methylation
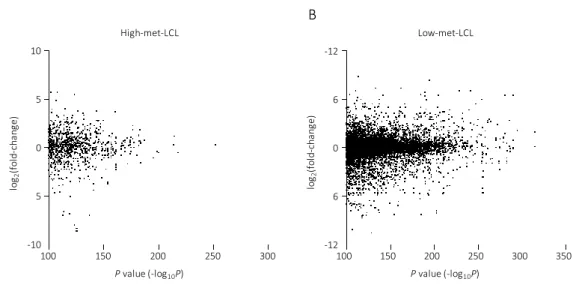
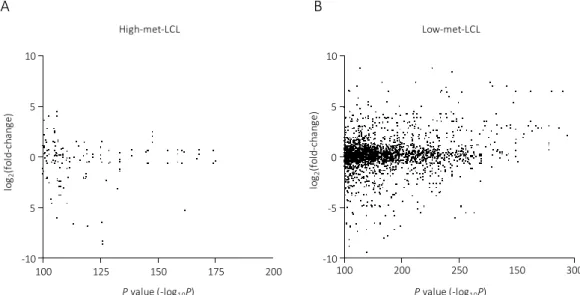
I also investigated the association with DNA methylation difference and gene expression. In this analysis, I used the gene expression data reported by Powell et al.(36). The association with DNA methylation difference between PBCs and LCLs and the changes of gene expression in the differentially methylated sites (-log
10(P-value) > 100) are shown in Figure 6. It is revealed that there is no positive correlation between methylation level and gene expression.
Figure 6: The association with DNA methylation difference and gene expression in genetic region.
Scatter plot with the P-value (-log
10(P-value)) obtained via glm analysis of DNA methylation difference between PBCs and LCLs on x-axis, and the ratio of gene expression change according to EB virus infection (log
2(gene expression (EBV
+) / gene expression (uninfected))) are on y-axis. The results in high-met-LCL group and low-met-LCL group are shown in Figure 6A and Figure 6B, respectively.
log2(fold-change)
A
Pvalue (-log10P)
High-met-LCL Low-met-LCL
B
Pvalue (-log10P) -12
6 0 -12
6
100 150 200 250 300
log2(fold-change)
100 150 200 250 300 350
0 10
5
5
-10
15
It is already known that the DNA methylation in promoter region has an effect on the gene expression (9). To investigate the correlation between methylation level and gene expression in detail, I performed a similar analysis in the methylation sites located in the promoter region (- 500 bp < TSS < 2000 bp). In Figure 7, there is a slight correlation between DNA methylation changes and gene expression.
Figure 7: The association with DNA methylation difference and gene expression in promoter region.
Scatter plot with the P-value (-log
10(P-value)) obtained via glm analysis of DNA methylation difference between PBCs and LCLs on x-axis, and the ratio of gene expression change according to EB virus infection (log
2(gene expression (EBV
+) / gene expression (uninfected))) are on y-axis. The results in high-met-LCL group and low-met-LCL group are shown in Figure 7A and Figure 7B, respectively.
High-met-LCL Low-met-LCL
A B
log2(fold-change) log2(fold-change)
Pvalue (-log10P) Pvalue (-log10P)
100 125 150 175 200 100 200 250 150 300
0 10
5
5
-10
0 10
5
-5
-10
16 Chapter 3: Association with CpG islands The annotation of CpG islands
Based on the CpG Islands (CGI) track of the UCSC table browser of the UCSC Genome Bioinformatics database (http://genome.ucsc.edu/index.html), the 400,240 sites on autosomes were classified into two groups, CGI-sites (135,674 sites, inside of CGI) or non-CGI-sites (264,566 sites, outside the CGI). Among the non-CGI sites, 95,625 sites were located near CGI (±2,000 bases) that were classified in a shore group.
CpG island and non-CpG island
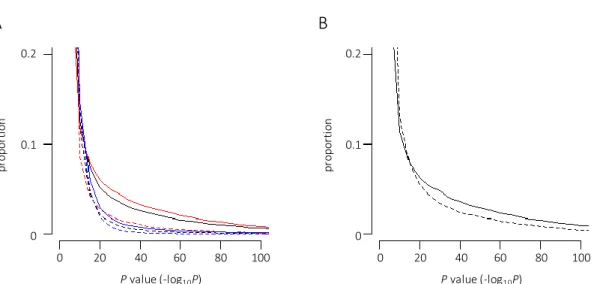
I next assessed the distribution of the difference in methylation levels between LCLs and PBLs in terms of the location of the site (inside or outside the CpG island) (named CGI-site or non-CGI-site). As shown in Figure 8A, the distribution of difference was dissimilar between them;
the proportion of the sites showing a low P-value was larger in the non-CGI-site group (black
solid line) than in the CGI-site group (black dashed line). This trend was apparent in the low-met-
LCL group (compare the red solid and dashed lines), whereas a dissimilarity of distribution was
not observed in the high-met-LCL group (compare the blue solid and dashed lines). These results
prompted us to further classify the non-CGI-sites into shore or non-shore groups because the CGI
shores were suggested to contribute to tissue-specific DNA methylation (37, 38). However, I did
not find significant differences in the distribution between the shore and non-shore group of the
low-met-LCL (Figure 8B). Taken together, these results suggested that the majority of
hypomethylation observed in the LCLs occurred at sites outside the CGIs regardless of shores.
17
Figure 8: Distribution of the differences in methylation levels between LCLs and PBLs in terms of CGI.
(A) The proportion of P-values obtained from non-CGI and CGI sites in all samples (black solid and dashed lines, respectively), non-CGI and CGI sites in the low-met-LCL group (red solid and dashed lines, respectively), and non-CGI and CGI sites in the high-met-LCL group (blue solid and dashed lines, respectively) are indicated. (B) The proportion of P-values obtained from the non-shore and shore sites (solid and dashed lines, respectively) in the non-CGI sites of the low- met-LCL group are indicated.
0.1 0.2
0
0.1 0.2
0
0 20 40 60 80 100 0 20 40 60 80 100
A B
proportion proportion
Pvalue (-log10P) Pvalue (-log10P)
18
Chapter 4: Association with distance from transcription start site Transcription start site position
The distance between the methylation site and the nearest transcription start site (TSS) was calculated using the NCBI RefSeq database. The physical positions on the human genome were based on the Genome Reference Consortium Human Build 37 (GRCh37, http://www.ncbi.nlm.nih.gov/assembly/).
Distance from TSS and DNA methylation difference
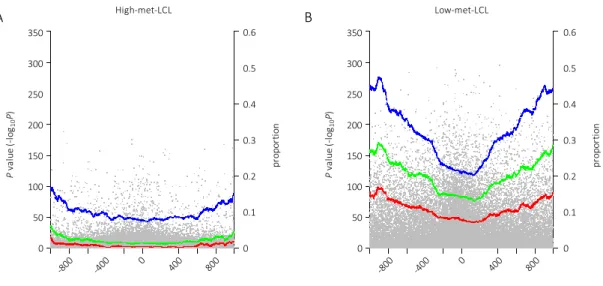
I further examined the relationship between the distance from the TSS and the difference in
DNA methylation levels observed among LCLs and PBCs. I plotted −log
10(P-value) for each site
against the distance from the nearest TSS (shown in gray dots in Figure 9) and indicated a
proportion of the site showing −log
10(P-value) > 10, 25 and 50 in blue, green and pink dots,
respectively (Figure 9). The proportion was calculated by dividing the number of the sites meeting
the P-value criteria by the total number of sites within ±50 bases of window size. I found that the
proportion of significantly different sites was lower near the TSS. For instance, approximately
25% of the sites near the TSS showed −log
10(P-value) > 10, whereas this proportion increased to
approximately 45% for the sites located approximately ±1,000 bases from the TSS in the low-
met-LCL group (blue dots, Figure 9A). This trend was also observed even in the lower P-value
threshold group (green and pink dots) and in the high-met-LCL group (Figure 9B).
19 Synergistic action of CGI and TSS
I then analyzed the sites showing −log
10(P-value) > 10 separately for CGI- and non-CGI-site groups. As shown in Figure 10, the proportion of non-CGI-sites near the TSS was high in both the low- and high-met-LCL groups (red and blue dots, respectively, Figure 10). However, the lowest proportion was observed near the TSS in the case of CGI-sites (orange and sky-blue dots for low- and high-met-LCL groups, respectively, Figure 10). These results suggested that the low CpG promoter would show a more significant difference in DNA methylation levels than the high CpG promoter.
Figure 9: Distribution of the differences in methylation levels between LCLs and PBLs in terms of TSS.
P-values were plotted against the distance from the nearest TSS (gray dots). The proportion of the sites with
P-values (−log10(P-value)) greater than 10 (blue dots), 25 (green dots) and 50 (pink dots) in a window size of ±50 bases were plotted. Figure 9A and Figure 9B show the results in the high-met-LCL group and the low-met-LCL group, respectively.
350
300
250
200
150
100
50
0 Pvalue (-log10P)
A
proportion
0 0.1 0.6
0.5
0.4
0.3
0.2
distance from transcription start site (base)
High-met-LCL Low-met-LCL
B
350
300
250
200
150
100
50
0 Pvalue (-log10P)
proportion
0 0.1 0.6
0.5
0.4
0.3
0.2
distance from transcription start site (base)
20 Figure 10: Synergistic effect of CGI and TSS
The proportion of the sites with P-values (−log
10(P-value)) greater than 10 obtained from non- CGI and CGI sites in the low-met-LCL group (red and orange dots, respectively), and from non- CGI and CGI sites in the high-met-LCL group (blue and sky-blue dots, respectively) in a window size of ±50 bases were plotted against TSS.
0 0.8
0.4
0.2 0.6
proportion
0 400 800
-400 -800
distance from transcription start site (base)
1000 600
200 -200
-600 -1000
21 Chapter 5: Association with promoter type Definition of promoter type
Of 400,240 probes, 159,688 demonstrated a TSS between -500 bases and +2,000 bases;
among these, 85,700 sites could be classified into high-CpG-density promoters (HCP), intermediate-CpG-density promoters (ICP) and low-CpG-density promoters (LCP), as reported by Mikkelsen et al. (39) (69,836, 10,719 and 5,145 in HCP, ICP and LCP, respectively).
Differentially methylated sites in promoter region
I analyzed the distribution of −log
10(P-value) in all, low- and high-met-LCL groups and
results are shown in Figure 11. It was shown that the proportion of differentially methylated sites
was higher in the LCPs than the HCPs. In the LCPs, the proportion of the sites showing −log
10(P-
value) > 25 was 30.7%, whereas that in HCPs was 4.1% in all sites (compare Figure 11A and
Figure 11G). This was more pronounced in the low-met-LCL group (compare Figure 11B, Figure
11C, Figure 11H and Figure 11I). The sites located in ICPs showed intermediate values between
HCPs and LCPs (Figure 11D, Figure 11E, and Figure 11F). These results suggested that the
methylation sites located in low CpG promoters could be sensitive to demethylation in LCLs.
22
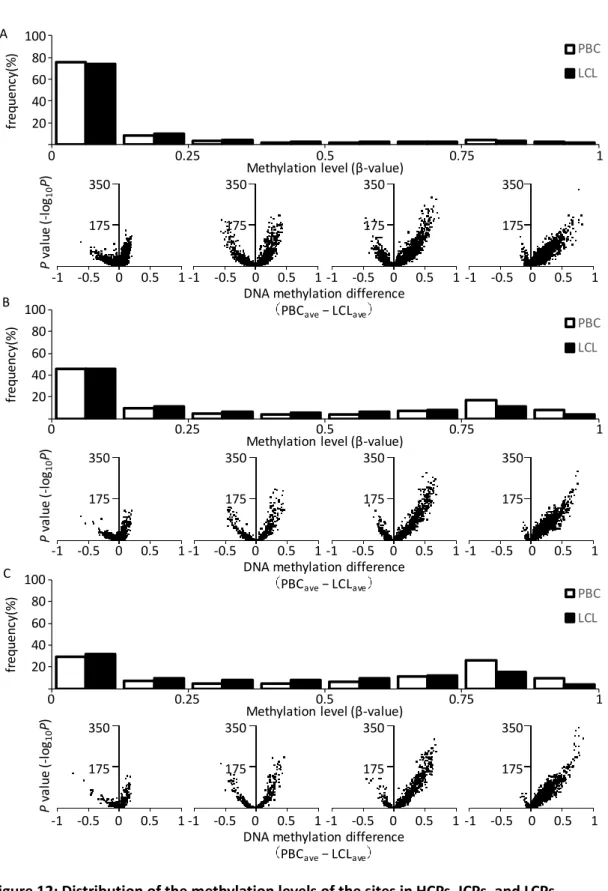
To further assess promoter type differences, I compared the HCPs, ICPs, and LCPs methylation level profiles. As shown in Figure 12, nearly half of the sites in ICPs and LCPs showed more than 0.6 methylation levels, whereas almost all sites in HCPs were hypomethylated in PBCs. Additionally, it was observed that the methylation levels of highly methylated sites of the LCPs decreased in the LCLs. Therefore, I concluded that highly methylated sites of LCPs caused the difference in DNA methylation levels observed between HCPs and LCPs, especially in the low-met-LCL group.
Figure 11: Difference in methylation levels between LCLs and PBLs in terms of promoter type.
The proportion of the sites with P-values (−log
10(P-value)) ≤ 25, 25-50, 50-100 and ≥ 100 are indicated in white, blue, green and pink, respectively. The results obtained from the HCP, ICP and LCP sites in all samples (A, D and G, respectively) in the low-met-LCL group (B, E and H, respectively) and in the high-met-LCL (C, F and I, respectively) are shown.
ALL
HCP
ICP
LCP
25 0 100
50
n = 69,836 n = 25,920 n = 43,916
n = 10,719 n = 5,719 n = 5,000
n = 5,145 n = 3,423 n = 1,722
95.9
81.6
69.3
90.9
68.2
57.3
98.8
97.0
93.1 2.4
1.3 0.4
8.8 6.7 2.9
12.5 12.4
5.8
0.8 0.3 0.1
1.9 0.9 0.2
4.0 2.1 0.8 4.9
3.1 1.1
14.9 11.7
5.2
16.8 17.6 8.3
A B C
D E F
G H I
Low-met-LCL High-met-LCL
23
Figure 12: Distribution of the methylation levels of the sites in HCPs, ICPs, and LCPs.
The results in HCPs, ICP, and LCPs are shown in A, B, and C, respectively.
(Upper panel) The distribution of the methylation levels of the sites.
(legend continued on next page) PBC LCL
PBC LCL
PBC LCL
0 0.25 0.5 0.75 1
20 40 60 80 100
350 175
0 0.5 1 -0.5
-1
350 175
0 0.5 1 -0.5
-1
350 175
0 0.5 1 -0.5
-1
350 175
0 0.5 1 -0.5
-1
frequency(%)
Methylation level (β-value) A
Pvalue (-log10P)
DNA methylation difference PBCave− LCLave
0 0.25 0.5 0.75 1
20 40 60 80 100
350 175
0 0.5 1 -0.5
-1
350 175
0 0.5 1 -0.5
-1
350 175
0 0.5 1 -0.5
-1
350 175
0 0.5 1 -0.5
-1
frequency(%)
Methylation level (β-value) B
Pvalue (-log10P)
DNA methylation difference PBCave− LCLave
0 0.25 0.5 0.75 1
20 40 60 80 100
350 175
0 0.5 1 -0.5
-1
350 175
0 0.5 1 -0.5
-1
350 175
0 0.5 1 -0.5
-1
350 175
0 0.5 1 -0.5
-1
frequency(%)
Methylation level (β-value) C
Pvalue (-log10P)
DNA methylation difference PBCave− LCLave
24
(Lower panel) Volcano plot with the difference of the average of DNA methylation level on
the x-axis and the P-value (−log
10(P-value)) obtained via glm analysis on the y-axis. Each plot
shows the sites with methylation level of 0-0.25, 0.25-0.5, 0.5-0.75 and 0.75-1 in PBCs.
25
Chapter 6: The methylation level difference in age-associated methylation site Age-associated methylation sites
Using DNA obtained from PBCs, it has been reported that the methylation levels of several
CpG sites are associated with chronological age. However, it remains unclear whether LCLs
should be utilized for studies on epigenetic aging biomarkers. To address this issue, I performed
a regression analysis for chronological age and known aging-related CpG sites located in FHL2
and ELOVL2 (25, 26). FHL2 encodes a member of the four-and-a-half-LIM-only protein family
that is suggested to have a role in the assembly of extracellular membranes and in the
transformation of normal myoblasts to rhabdomyosarcoma cells (OMIM 602633). ELOVL2
encodes an enzyme that catalyzes the first and rate-limiting reaction of the long-chain fatty acids
elongation cycle (OMIM 611814). As shown in Figure 13, the methylation level of the PBCs was
highly correlated with chronological age (blue dots, P = 1.7E-18 and r
2= 0.33 for FHL2, P =
3.1E-25 and r
2= 0.44 for ELOVL2). In contrast, the methylation level of the LCLs was varied and
the association was weak (black dots, P = 0.04 and r
2= 0.05 for FHL2, P = 1.9E-5 and r
2= 0.18
for ELOVL2). Therefore, these results suggest that DNA obtained from LCLs may not always be
an alternative to DNA from PBCs.
26
Figure 13: Regression analyses of the methylation levels and chronological age at the FHL2 and ELOVL2 loci.
The methylation levels in the LCLs (black dots) and PBCs (blue dots) were plotted against the age of the donors at the time of providing the specimens. The P-values and r2 were obtained by correcting for sex.
10 30 50 70
Me th yl at io n le ve l ( b et a -v al u e)
0 0.5 1.0
Age (year)
90 10 30 50 70 90
cg16867657 (ELOVL2) cg06639320 (FHL2)
PBCs: P= 1.7E-18, r2= 0.33 LCL:s P= 0.04, r2= 0.05
PBCs: P= 3.1E-25, r2= 0.44 LCLs: P= 1.9E-5, r2= 0.18