Doctoral Dissertation
Shibaura Institute of Technology
E-learning System focusing on
Emotional Aspect using
Biological signals
-Boredom detection by eye tracking-
March 2015
SHIBAURA INSTITUTE OF TECHNOLOGY
E-learning System focusing on
Emotional Aspect using
Biological signals
-Boredom detection by eye tracking-
by
Saromporn Charoenpit
A thesis submitted in partial fulfillment for the
Doctor of Philosophy
in the
Functional Control Systems
i
Declaration of Authorship
I, Saromporn CHAROENPIT, declare that this thesis titled, E-learning System focusing
on Emotional Aspect using Biological Signalsand the work presented in it are my own. I
confirm that:
This work was done wholly or mainly while in candidature for a research degree at Shibaura Institute of Technology.
Where any part of this thesis has previously been submitted for a degree or any other qualification at Shibaura Institute of Technology or any other institution, this has been clearly stated.
Where I have consulted the published work of other, this is always clearly attributed.
Where I have quoted from the work of others, the source is always given. With the exception of such quotations, this thesis is entirely my own work.
I have acknowledged all main sources of help.
Where the thesis is based on work done by myself jointly with other, I have made clear exactly what was done by others and what I have contributed myself.
Signed: ___________________________________ (Saromporn CHAROENPIT)
Certified by: ________________________________ (Prof. Dr. Michiko OHKURA)
Abstract
E-learning is a computer-based content and instructional methods designed to build knowledge and skills for individuals and organization. The disadvantages of e-learning include lack of immediate feedback in asynchronous e-learning and potentially more such negative emotions as frustration, anxiety, and confusion. When learners have negative emotions, they usually do not learn well. Therefore, to cope with those is considered to be
a key issue. Therefore, I proposed and designed a new e-learning system with real-time
feedback focusing on the learners’ emotions. To realize the e-learning system, biological sensors and analyze of learners’ emotions were added into the system.
At first, the study is proposed the design of a new e-learning system focusing on emotional aspects. The feature of this system is to give feedback from emotional aspect.
Second, the study focused on estimation of various emotions to confirm importance of their detection using questionnaire. The experimental results suggest that emotional aspects should be taken into account to design interfaces or contents of an e-learning system at least for the difficult contents.
Third, the study focused on estimation of learners’ emotions by eye tracking. The fixation duration ratio, number of fixation ratio and pupil diameter ratio were useful to analyze learners’ negative and positive emotions. The experimental results suggest that the eye metric results are considered more reliable than the questionnaire results.
iii
Acknowledgements
I would not have completed this thesis without the help of several individuals who in one way or another contributed and extended their valuable assistance in the preparation and completion of this study.
First of all, I would like to record my gratitude to my supervisor, Prof. Michiko OHKURA, for her brilliant supervision as well as all merits, opportunities, and help that she kindly provided during the three years of my study at Shibaura Institute of Technology (SIT). Her perpetual energy and enthusiasm in research had consistently motivated all her advisees, including me. In addition, she was always accessible and willing to help her students with their researches. As a result, carrying out the research became smooth and rewarding for me.
I would like to thank my committee members, Prof. Masaomi KIMURA, Prof. Makoto MIZUKAWA, Prof. Eiji KAMIOKA, and Prof. Rihito YAEGASHI for serving as my committee members even at during difficult times. I also want to thank
them for their brilliant comments and suggestions. I am greatly appreciative for the invaluable knowledge I have received. Their advices have guided me a lot to further and better develop my research.
I would like to thank SIT that funded my studies via MOU program with Thai Nichi Institute of Technology (TNI). I would like to thank TNI for the funded and all support during my study at SIT.
iv
thank Salinla Chevakidagarn who is a great colleague to all supports me. I would also like to thank Kodai ITO for helping design questionnaire with translations of the Japanese language to English, and supporting me while I was in Japan.
Every instructors SIT who has given me knowledge and this is where my thesis started.
I would especially like to thank my friends; Somchanok Tivatansakul, Tipporn Laohakangvalvit, Benjaporn Tossanaitada, and Kantawan Sarasuk for putting up with me during my Ph.D. period in JAPAN, always giving me words of encouragement, and for all the emotional support, camaraderie, entertainment, and caring they provided. I will never forget their kindness.
I would also like to thank Thitaphan Jongsataporn and my best friends for providing support and friendship that I needed.
v
Contents
Declaration of Authorship i
Abstract ii
Acknowledgements iii
List of Figures viii
List of Tables x
Abbreviations xii
1 Introduction 1
1.1 Motivation ……….………. 1
1.2 Problem statement ……….……. 4
1.2.1 How to design e-learning system focusing on emotional aspects ……… 4
1.2.2 How to clarify the learners’ emotions ………...…..….…… 5
1.2.3 How to estimate learners’ emotions by biological signals …….…..…… 5
1.2.4 How to integrate the e-learning system with real-time feedback …….… 5
1.3 Research Goal ..……….. 6 1.4 Summary ………...………..……….. 6 1.5 Organization of Thesis ……….. 7 2 Literature Review 8 2.1 E-learning system ……….………. 8 2.2 Learners’ emotion ……….. 11
2.3 Emotion recognition using biological signals ………...…………... 14
2.4 Conclusion ………...……...…………... 16
3 Design of a New E-learning System Focusing on Emotional Aspects 18 3.1 E-learning system design ……….……….. 18
CONTENTS
vi
3.3 Modular Object Oriented Dynamic Learning Environment (Moodle)………... 24
3.4 Discussion ………...………...………..……….. 26
3.5 Conclusion ………..………...………..……….. 27
4 Confirmation of the Importance Emotion Detection 28 4.1 Prototype Implementation of system ..………... 28
4.1.1 Prototype description………...………. 28
4.1.2 Tools and Materials ………...………... 31
4.2 Evaluation Experiment ……….………. 35
4.2.1 Participants………...………. 36
4.2.2 Experiment Method ……….. 36
4.3 Experimental Results and Discussion ……….………….…….. 41
4.3.1 Pre-test and post-test results ………..………. 41
4.3.2 Lesson 1 results ………...…………...………. 41
4.3.3 Lesson 2 results ………..………. 42
4.3.4 Comparison of lessons 1 and 2 ………...………. 44
4.3.5 Relation between test and questionnaire results ……….………... 45
4.4 Discussion ………..……….……….. 46
4.5 Conclusion ………..……….……….. 47
5 Emotion Estimation in E-learning System using Eye Tracking 49 5.1 Implementation of the System …..………..……… 49
5.1.1 Prototype description………. 50
5.1.2 Tools and Materials ………... 50
5.2 Evaluation Experiment ……….………. 57
5.2.1 Participants ………..………. 57
5.2.2 Experiment Method ……….. 57
5.3 Experimental Results and Discussion ……… 59
5.3.1 Test scores and questionnaires results ……….. 59
5.3.2 Eye metric results ……….. 60
5.4 Conclusion ………..……….……….. 68
CONTENTS
vii
6.1 Implementation Prototype of System ….………...………. 70
6.2 Experiment I ………...….………...………. 74
6.2.1 Objective of Experiment ………... 74
6.2.2 Tools and Materials ………... 74
6.2.3 Participants………..………..………. 84
6.2.4 Experiment Procedure ………... 84
6.2.5 Experimental Results………....………. 86
a) Pre-test and post-test results ………..………... 86
b) Questionnaire results ………..………...………... 87
c) Eye metric results ………..………... 87
6.2.6 Discussion of Experiment I………...………. 96
6.3 Experiment II………...….………...………. 97
6.3.1 Objective of Experiment ………... 97
6.3.2 Tools and Materials ………... 97
6.3.3 Participants………..………..………. 102
6.3.4 Experiment Procedure.………... 102
6.3.5 Experimental Results ...………. 102
a) Pre-test and post-test results ………..………... 102
b) Questionnaire results ………..………...………... 103
c) Eye metric results ………..………... 105
6.3.6 Discussion of Experiment I………...………. 111
6.4 Discussion ………...….………...………. 112
6.5 Conclusion………...….………...………. 114
7 Discussion 115 8 Conclusion and Future Work 121 8.1 Conclusion………...….………...………. 121
8.2 Future Work..………...….………...………. 124
viii
List of Figures
1.1 E-learning (left) and traditional classroom learning (right) ……….….. 2
2.1 Badrul Khan’s E-learning framework ………..…….. 9
2.2 Russell’s circumplex model ………... 12
3.1 The proposed new e-learning system ……… 19
3.2 EEG sensors ……….………….. 21
3.3 Wireless Bio Sensors RE-EEC………..………. 22
3.4 Eye tracking ……….……….. 23
3.5 Framework design ………. 24
3.6 Moodle interface ………...………. 26
4.1 Proposed e-learning system …………...………...……. 30
4.2 Framework design ………...……….………. 30
4.3 Process of our learning system ..……….………..……… 35
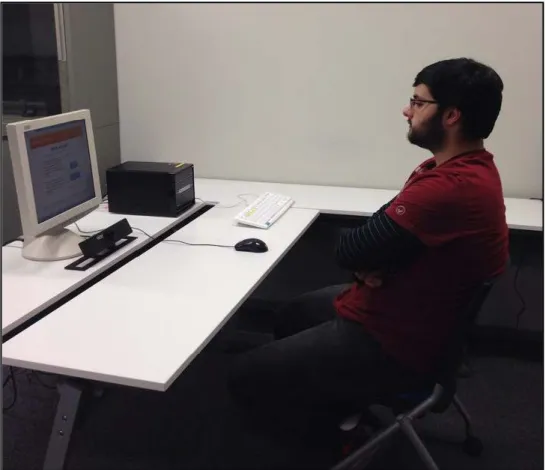
4.4 Learners using the e-learning system ………..……….. 37
4.5 Example of the interface design for the first page ……… 37
4.6 Example of the interface design for pre-tests, post-tests and questionnaires …… 38
4.7 Example of the interface design for PPT ………..………. 39
4.8 Example of the interface design for video ………..………... 40
4.9 Example of the interface design of interactive C tutorial ... 46
4.10 Example of the interface design of system for algorithm animation ... 47
5.1 Overall system designed ……… 50
5.2 Interface design for style A ……… 52
5.3 Interface design for style B ……… 53
5.4 Process of the e-learning system .………...… 54
LIST OF FIGURES
ix
5.6 Experiment scenes ………. 58
5.7 AOI of each area ……… 61
5.8 Correlation graph in content 1 between fixation duration ratio and interest ... 63
5.9 Correlation graph in style B between pupil diameter ratio and boredom …... 64
5.10 Example of fixation plot for content 1: user 04 ……… 66
5.11 Example of fixation plot for content 2: user 04 ……… 67
6.1 Overall design of the system with real-time eye tracking ……….………… 71
6.2 Real-time feedback from eye tracking ………... 73
6.3 Interface design for style A (“without caution”) ………... 75
6.4 Interface design for style B (“with caution”) ………….………... 75
6.5 Process of the e-learning system ……… 76
6.6 AOI of each area ……… 77
6.7 Procedure related to real-time feedback of eye tracking ………..…………. 83
6.8 Experiment scenes ………. 85
6.9 Example of fixation duration length in OLA of participant U01………. 89
6.10 Example of fixation duration length in OLA of participant U13………. 90
6.11 Example of pupil diameter ratio of participant U02 ……….………. 93
6.12 Example of pupil diameter ratio of participant U15 ……….………. 93
6.13 Interface design for caution type 1a (cartoon animation in LA with sound) ... 99
6.14 Interface design for caution type 2a (yellow blink in LA with sound) ... 99
6.16 Process of the learning system ... 100
x
List of Tables
4.1 Detailed design of PPT and video ………...……….. 31
4.2 Examples of pre-test questions for lesson 1 (in Thai) ……….. 32
4.3 Examples of post-test questions for lesson 1 (in Thai) ………. 33
4.4 Questionnaire items on 5-point Likert scale (in Thai) ……….. 34
4.5 Lesson patterns ……….. 34
4.6 Pre-test and post-test results ………. 41
4.7 Learning lesson 1 results ………... 42
4.8 Learning lesson 2 results ………... 44
5.1 Content patterns ………. 51
5.2 Questionnaire items on 5-point likert scale ………. 55
5.3 Tests scores and questionnaire results ……….. 59
5.4 Eye metric on AOI ………. 61
5.5 Correlation between eye metrics and interest of questionnaires ……….. 62
5.6 Correlation between eye metrics and boredom of questionnaires ……… 63
5.7 T-test comparisons of eye metric indexes between contents 1 and 2 of user 04 ... 65
6.1 Content patterns ………. 74
6.2 Detail of each caution ………...……. 78
6.3 Example of pre-test questions for lesson 1 (in Japaneses) ……….. 79
6.4 Items of Likert Scale Questionnaire …………..……… 80
6.5 Case of this system ……… 81
6.6 Pre-test and post-test results ……….…………. 86
6.7 Number of answer choice (e.) “I do not know” in questionnaire results ……….. 86
6.8 Caution results ………... 87
LIST OF TABLES
xi
6.10 Results of fixation duration length in OLA ………..……….………… 88
6.11 Results of ratio of duration of larger pupil diameter in LA of each user …….…. 91
6.12 Results of number of duration of larger pupil diameter in LA ……….. 92
6.13 Detail of each caution ……… 94
6.14 Questionnaire relates to cautions ………... 95
6.15 Questionnaire relates to contents ……….. 95
6.16 Results of the effectiveness of various types of caution ……… 95
6.17 Item of likert scale questionnaire ………..………. 101
6.18 Pre-test and post-test results ……….. 102
6.19 Number of answer choice (e.) “I do not know” results ……….………… 103
6.20 Questionnaire results ………. 104
6.21 The opinion questionnaire results ……….. 104 6.22 Results of fixation duration of the participants in “without caution” and ……….
“with caution” groups
107
6.23 Results of the number of duration of larger pupil diameter of the participants ... in “without caution” and “with caution” groups
108
6.24 T-test comparisons of fixation duration of the participants in “without caution”.. and “with caution” groups
108
6.25 T-test comparisons of larger pupil diameter of the participants in ……… “without caution” and “with caution” groups
109
6.26 Results of the blink rate of each area of the participants in “without caution” ... and “with caution” groups (number of blinks/min.)
110
6.27 T-test comparisons of blink rate of each area of participants in “without caution” and “with caution” groups
xii
Abbreviations
AOI = Areas of interest
BMP = Beats per minute
BVP = Blood Volume Pulse
CES = Courseware evaluation survey
CMS = Course Management System
ECG = Electrocardiography
EDA = Electro dermal activity
EEG = Electroencephalogy
EMG = Electromyography
EQ = Emotional quotient
EREC = Emotion recognition sensor system
IQ = Intelligence quotient
LA = Learning area
LMS = Learning Management System
Moodle = Modular Object Oriented Dynamic Learning Environment
OLA = Out of learning area
PHP = PHP hypertext preprocessor
PPG = Photoplethysmography
PPT = Power point
SD = Standard Deviation
SCL = Skin conductance level
SCR = Skin conductance response
SKT = Skin temperature
SQL = Structured query language
Chapter 1
Introduction
This chapter provides an introduction to the research work presented in this thesis. It describes the motivation of this research, problem statement, research goals, and finally the structure of the thesis is introduced.
1.1 Motivation
CHAPTER 1. INTRODUCTION 2
accessibility it provides. Learners can learn from wherever they are on the condition that the internet is accessible [6]. E-learning allows learners to select learning materials that meet their level of knowledge, interest and what they need to know to perform more effectively in an activity. E-learning actively focuses on the learners and it is more interesting for them because it provides all information that they want to learn [7]. E-learning is flexible and can be customized to meet the individual needs of the learners [8].
Figure 1.1: E-learning (left) and traditional classroom learning (right) [9]
The disadvantages of e-learning include lack of immediate feedback in asynchronous e-learning, increased preparation time for the instructor, unease to some people, and potentially more frustration, anxiety, and confusion [6, 10]. Many learners have experienced some negative emotions, always feeling sleepy or bored, in their learning. When the learners have these negative emotions, they usually do not learn well [8]. Moreover, a common problem of e-learning is that the learners could easily get bored because of the environment might not fully support e-learning system [11]. To cope with these negative emotions (e.g. frustration, anxiety, confusion, boredom, sleepiness) is considered to be a key issue. Therefore, to persuade the learners to continue learning when they get negative emotions, an appropriate tool should be initiated in order to effectively avoid causing negative emotions to the learners [11].
CHAPTER 1. INTRODUCTION 3
Kort et al. [13] confirmed this in the following quote: “When a learner experiences positive emotions, the learning process can be enhanced. When a learner experiences negative emotions, the learning process can be disabled.” Goleman [14] is of similar opinion as the following quote: “Learners who are anxious, angry, or depressed do not learn; people who are caught in these states do not take in information efficiently or deal with it well [13, 15].
Recent studies have acknowledged how negative emotions (e.g., anger, frustration, confusion, and boredom) and positive emotions (e.g., engagement, excitement) experienced by online learners inhibit or support the process of learning [16]. Russell and Kort’s models share a common axis: the emotional state. If, during learning, emotion is found to change in a consistent manner then this would provide a means to study how learning behaviors relate to emotions [17]. At first, learners might be curious and fascinated about a new topic of interest or they might be puzzled and motivated to reduce confusion. Some discrepancies between the information and the learner’s knowledge are arising. Puzzling in studied materials has negative effects and learners feel the state of confusion. As learners try and fail to solve the educational tasks they might experience some undesirable emotions like frustration. When misconceptions are cleared-up, learners might obtain hopefulness by acquiring new insights and searching for new ideas [18, 19]. Emotions are reliable indicators of what is really going on inside of us [20]. There have been many efforts to recognize emotions [21, 22] such as questionnaire, biological signals measured by different sensors, e.g. electroencephalograph sensor measuring EEG activity from the brain, skin conductance sensor, and photoplethysmyograph measuring blood volume pressure. As the other beneficial information for emotion recognition includes face and voice recognition, body movements (e.g. the way person is sitting on a chair) and learners’ surroundings [23].
Many researches employed questionnaires while other researches employed
biological signals to analyze and evaluate the learners’ emotion. Using only the
CHAPTER 1. INTRODUCTION 4
way to improve the precision for analyzing the learners’ emotions because the human’s emotions can be investigated through biological signals right at the time they are engaged to a certain activity.
Regarding to the motivation, there are many ideas for the development of the e-learning system in the future. One idea is to improve e-e-learning system to be interactive with learners based on learners’ emotional states. For example, the system can recognize the learners’ emotions and provide an appropriate respond. Moreover, the e-learning system can reduce negative emotions and motivate the learners to carry on learning. To adapt this idea to current e-learning system, I found there are several issues to be solved. I will describe each issue and how to solve it in the problem statement section.
1.2 Problem statement
E-learning should be designed to motivate learners so that they can enjoy their learning experience on the web and complete their assignments on time [24]. These days, there are no e-learning systems that provide any ability to focus on emotional aspects in real-time. Therefore, this thesis discussed the problems sand proposed the solution. The details are shown as follows:
1.2.1 How to design e-learning system focusing on emotional aspects
CHAPTER 1. INTRODUCTION 5
research focuses on a design of e-learning system that can detect learners’ emotions so that they can learn continuously.
1.2.2 How to clarify the learners’ emotions
Since people have different ability, emotion, interest, former knowledge, and experience regarding the lesson, they have unequal ability to learn. During each learning period, the learners may have various emotions, e.g., interested, bored, sleepy, anxious, enjoyable, satisfied. Therefore, it is important to investigate on how to evaluate the learners’ emotions during a learning session. However, the method to recognize actual emotions of the learners is complexes. Questionnaire is considered an effective tool to evaluate the learners’ opinions and sentiment in various aspects including emotions. Therefore, it is chosen as a tool to evaluate and analyze the learners’ emotions in an initial phase of the research.
1.2.3 How to estimate learners’ emotions by eye tracking
Even though questionnaire-based evaluation is considered to be somewhat effective for gathering the learners’ opinion about their emotion during a learning period, it still has some limitations. Using only questionnaires is impossible to know if a respondent gives a true answer or not. In addition, the answer is not responded in real-time. Thus, a more effective tool to detect the learners’ emotions should be used, especially the biological sensors, because people’s emotions are expressed through biological signals in a similar way. Even if one can hide their emotions to make others unable to notice from the outer appearance, they cannot hide their emotions from biological sensors.
1.2.4 How to integrate the e-learning system with real-time feedback
CHAPTER 1. INTRODUCTION 6
boredom. Therefore, the research focuses on a design and development of the system that can detect the boredom of the learners and give appropriate feedback to decrease that emotion. This study showed examples of feedbacks for the learners to avoid getting bored and carry on the lessons.
1.3 Research Goal
Currently the existing e-learning systems cannot recognize learners’ emotions to provide an appropriate feedback. Therefore, the overall objective of this research is to design and construct an e-learning system which focuses on the learners’ emotion using biological signals. In order to achieve the overall goal of this research, there are several contributions as described as below:
1. Proposing the design of a new e-learning system focusing on emotional aspects 2. Evaluation of various emotions to confirm importance of their detection 3. Estimation of learners’ emotions by eye tracking
4. The integration of new e-learning system with real-time feedback by eye tracking
1.4 Summary
CHAPTER 1. INTRODUCTION 7
1.5 Organization of Thesis
This thesis consists of other seven chapters, which are organized as follows:
Chapter 2: Literature Review. This chapter presents the literatures related to this
research. Three main topics for this research are reviewed including e-learning system, learners’ emotions, and biological signals.
Chapter 3: Design of a New E-learning System Focusing on Emotional Aspects. This chapter presents the structure of the proposed system. This proposed new
e-learning system is used to build a prototype of the e-learning system in the experiments in Chapters 4, 5, and 6.
Chapter 4: Confirmation of the Importance of Emotion Detection. This
chapter describes a study of new e-learning system focusing on emotional aspects by using questionnaires as a tool for emotion detection. The main finding of this chapter is to confirm that emotional aspects should be taken into account.
Chapter 5: Emotion Estimation in E-learning System using Eye Tracking.
This chapter describes a study of the proposed e-learning system focusing on the usage of biological signals, i.e., eye tracking indexes. The main finding of this chapter is to find the eye tracking indexes that can effectively estimate the two types of emotions: interest and boredom.
Chapter 6: Proposed E-learning System with Real-time Feedback from Eye Tracking. This chapter presents a study of the new e-learning system with the real-time
feedback from eye tracking. The experimental results of the previous chapter were used to build the feedback algorithm.
Chapter 7: Discussion. This chapter offers a discussion of this thesis as well as a
summary of the method to achieve the overall research goal and solve the stated problems.
Chapter 8: Conclusion. This chapter summarizes this research. Finally, the latter
Chapter 2
Literature Review
In this section, I reviewed the literatures related to my research and presented an overview of e-learning system, learners’ emotions, and biological signals.
2.1 E-learning system
Khan developed a framework for e-learning that contained the following eight dimensions [25]:
• E-learning’s pedagogical dimension, which refers to teaching and learning, addresses issues concerning content, audience, goal, and media analyses, design approach, organization and methods, and strategies of e-learning environments. • The technological dimension of the e-learning framework examines the
CHAPTER 2. LITERATURE REVIEW 9
• The interface design refers to the overall look and feel of the e-learning programs. This dimension encompasses the page and site designs, the content design, navigation, and usability testing.
• E-learning evaluation assesses both learners and the instruction and learning environments.
• E-learning management maintains the learning environment and distributes information.
• The resource support dimension of the e-learning framework examines the online support and resources required to foster meaningful learning environments.
• E-learning’s ethical considerations are related to social and political influence, bias, cultural, geographical, and learner diversity, information accessibility, etiquette, and legal issues.
• The institutional dimension is concerned with issues of administrative affairs, academic affairs, and student services related to e-learning.
CHAPTER 2. LITERATURE REVIEW 10
I employed this framework for the new e-learning system. These factors can encompass various online learning issues, including: pedagogical, technological, interface design, evaluation, management, resource support, ethical and institutional. Various factors discussed in the eight dimensions of the framework can provide a guidance in the design, development, delivery and evaluation of flexibility.
As identified by different researches, Kittanakere et al. summarized the main goals of e-learning systems as follows [26]:
• Focus on active learning.
• Accommodate various learning styles.
• Explicitly place the responsibility for learning on the students themselves. • Develop written and oral communication skills.
• Clarify the teacher’s role as facilitator and mentor. • Provide better coverage of class material.
• Develop a sense of self-confidence and independence in students. • Encourage peer review.
• Develop interpersonal communication skills when students are geographically distant.
• Support the entire educational process when students are separated both geographically and temporally.
• Teach time management, especially meeting deadlines
Many of the above goals reflect the advantages of e-learning systems over traditional learning approaches. Another advantage is that they are scalable. The number of learners that an e-learning system can handle with individual attention is much more than that can be accommodated in a classroom setting [26].
CHAPTER 2. LITERATURE REVIEW 11
Joanne et al. formally evaluated the module’s phase using the outcome levels of Kirkpatrick’s framework [28] as follows:
• Level one: assessment of learner satisfaction with educational intervention. This involves a courseware evaluation survey (CES) developed to evaluate participant satisfaction based on five variables.
• Level two: students’ learning. This involves a multicenter randomized controlled study using pre and post-test knowledge before and after residents used the module.
• Level three: assessment of training transfer. This involves a retrospective pre and post questionnaires, which are commonly used for quantitative analysis in medical education research.
• Level four: outcomes, which examined the effects on the environment resulting from the application of training.
I employed Kirkpatrick's framework to analyze the effectiveness of e-learning system.
Wang et al. also designed two kinds of humorous performances that were learning-relevant to help students remember [29]. One appeared at the end of every learning video, and the other appeared when the students expressed emotions. They used paper-and-pencil materials that consisted of a pre-test, a post-test, and a questionnaire. The computerized materials consisted of a multimedia computer program for teaching Chinese history.
2.2 Learners’ emotion
CHAPTER 2. LITERATURE REVIEW 12
Figure 2.2: Russell’s circumplex model [30]
Kittanakere et al. introduced the design of an emotion sensitive e-learning system that gives emphasis on the complete learning process and is very cost effective. The system categorizes a learner's emotional state as follows: happy, neutral, and sad. This motivates thinking about incorporating emotional aspects of teaching in e-learning systems to make them more intelligent. An intelligent e-learning system should be able to adapt to the knowledge, learning abilities, and needs of each learner [26]. This would give them the feel of individual care, which would assist in the learning process.
CHAPTER 2. LITERATURE REVIEW 13
Wu et al. defined three basic learning emotions: absorbed, neuter and fatigue, and discussed the features of every defined learning emotion by face detection system using AdaBoost algorithm based on skin color [31]. The facial expression characteristics of absorbed expression and fatigue expression are more obvious than neuter expression, so it can be found that the recognition rate of absorbed expression and fatigue expression is higher than neuter expression.
Dirkx called for the recognition of the positive emotions engendered by learning. Furthermore, he suggested that critical theory failed to “adequately account for the emotional and spiritual dimensions of learning [32]. At about the same time, Gardner [33], Goleman [14], and LeDoux [34] rethought the significance of emotion. Concurrently, Damasio [35, 36] conducted experiments that indicated that emotion and cognition are innately intertwined. Although other researchers are beginning to build on the work of Damasio and his team, “inquiry has been slow to advance our understanding of emotions in education”. Learning processes are the currency of exchange in education, and emotional experiences are a “neglected dynamic” [37] in complex social environments where learning takes place. This is particularly so in online learning. According to O’Regan [21], the transition to online teaching and learning provides the opportunity to test the assumptions about emotion embedded in our practice, building on the strands of research developed regarding emotion and the human experience, emotion and cognition, and, more recently, emotion and learning.
CHAPTER 2. LITERATURE REVIEW 14
their classmates and their instructor; and stress and guilt for the inability to balance multiple roles and responsibilities, the most serious obstacle that the students faced. They struggled to combine their occupation, family, and social life, which made it hard to cope with the numerous demands of the program [38].
2.3 Emotion recognition using biological signals
Emotion recognition using physiological signals has increasingly become a hotspot and developed trend in the fields of affective computing and human-computer interface.
Kaiser and Oertel also developed an emotion recognition sensor system; an e-learning system was enhanced with affective abilities [23]. The system providing a catalogue of affective measures describes actions to support the user in handling negative emotions. To ensure the initiation of a correct measure, a user is to be asked to verify the emotion recognition. The emotion recognition sensor system (EREC), developed at the IGD-R, consists of a sensor glove, a chest belt and a data collection unit.
Khalifa et al. argued that the data collected from eye tracking devices indicate the person’s interest level and the focus of his attention [39]. From eye position tracking and such indirect measures as fixation numbers and duration, gaze position, and blink rate, information about the user’s level of attention, stress, relaxation, problem solving, learning success, and fatigue can be drawn.
Ismail and Mohamed integrated eye tracking technology to track and analyze a learner’s behaviors on an e-learning platform [40]. They focused on the interesting areas of courses that reflect a user’s emotions, attention, stress, relaxation, problem solving, and fatigue.
CHAPTER 2. LITERATURE REVIEW 15
Marco et al. addressed the problems of students on eye tracker’s screens and their eye data while solving problems that were recorded under such real-time conditions as gaze coordinates, fixation durations, and pupil diameters, from which they subsequently obtained indirect but important measures, such as saccadic velocities and blink rates [42]. If a learner decreases the number of blinks, the increase of the fixation or pupil size is related to learners with high working levels or without understanding of the content.
Mealha et al. summarized data representation and information visualization techniques for data analysis within different contexts (advertising, websites, television news, and video games) [43]. They used common eye tracking related data representation techniques that offer valuable input about user interaction and eye gaze behavior by measuring fixations and saccades.
Liu recognized emotions of joy and sadness based on ECG signal. The process of emotion recognition based on ECG signal has the following four main steps: 1), affective data acquisition; 2), affective feature extraction; 3), affective feature subset selection; and 4), classifier design. The changes of emotions may be reflected by the changes of P-QRS-T wave, if emotions influence ECG signal. P-QRS-Therefore, feature extraction is based on precise location of P-QRS-T wave [44].
Jang et.al. improved the limitation that it is result in specific context; they used 10 different emotional stimuli sets to induce seven emotions, i.e., happiness, sadness, anger, fear, disgust, surprise and stress under the same conditions. They identified the difference among emotions using physiological responses induced by these emotional stimuli and the most optimal algorithm for emotion recognition. For this, they selected physiological signals of electrodermal activity (EDA), electrocardiogram (ECG), photoplethysmography (PPG), and skin temperature (SKT), because the signals reflect the activity of the autonomic nervous system, which plays a major role in maintaining the internal equilibrium of the body. The result can help emotion recognition studies lead to better chance to recognize not only basic emotion but also a user’s various emotions, e.g., boredom, frustration, love, pain, etc., by using physiological signals. Also, it is able to be applied on many human-computer interaction devices for emotion detection [45].
CHAPTER 2. LITERATURE REVIEW 16
methodology for multimodal biosignal data handling, targeting emotion recognition. Relevant physiological patterns were observed for different emotions. The most promising ones include: smile pattern in the EMG and the EDA signal; different characteristics for the BVP signal for distinct emotions such as anger and disgust; high arousal (high SCL and large amplitude of the SCRs) associated with anger and disgust; low arousal associated with fear and sadness; large SCR associated with surprise [46].
Yisi L., Olga S., and Minh K.N. concentrated on recognition of “inner” emotions from electroencephalogram (EEG) signals as humans could control their facial expressions or vocal intonation. The need and importance of the automatic emotion recognition from EEG signals have grown with increasing role of brain computer interface applications and development of new forms of human-centric and human-driven interaction with digital media. They proposed fractal dimension based algorithm of quantification of basic emotions and described its implementation as a feedback in 3D virtual environments. The user emotions are recognized and visualized in real-time on his/her avatar adding one more so-called “emotion dimension” to human computer interfaces [47].
2.4 Conclusion
CHAPTER 2. LITERATURE REVIEW 17
Chapter 3
Design of a New E-learning System
Focusing on Emotional Aspects
Referring to the literature review, I summarized the e-learning system that focuses on emotional aspects using biological signals. I performed a survey on learners’ emotions, which are important while learners use e-learning system. The standardized and generalized technologies are considered to be applied in this research. This chapter discusses the overall design of the new e-learning system.
3.1 E-learning system design
CHAPTER 3. DESIGN OF A NEW E-LEARNING SYSTEM 19 FOCUSING ON EMOTIONAL ASPECTS
electroencephalograph (EEG), electrocardiogram (ECG), and eye tracking to detect and symptoms of learners’ emotions.
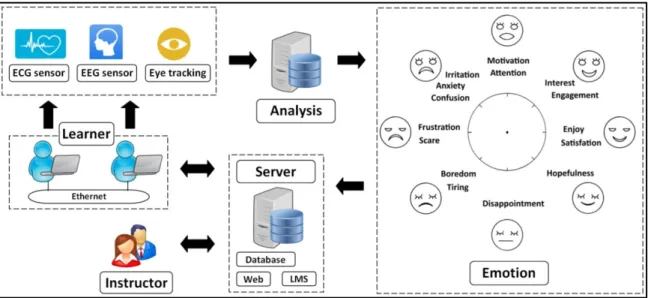
This chapter described the overall design of the new e-learning system as shown in Figure 3.1. This system uses a web server that users can easily access by web browser on a personal computer. During the learning sessions, biological signals including electrocardiogram (ECG), electroencephalograph (EEG), and eye tracking were used to detect and symptoms of learners’ emotions which have significant influence on learning through the system.
Figure 3.1: The proposed new e-learning system
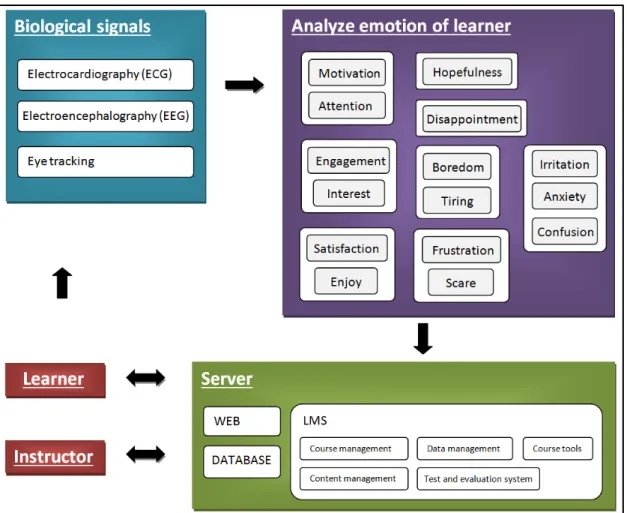
The design of the new e-learning system consists of five modules: learners, instructors, servers, biological signals, and analysis of the learners’ emotions [48]. The details are described below:
1. Learners: individuals who register to take e-learning courses provided by the Learning Management System (LMS).
2. Instructors: a critical element of this system. They create and design courses, contents, tests, quizzes, and evaluations in LMS.
CHAPTER 3. DESIGN OF A NEW E-LEARNING SYSTEM 20 FOCUSING ON EMOTIONAL ASPECTS
a) Web server dispenses web pages as requested by the LMS. b) Database server provides database services to the LMS.
c) The LMS is a web-based technology that plans, implements, and assesses a specific learning process. Typically, it provides an instructor with a way to create and deliver content, to monitor learners’ participation, and to assess their performance. The LMS consists of the following five parts:
• Course management which helps store, organize, and communicate a course’s information. It consists of two user groups, learners and instructors, who can access the system anytime and anywhere.
• Content management which includes tools for creating and supporting the content.
• The test and evaluation system which manages exams, interactive quizzes, and integrated tests into the database system to evaluate the learners.
• Course tools which are used to help and guide each user.
• The data management system which manages the files and folders of each user.
4. Biological signals: electrocardiography (ECG), electroencephalography (EEG) and eye tracking for measurement of emotion of learners. The details are as follows:
a) An EEG sensor measures the voltage fluctuations of the electric ions within the brain’s neurons as shown in Figure 3.2 [49]. EEGs are classified into the following four types:
• Beta waves: 14-30 Hz, under normal conditions or with some anxiety • Alpha waves: 8-13 Hz, during meditation or in a relaxed state
• Theta waves: 4-7 Hz, during slumber
• Delta waves: 0.5-3 Hz, while falling into a deep sleep
CHAPTER 3. DESIGN OF A NEW E-LEARNING SYSTEM 21 FOCUSING ON EMOTIONAL ASPECTS
Figure 3.2: EEG sensors [51]
b) An ECG sensor measures the electrical activity of the heart over a specific period of time. ECG signals can be interpreted as the heart rate in beats per minute (BMP) as shown in Figure 3.3 [53]. Ohkura et al. used ECGs to estimate users’ emotions by the following indexes [50, 51].
• R-R interval: time interval between the two R waves of the ECG or the inverse of the heart rate
• Heart rate: number of heart-beats per minute • LF/HF: HF/LF ratio
- LF: lower frequency of component: 0.04-0.15 Hz - HF: higher frequency of component: 0.15-0.4 Hz
CHAPTER 3. DESIGN OF A NEW E-LEARNING SYSTEM 22 FOCUSING ON EMOTIONAL ASPECTS
Figure 3.3: Wireless Bio Sensors RF-EEC [52]
c) An eye tracking method measures a person’s point of gaze, which focuses on what a person is looking at and locates the eye spot as shown in Figure 3.4. Porta et al. and Al-Wabil et al. related pupil size, fixation length, blink rate, and saccadic speed to estimate users’ emotions [53, 54]. For example, pupil size is related to actions and thinking. However, it can also depend on other factors than processing load: aural stimuli, light variations, or emotions unrelated to the task being performed. Fixation duration and blink rate that identify specific patterns can provide information about user emotional states.
CHAPTER 3. DESIGN OF A NEW E-LEARNING SYSTEM 23 FOCUSING ON EMOTIONAL ASPECTS
Figure 3.4: Eye tracking [55]
3.2 E-learning system framework
I used an e-learning framework [25] that contains eight dimensions encompassing the following online learning issues: pedagogical, technological, interface design, evaluation, management, resource support, ethical, and institutional issues. Each factor has several sub-factors, and each sub-factor consists of issues related to a specific aspect of an e-learning environment. These issues generate many questions that course designers ask themselves when planning or designing an e-learning system framework.
CHAPTER 3. DESIGN OF A NEW E-LEARNING SYSTEM 24 FOCUSING ON EMOTIONAL ASPECTS
Figure 3.5: Framework design
3.3 Modular Object Oriented Dynamic Learning Environment
(Moodle)
Moodle is an Open Source Course Management System (CMS), also known as an LMS or a Virtual Learning Environment (VLE) [56].
CHAPTER 3. DESIGN OF A NEW E-LEARNING SYSTEM 25 FOCUSING ON EMOTIONAL ASPECTS
Moodle has several features considered typical of an e-learning platform, plus some original innovations [58] as shown in Figure 3.7. Some typical features of Moodle are
• Assignment submission
• Discussion forum
• Files download
• Grading
• Moodle instant messages
• Online calendar
• Online news and announcement (College and course level)
• Online quiz
• Wiki
Developers can extend Moodle’s modular construction by creating plug-ins for specific new functionality. Moodle’s infrastructure supports many types of plug-ins:
• activities (including word and math games)
• resource types
• question types (multiple choice, true and false, fill in the blank, etc)
• data field types (for the database activity)
• graphical themes
• authentication methods (can require username and password accessibility)
• enrollment methods
• content filters
Moodle can be integrated with online content resource repositories, enterprise solutions for managing course registration, payment and enrolment, course schedules, allocation of training resources, compliance management, and learners’ records. Moodle can be installed on any computer that can run PHP, and can support an SQL type database. It can be run on Windows, Mac operating systems, and Linux [58].
CHAPTER 3. DESIGN OF A NEW E-LEARNING SYSTEM 26 FOCUSING ON EMOTIONAL ASPECTS
Figure 3.6: Moodle interface [58]
3.4 Discussion
CHAPTER 3. DESIGN OF A NEW E-LEARNING SYSTEM 27 FOCUSING ON EMOTIONAL ASPECTS
3.5 Conclusion
Chapter 4
Confirmation of the Importance of
Emotion Detection
In e-learning systems, even though few researches on such systems have investigated learners’ emotions, they have proposed systems that provide functions tools to analyze certain learners’ emotions such as boredom, interest, and sadness. Unlike previous work, in this chapter, I proposed a new e-learning system that considers attention, motivation, satisfaction, enjoyment, interest, anxiety, frustration, scare and tiring. I designed, implemented a prototype experimentally evaluated it, and confirmed that emotional aspects are important in e-learning.
4.1 Prototype Implementation of System
CHAPTER 4. CONFIRMATION OF THE IMPORTANCE 29
OF EMOTION DETECTION
This chapter describes a study of a new e-learning system focusing on emotional aspects by using a questionnaire as a tool for emotion detection of emotional states. The main finding of this chapter confirms that the questionnaire is effective in detecting the emotions of learners. I built a prototype of the proposed e-learning system and experimentally evaluated it by pre and post-test scores and questionnaires about learners’ emotions based on the system design that consists of four modules: learners, instructors, servers, and an analysis of learners’ emotions as shown in Figures 4.1 and 4.2. The details are described below:
1. Learners. 2. Instructors. 3. Servers
4. Analysis of learner's emotion
In this research, I used questionnaire design [59] and employed several emotions based on Russell’s ‘circumplex model’ [30] to describe the learners’ emotion space as following:
1. Group 1: Motivation and Attention 2. Group 2: Interest and Engagement 3. Group 3: Enjoy and Satisfaction 4. Group 4: Hopefulness
5. Group 5: Disappointment 6. Group 6: Boredom and Tiring 7. Group 7: Frustration and Scare
CHAPTER 4. CONFIRMATION OF THE IMPORTANCE 30
OF EMOTION DETECTION
Figure 4.1: Proposed e-learning system
CHAPTER 4. CONFIRMATION OF THE IMPORTANCE 31
OF EMOTION DETECTION
4.1.2 Tools and Materials
The prototype of the e-learning tasks consists of a series of lessons, pre-tests, post-tests, and questionnaires for teaching C programming for control.
C programming for control is divided into two lessons.
1. Lesson 1 is the introduces of C programming for control covering the following two topics:
• Introduction of C programming for control • Programming style
2. Lesson 2 is basic of C programming for control covering the following three topics:
• Structure of a C program
• Development of a small program in C
• Data inputs and printing of the results obtained from a C program for control.
The content of lesson 2 is more difficult than lesson 1.
I designed two kinds of contents presented by power point (PPT) and video as shown in Table 4.1 and described below:
• The PPT design includes text and cartoon. Learners can control the content flow by pushing the enter button.
• The video design runs automatically and includes text, cartoon, and voice.
Table 4.1: Detailed design of PPT and video
Design
Detail PPT Video
Cartoon Static With movement
Voice None Yes
CHAPTER 4. CONFIRMATION OF THE IMPORTANCE 32
OF EMOTION DETECTION
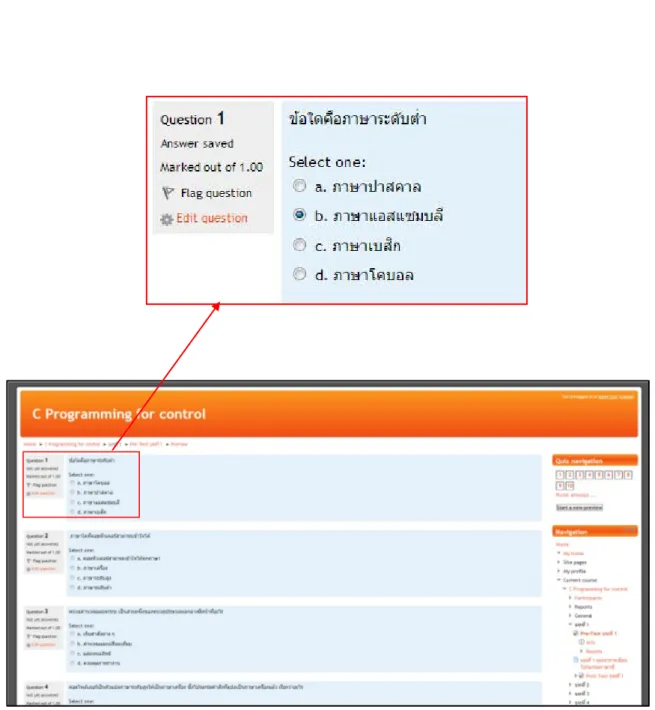
The pre-test and post-test are designed and used to evaluate the obtained knowledge based on C programming for control topic. Examples of pre and post-test questions for lesson 1 are shown in Tables 4.2 - 4.3. Since both consist of ten questions and each question has one point, the highest score is ten.
Table 4.2: Examples of pre-test questions for lesson 1 (in Thai).
Lesson 1 pre-test Q# Content
1. Which is a low-level language? a. Cobol
b. Assembly c. Pascal d. Basic
2. What language can computers understand? a. All languages
b. High-level languages c. Machine languages d. Low-level languages
3. What is the function of the Arithmetic and Logic Unit as part of the processor? a. Collection of various commands.
b. Calculation and comparison. c. Results.
d. Controls.
4. What is a program command that compiles a high-level language into a machine language called?
a. Object program b. Compiled program c. Source program d. Computer program
CHAPTER 4. CONFIRMATION OF THE IMPORTANCE 33
OF EMOTION DETECTION
Table 4.3: Examples of post-test questions for lesson 1 (in Thai).
Lesson 1 post-test
1. What is computer programming?
a. Convincing your computer to never freeze b. Speeding up your computer
c. Setting the alarm on a computer
d. Telling your computer what to do through a special set of instructions 2. Which of the following is NOT a software language?
a. C b. C++
c. Visual Basic d. HTML
3. If you were to look at a machine language program, you would see __________. a. Source code
b. A stream of binary numbers c. English words
d. Circuits
4. Which of the following is NOT a web language a. C++
b. PHP c. Javascript d. HTML
5. Every C program begins execution at function __________. a. main()
b. #include c. Void d. Compiler
The questionnaires include 15 questions related to learner emotions in e-learning systems [59]. The 5- points Likert scale [60] was used to scale responses to the questionnaire items (Table 4.4).
I prepared two lesson patterns (Table 4.5). The process of each is shown in Figure 4.3, and the details are described below:
• Pattern I: the learners study C programming for control in lesson 1 by PPT and in lesson 2 by video.
CHAPTER 4. CONFIRMATION OF THE IMPORTANCE 34
OF EMOTION DETECTION
Table 4.4: Questionnaire items on 5-point Likert scale (in Thai).
Q# Content Related
emotion
1 The learning process increased my learning attention. Attention
2 Putting a multimedia presentation into the learning system
motivated me to use it.
Motivation
3 The learning system helped me learn better. Satisfaction
4 I reduced my negative emotions after interacting with the
learning system.
Negative emotion
5 Interacting with the learning system increased my positive
emotions.
Positive emotion
6 E-learning made my course more enjoyable. Enjoy
7 From time to time the courses were interesting. Interest
8 E-learning is satisfying. Satisfaction
9 Studying e-learning courses was often fun. Enjoy
10 I felt proud after finishing an e-learning course. Satisfaction
11 Some features of e-learning were stressful. Anxiety
12 The e-learning courses were frustrating. Frustration
13 Using the e-learning courses was irritating. Irritation
14 Starting the e-learning course scared me. Scare
15 Using the e-learning system was sometimes tiring. Tiring
Q# : Question number
Table 4.5: Lesson patterns
Lesson Pattern I Pattern II
1 PPT Video
CHAPTER 4. CONFIRMATION OF THE IMPORTANCE 35
OF EMOTION DETECTION
4.2 Evaluation Experiment
This experiment were performed with the cooperation of Thai Nichi Institute of Technology.
CHAPTER 4. CONFIRMATION OF THE IMPORTANCE 36
OF EMOTION DETECTION
4.2.1 Participants
I conducted experiments by equally dividing 60 Thai-Nichi Institute of Technology students into two groups, and performed learning tasks using different learning methods. All subjects are in Thai. Conditions of participants are described as follows:
1. Participants never learn “C programming for control” before. 2. Participants are male and female Thai between 18-19 years old.
4.2.2 Expereiment Method
This system uses servers and is linked to the Internet by common web browsers such as Internet Explorer, Chrome, and Firefox [61]. Figure 4.4 shows a scene of the experiment. The procedures are described below (Figures 4.5 to 4.8):
1. Learners register when they first log onto the e-learning system. After logging in, personalized e-learning starts.
2. They take a pre-test within ten minutes before lesson 1 starts.
3. They learn lesson 1 of pattern I only one time. If they do not understand it, they can repeat lesson 1 to get additional explanation of the text content.
4. After finishing lesson 1, they take a post-test. 5. They answer a questionnaire.
6. They take a 10 minutes break.
7. They take a pre-test before lesson 2 starts.
8. They learn lesson 2 of pattern I only one time. If they do not understand, they can repeat lesson 2 to get additional explanation of the text content.
CHAPTER 4. CONFIRMATION OF THE IMPORTANCE 37
OF EMOTION DETECTION
Figure 4.4: Learners using the e-learning system
CHAPTER 4. CONFIRMATION OF THE IMPORTANCE 38
OF EMOTION DETECTION
CHAPTER 4. CONFIRMATION OF THE IMPORTANCE 39
OF EMOTION DETECTION
CHAPTER 4. CONFIRMATION OF THE IMPORTANCE 40
OF EMOTION DETECTION
CHAPTER 4. CONFIRMATION OF THE IMPORTANCE 41
OF EMOTION DETECTION
4.3 Experimental Results and Discussion
In this section, I obtained the following results by comparing the test scores and the questionnaire results.
4.3.1 Pre-test and post-test results
The results of the pre-test and post-test scores for learning lessons 1 and 2 are summarized in Table 4.6. According to the statistical analysis results, the mean difference between the post-test and pre-test results of lesson 1’s PPT (2.90) is significantly higher than that of its video (2.63) (p<.01).
The mean difference between the post-test and pre-test results of lesson 2’s video (3.37) is significantly higher than that of its PPT (3.17) (p<.01).
Table 4.6: Pre-test and post-test results.
Lesson Design Pre-test Post-test
Differences between
Post-Pre tests
t-test Mean SD. Mean SD. Mean SD. t P-Value 1 PPT 4.63 1.82 7.53 1.27 2.90 1.80 11.919 .000** Video 4.80 1.29 7.43 1.22 2.63 1.81 2 PPT 4.83 1.68 8.00 1.36 3.17 1.80 38.980 .000** Video 4.27 1.23 7.63 1.52 3.37 1.81 + p<0.1; * p<0.05; ** p<0.01 4.3.2 Lesson 1 results
CHAPTER 4. CONFIRMATION OF THE IMPORTANCE 42
OF EMOTION DETECTION
• Q#11: E-learning with the PPT has features that caused more anxiety than e-learning with the video.
• Q#12: E-learning courses with the PPT caused more frustration than those with the video.
• Q#13: Using the e-learning with the PPT courses is more irritating than using ones with the video.
• Q#14: Learners were more scared when starting an e-learning course with the PPT than when starting one with the video.
• Q#15: Using the e-learning system with the PPT was at times more tiring than using one with the video.
On the other hand, I found no significant differences in the scores for questions 1 to 10.
Table 4.7: Learning lesson 1 results.
Q.# PPT Video t P-Value Mean SD. Mean SD. 1 3.67 .606 3.47 .776 1.112 .271 2 2.90 .548 3.20 .805 -1.687 .098 3 3.57 .504 3.50 .630 .453 .652 4 3.17 .913 3.37 .890 -.859 .394 5 3.30 .596 3.37 .669 -.408 .685 6 2.87 .730 2.97 .765 -.518 .606 7 2.93 .868 3.17 .950 -.993 .325 8 3.43 .568 3.37 .615 .436 .664 9 3.07 .583 3.20 .484 -.963 .339 10 3.97 .669 3.73 .740 1.282 .205 11 3.30 .988 2.07 1.143 4.472 .000** 12 2.63 .490 1.90 .885 3.971 .000** 13 2.40 .814 1.57 .774 4.065 .000** 14 3.83 .648 2.17 1.440 5.780 .000** 15 3.27 .907 1.93 1.230 4.779 .000** + p<0.1; * p<0.05; ** p<0.01 Q# : Question number 4.3.3 Lesson 2 results
CHAPTER 4. CONFIRMATION OF THE IMPORTANCE 43
OF EMOTION DETECTION
between the pattern I using video and the pattern II using PPT for the questionnaires shown in Table 4.8.
I found a significant difference in the scores for questions 1, 2, 4, 5, 7, 13, and 14 between PPT and video at a 1% level. In addition, I found a significant difference in the scores for question 15 between PPT and video at 5% level:
• Q#1: The learning process with the video increased the learning attention more than the process with the PPT.
• Q#2: Putting the multimedia performance on the video motivated learners to use the system more than learning through the system with the PPT only.
• Q#4 and #5: Video interaction in the learning system increased the learners’ positive emotions and lowered their negative emotions more than when learning with the PPT.
• Q#7: Sometimes the course with the video was more interesting than with one with the PPT.
• Q#13: Using the e-learning course with the PPT was more irritating than using one with the video.
• Q#14: Learners are more scared when starting an e-learning course with the PPT than when starting one with the video.
CHAPTER 4. CONFIRMATION OF THE IMPORTANCE 44
OF EMOTION DETECTION
Table 4.8: Learning lesson 2 results.
Q.# PPT Video t P-Value Mean SD. Mean SD. 1 2.47 .571 3.97 .809 -8.297 .000** 2 2.63 .556 3.70 .837 -5.816 .000** 3 3.30 .915 3.17 .699 .634 .529 4 3.30 .596 3.77 .728 -2.717 .009** 5 2.83 .699 3.67 .802 -4.290 .000** 6 2.00 .743 2.40 1.070 -1.682 .099 7 1.50 .630 2.23 .817 -3.893 .000** 8 2.10 .803 1.87 .571 1.297 .200 9 2.60 1.248 2.20 .714 1.523 .135 10 1.93 .640 2.40 1.102 -2.006 .051 11 3.10 .923 3.50 .974 -1.633 .108 12 3.60 1.003 3.27 .521 1.615 .114 13 4.17 .747 3.13 .434 6.553 .000** 14 4.40 .770 3.57 .679 4.446 .000** 15 2.03 .765 2.50 .630 -2.580 .012* + p<0.1; * p<0.05; ** p<0.01 Q# : Question number
4.3.4 Comparison of lessons 1 and 2
According to the results in Tables 4.7 and 4.8, I obtained the followings:
• Q#1: The learning process with the video increased more learning attention than the other with the PPT in lesson 2. This may reflect that automatically playing the video in lesson 2 required learners to pay more attention than in lesson 1, because lesson 2’ is more difficult than lesson 1, as I previously mentioned. • Q#2: In lesson 2, Learners were more motivated by the multimedia presentation
in the learning system than the PPT. Future work will investigate which attributes in Table 2 affect motivation.
• Q#4 and #5: Interaction with the learning system using the video increased learners’ positive emotions and lowered their negative emotions better than with the PPT in lesson 2. Future work will investigate which attributes affect positive and negative emotions.
CHAPTER 4. CONFIRMATION OF THE IMPORTANCE 45
OF EMOTION DETECTION
lesson 2. Future work will investigate which attributes affect interest.
• Q#11 and #12: The PPT caused more anxiety and frustration than the video in lesson 1. Future work will investigate which attributes affect anxiety and frustration.
• Q#13 and #14: Using the e-learning course with the PPT was more irritating than the course with the video both in lessons 1 and 2. Starting the e-learning session with the PPT, learners were more likely to be scared than when staring one with the video both in lessons 1 and 2. Future work will investigate which attributes affect irritation and scare.
• Q#15: Using the e-learning system with the video was more tiring than using one with the PPT in lesson 2. Perhaps the automatically playing the video is more tiring than the PPT where the learners could proceed to the next slide themselves. Perhaps the cause is the fact that the content of lesson 2 was more difficult than that of the lesson 1 as I already addressed.
4.3.5 Relation between test and questionnaire results
According to the Tables 4.6, 4.7, and 4.8, I obtained the followings:
• Lesson 1: The mean test score of PPT is significantly higher than that of video, which shows that the PPT is more effective for lesson 1. On the other hand, the results of questionnaire for emotion show that the video is more effective for lesson 1. Therefore, the test scores and questionnaire results do not match. • Lesson 2: The mean test score of video is significantly higher than that of PPT,
which shows that the video is more effective for lesson 2. The results of questionnaire for emotion show that the video is more effective for lesson 2. Therefore, the test scores and questionnaire results match.
CHAPTER 4. CONFIRMATION OF THE IMPORTANCE 46
OF EMOTION DETECTION
directly reflected through the test scores in lesson 2. Therefore, those results show the importance of the emotional aspects in the e-learning systems at least for the difficult contents.
4.4 Discussion
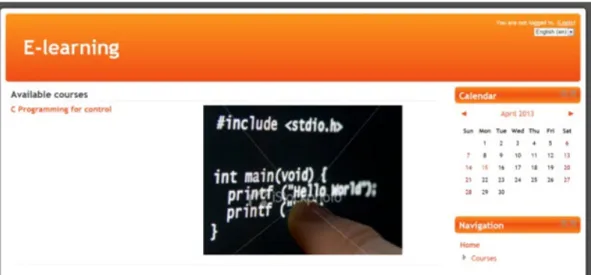
In my system, PPT and video were employed. The reason is they are common to use. Learn-c.org and Khan Academy websites provided interactive computer programming tutorial by using two-window display as window to write code on the left and window to output on the right [62, 63] (Figure 4.9). Rossling et al developed system for algorithm animation such as animal that guides learners to learn the dynamics of program execution by visually demonstrating how the algorithms work [64]. They are more interactive than PPT or video but they are not common to use. These references indicate that there are many possible designs for e-learning tool. However, I think emotional aspect is also important and should be included in every designs of e-learning systems.
(a) code input (b) result
CHAPTER 4. CONFIRMATION OF THE IMPORTANCE 47
OF EMOTION DETECTION
Figure 4.10: Example of the interface design of system for algorithm animation [64]
4.5 Conclusion
In this chapter, I applied the questionnaire to evaluate learners’ emotion during learning using the system. The questionnaire is considered to be an effective tool used to gather opinion from learners. To detect emotions using the questionnaire, a set of question detected different various emotions during the period of learning including attention, motivation, satisfaction, enjoyment, interest, anxiety, frustration, scare, and tiring.
I built a prototype of e-learning system and performed the experiment. The evaluation was based on the scores of pre-test and post-test and the questionnaire about the learners’ emotions.
CHAPTER 4. CONFIRMATION OF THE IMPORTANCE 48
OF EMOTION DETECTION
least for the difficult contents.
Chapter 5
Emotion Estimation in E-learning
System using Eye Tracking
Based on the previous experiment in chapter 4, I employed the questionnaire to screen out two emotion groups. Eye tracking can dynamically capture users’ attention more directly than the other biological signals [65]. In this chapter, I employed eye tracking as a biological signal to detect the symptoms of learners’ emotions. With an eye tracking equipment, I recorded the eye movements of learners and calculated their eye metric indexes, on which I focused to explore their relationship to two learners’ emotions groups: interest and boredom groups. I designed and implemented a prototype and experimentally evaluated it.
![Figure 2.2: Russell’s circumplex model [30]](https://thumb-ap.123doks.com/thumbv2/123deta/9766208.1850212/26.892.266.669.248.626/figure-russell-s-circumplex-model.webp)
![Figure 3.3: Wireless Bio Sensors RF-EEC [52]](https://thumb-ap.123doks.com/thumbv2/123deta/9766208.1850212/36.892.146.790.244.575/figure-wireless-bio-sensors-rf-eec.webp)
![Figure 3.6: Moodle interface [58]](https://thumb-ap.123doks.com/thumbv2/123deta/9766208.1850212/40.892.161.781.207.619/figure-moodle-interface.webp)
![Figure 4.10: Example of the interface design of system for algorithm animation [64]](https://thumb-ap.123doks.com/thumbv2/123deta/9766208.1850212/61.892.249.687.210.622/figure-example-interface-design-algorithm-animation.webp)