Development of high-accuracy clustering algorithm based on statistical test results
2
0
0
全文
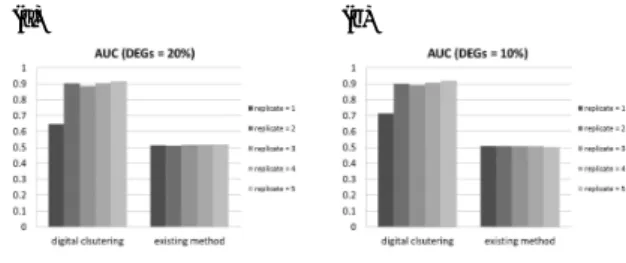
(2) Vol.2015-BIO-43 No.1 2015/9/12. IPSJ SIG Technical Report. (AUC) was used as an indicator in the evaluation. D(Cn , Cm ) = 1 −. (gainn,m − lossn,m ) . (gainn,m + lossn,m ). (1). Let s denote the number of elements of 1 or −1 in the digital vector v(Cn ∪ Cm ) associated with the union of clusters Cn and Cm . Then, gainn,m is defined as s × |Cn ∪ Cm |. Let t denote the total number of elements of 1 or −1 in the digital vectors v(g) with all g in the union. The lossn,m is defined to be (t − gainn,m ). Note that gains and losses are non-negative integer values. If (gainn,m + lossn,m ) = 0, then D(Cn , Cm ) = 0. If any pairs of clusters have the same distance under the above definition, then the digital clustering compares Pearson’s correlation of expression values among them using the group average method. Digital clustering iteratively searches for and merges the pair with minimum distance, constructing hierarchical trees based on statistical test results. Initially, genes that have the same statistical test results are merged because the distance between genes with the same digital vector is zero. Subsequently, digital clustering merges clusters so as to conserve common test results as much as possible. Simulation analysis For benchmark testing, we generated simulated short reads from mouse reference cDNA sequences so that gene expression profiles for four artificial conditions were obtained. We set up the ten digital vectors as the correct DEG labels, and 20% or 10% of genes were randomly selected as DEGs between pairs of conditions so that each DEG belonged to any of ten clusters. The read counts were generated from negative binomial distributions with the mean and the variance which were extracted from Pickrell et al. data [5]. According to the analytical protocol of Trapnell et al. [6], we estimated gene expression levels and searched for DEGs from generated reads. The statistical test results were discretized and vectorized to digital vectors. Finally, digital clustering and hierarchical clustering with Pearson’s correlation using the group average method were applied to the genes.. Results Benchmark testing We evaluated the accuracy of digital clustering and the conventional hierarchical clustering method with Pearson ’s correlation using the group average method for the simulated clusters. For all pairs of genes that have identical labels, we assessed whether they belong to the same cluster after clustering. Genes that had identical labels and belonged to the same cluster were true positives. Genes that had different labels and belonged to different clusters were true negatives. Genes that had the same label and belonged to different clusters were considered false-negatives. Genes that had different labels and belonged to the same cluster were considered false-positives. Thus, we converted the clustering problem to a binary classification problem. The receiver operating characteristic (ROC) curve was created by plotting the true positive rate (TPR; true positive / condition positive) against the false-positive rate (FPR; false positive / condition negative) at the merge step of clustering for each iteration. The area under the ROC curve ⓒ 2015 Information Processing Society of Japan. (a). (b). Fig. 1. Evaluation of clustering.. Figure 1 summarizes the evaluation of the clustering methods. Three simulations were performed for each combination of parameters, and each vertical bar in the figure represents the average AUC for the three simulations. The AUC for the existing method was approximately 0.5 and did not depend on the number of replicates or the proportion of DEGs. Our method not only showed significantly higher accuracy than that of the existing method for all parameter values, but the AUCs also improved when there were two or more replicates.. Conclusion We developed a novel clustering algorithm, digital clustering, based on statistical test results. It demonstrated high classification accuracy when applied to multi-conditional transcriptome data. Digital clustering can be applied to any multi-conditional transcriptome data, and to the results of any DEG detection tool given an appropriate input format. Accordingly, it has a wide range of applications for transcriptome data analysis.. References [1] Metzker, M. L.: Sequencing technologies - the next generation., Nat Rev Genet, Vol. 11, No. 1, pp. 31–46 (online), DOI: 10.1038/nrg2626 (2010). [2] Wang, Z., Gerstein, M. and Snyder, M.: RNA-Seq: a revolutionary tool for transcriptomics., Nat Rev Genet, Vol. 10, No. 1, pp. 57–63 (online), DOI: 10.1038/nrg2484 (2009). [3] D’haeseleer, P.: How does gene expression clustering work?, Nat Biotechnol, Vol. 23, No. 12, pp. 1499–1501 (online), DOI: 10.1038/nbt1205-1499 (2005). [4] Elowitz, M. B., Levine, A. J., Siggia, E. D. and Swain, P. S.: Stochastic gene expression in a single cell., Science, Vol. 297, No. 5584, pp. 1183–1186 (online), DOI: 10.1126/science.1070919 (2002). [5] Pickrell, J. K., Marioni, J. C., Pai, A. A., Degner, J. F., Engelhardt, B. E., Nkadori, E., Veyrieras, J.-B., Stephens, M., Gilad, Y. and Pritchard, J. K.: Understanding mechanisms underlying human gene expression variation with RNA sequencing., Nature, Vol. 464, No. 7289, pp. 768–772 (online), DOI: 10.1038/nature08872 (2010). [6] Trapnell, C., Roberts, A., Goff, L., Pertea, G., Kim, D., Kelley, D. R., Pimentel, H., Salzberg, S. L., Rinn, J. L. and Pachter, L.: Differential gene and transcript expression analysis of RNA-seq experiments with TopHat and Cufflinks., Nat Protoc, Vol. 7, No. 3, pp. 562–578 (online), DOI: 10.1038/nprot.2012.016 (2012). 2.
(3)
図
関連したドキュメント
To overcome the drawbacks associated with current MSVM in credit rating prediction, a novel model based on support vector domain combined with kernel-based fuzzy clustering is
This “index jumping” phenomenon in order to stay on a “continuous eigenvalue branch” is quite general: It applies to all simple eigenvalues for all boundary conditions on the jump
In particular, we consider a reverse Lee decomposition for the deformation gra- dient and we choose an appropriate state space in which one of the variables, characterizing the
By an inverse problem we mean the problem of parameter identification, that means we try to determine some of the unknown values of the model parameters according to measurements in
The key point is the concept of a Hamiltonian system, which, contrary to the usual approach, is not re- lated with a single Lagrangian, but rather with an Euler–Lagrange form
After introducing a new concept of weak statistically Cauchy sequence, it is established that every weak statistically Cauchy sequence in a normed space is statistically bounded
Massoudi and Phuoc 44 proposed that for granular materials the slip velocity is proportional to the stress vector at the wall, that is, u s gT s n x , T s n y , where T s is the
The main idea of computing approximate, rational Krylov subspaces without inversion is to start with a large Krylov subspace and then apply special similarity transformations to H
