C08
Hydrologic and snow melt modeling of Astore river basin under changing climate
○ Sohaib BAIG, Takahiro SAYAMA, Kaoru TAKARA
(1) Introduction:
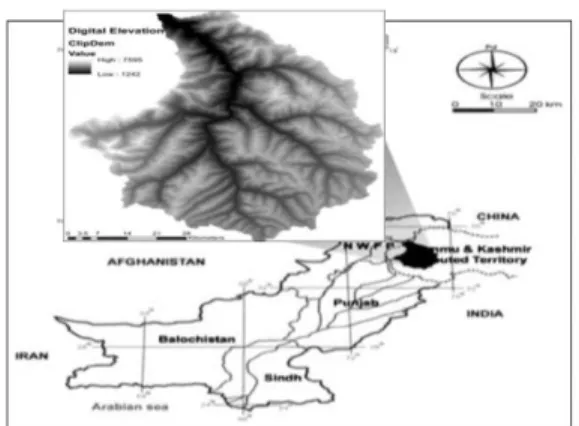
The Astore river basin flows from Himalayan mountain range. The elevation ranges between 1247 and 7595 meters and covers area of 3927 km2. About 8 % of
the area is covered with glaciers which lies between 3000-7595 meters (Fig. 1). The land cover consists of bare soil, forests and agriculture however most of the area is bare soil.
The climate in the basin varies highly with space and time. Specifically, the variations in precipitation and temperature in space and time are crucial for hydrologic cycle. The basin has four climate stations and the average precipitation is around 500 mm annually (2006-2010) which is significantly less than streamflow (1084 mm).
This study will help in understanding basin’s water cycle and to make this knowledge relevant to decision makers for planning. This research will be useful in estimating the impacts of climate change
and extremes on water availability, hydropower generation and water related hazards
(2) Application of the snow and glacier melt models with the RRI Model
Metrological and hydrological data was obtained from Water and Power Development Authority and Pakistan Meteorological Department. Data consist of maximum, minimum temperatures, precipitation and streamflow. Precipitation and temperatures from four climate stations were used to calculate the average time series of temperatures. Glacier cover was retrieved from ICIMOD(1).
The basin is divided into the following 5 zones for estimating snow and glacier melting. The mean elevations of zones are 1250-2000, 2000-3000, 3000-4000, 5000-6000, 6000-7565 meters. Melt from snow and glaciers and rainfall is used as input for RRI model. (2.1) Cema-Neige snow model
This is a degree-day melt model and uses maximum (𝑇𝑚𝑎𝑥), minimum (𝑇𝑚𝑖𝑛) and mean air temperatures ( 𝑇𝑚𝑒𝑎𝑛) to distinguish between rainfall and snowfall. It has additional feature of estimating the snow cover area in the basin(2).
(2.2) Glacier Melt Model
The glacier melt is quantified using a degree-day model explained by (3). (Eq 1) is used to calculate daily
melt from clean ice and debris-covered glaciers. Fig. 1 Digital Elevation model of Astore River Basin.
𝐴𝐶𝐼/𝐷𝐶
= {𝑇𝑎𝑣𝑔 . 𝐷𝐷𝐹𝐶𝐼/𝐷𝐶 . 𝐹𝐶𝐼/𝐷𝐶 𝑖𝑓 𝑇𝑎𝑣𝑔 > 0 0 𝑖𝑓 𝑇𝑎𝑣𝑔 ≤ 0 (1) In the above equation ACI/DC refers to daily glacier
melt from clean ice and debris covered glaciers, DDFCI/DC (mm C-1 day-1) are degree day factors
respectively and FCI/DC are the proportion of clean ice
and debris covered glaciers in the given zone. The degree day factors are set by calibration. The total glacier melt is the sum of both ACI/DC (Eq 2).
𝐴𝐺𝐿𝐴𝐶= (𝐴𝐶𝐼+ 𝐴𝐷𝐶). 𝐺𝑙𝑎𝑐𝐹 (2) GlacF is the fraction of glacier in the given elevation zone.
(3) Results:
Fig. 2 Simulation results of the river flows The simulation was performed for 6 years, Oct 2001~Dec 2004 for calibration and Jan 2007~Dec 2009 for validation. The simulated discharge with observed and runoff is shown in (Fig 2).
The melt model and RRI have been able to simulate the response of the basin well. The degree day factors and temperature and climate at higher elevations i.e. 3000 m ~ 5500 m play vital role in the runoff contribution. However, betterment in the estimation of precipitation and temperatures is required.
The model can be used to evaluate the impacts of receding glacier cover and changing climate on water balance.
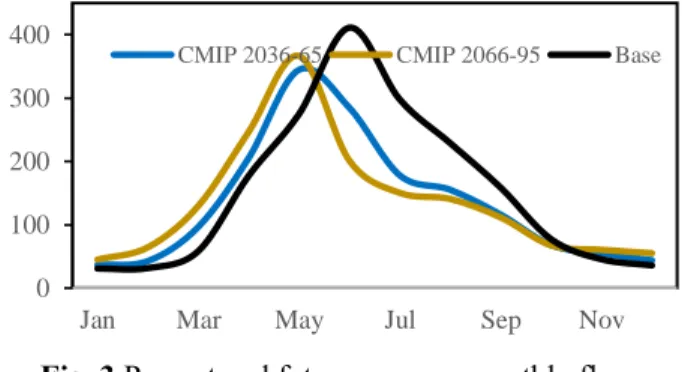
Fig. 3 Present and future average monthly flows A comparison of current monthly flows and future flows in middle and end century is shown in (Fig. 3). Presently the maximum flow is recorded in June when glacier and snow melt reaches their maximum. The summer rainfall contributes less in comparison to the melt component in the annual streamflows. In the mid-century and late-mid-century glaciers will lose 40% and 80% of the mass respectively. This will substantially affect the summer flows. In the late century the summer flows will reduce up to half of current quantity.
References:
Bajracharya, S. R. Regional Database System. [Online]
12 19, 2018.
http://rds.icimod.org/Home/DataDetail?metadataId=3102 9&searchlist=True.
Terink, W., Lutz, A., Simons, G., Immerzeel, W., & Droogers, P. (2015). SPHY v2.0: Spatial Processes in HYdrology. 8.
Valery, A., Andréassian, V. and Perrin, C. Regionalization of precipitation and air temperature over high-altitude catchments – learning from outliers,
Hydrological Sciences Journal pp. 928-940, 2010
0 200 400 600
Oct-01 May-02 Dec-02 Jul-03 Feb-04 Sep-04
D is ch arg e (m 3 /s ) Observed Simulation 0 200 400 600
Jan-07 Jul-07 Jan-08 Jul-08 Jan-09 Jul-09
D is ch arg e (m 3 /s ) Observed Simulation 0 100 200 300 400
Jan Mar May Jul Sep Nov