The Japanese Psychonomic Society
NII-Electronic Library Service The JapanesePsychonomic Society
TheJopanese
.Jburnai
of.Rs),chenomic
Science2eQ9,Vol.2g,No,1.,95-!06
Lecture
Brighteningprospects
for
understanding
perceived
luminance
MarkE.
McCouRT*
andBarbara
Nbrth Dakota
State
VdeiversiCythe
neural
coding
of
BLAKESLEE*
*
Along
with color, depth and motion,brightness
isa fundamental quality of vision, and understanding the neural mechanisms ofbrightness
perceptionis
a topicofintense
interest
andcontroversy, both histortcallyand incontemporary vision research. With few exceptions, modern
textbooks stillpromote the
fiction
thatbrightness
induction
(e.g.,
simultancousbrightness
con-trast)results
from
lateral
inhibition
in
isotropic
filters,
such as the cireularly-concentricfields
found inthe retina. However, because brightness induction occurs over visual angles farinexcess
of the
dimenstons
ofindividual
retinal receptivefields
(up
to10
degrees
visual angle), "fill-in"accounts of brightness were proposed
based
on cortlcal mechanisms.A
secondhistorical
challengeto
retina],accounts ofbrightness
induction wasWhite's
effect,inwhichthe
brightness
of mid-graypatches situated on the dark and
bright
bars
of a square-wave grating was opposite to that predicted by the output of circularly-concentric receptive fields.White's effect was a watershedevent which caused spatia]
filtering
accounts ofbrightness
tobe
abandoned, and encouragedi thedevelepment
ofhigh-level
theoriesofbrightness
perceptionbased
largely
onHelmholtzian
idea
of"unconscious inference". Through 25
year of systematic analysis of the grating induction effect
Barbara
Blakeslee
andI
have
developed
a "second-generatien7'theory of
brightness
perceptionwhich
is
based on oriented multi-scale spatialfiltering
whichincorporates
well-known properties of early cortica! processing such as contrast normalization.We
have
recently appliedthe
ODOG
model toevaluate "anchoring"as an explanation of
lightness
perception,
with thegoal
ef clarifyingand synthesizing theunderstanding of brightness and lightness.
Key
words: brightness, gratinginduction,
computational modelingWhat
is
Brightness?
Brightness,
a]ong with color and motion,is
afun-damental quality of hurnan vision. Bn-ghtness is
defined
as the attribute according towhich a visualstirnulus appears to be more or lessintense,or to
emit more or
Iess
light.
Brightness
rangesfrom
bright to dim, Unrelated achromatic colors
Cpre-sented alone
in
adark
field)can vary onlyin
bright-ness
(CIE,
l970).Brightness
is
correlated withlumi-nance, especially forunrelated stjmuli, and another
common
definition
ofbrightness
is
perceived lumi-nance{Arend,
1993).
TheCIE
adds the property ofJightness
toretated achrornatic stimuli{presented
in
adisplay
containingmultiple stimulD.Lightness
is
theattribute・according to whieh a visua] stimulus
ap-* Department of Psychology, Center for Visua]
Neuroscience,
North
Dakota
State
University,
Fargo,
ND
58108-6050.
U.S.A.
pears toemit more or
less
light
in
proportion tothatemitted
by'
a similar(liitguminated
area perceived as"white". Thus, the CIE definition
of ]ightnessis
rela-tive
brightness,
Lightness
rangesfrom
verylight
orwhite, to very
dark
orb]ack.
Although
unrelatedcolors can appear white, only related colors have a
gray or black component and possess a perceptual
dimension
(blackness)
thatdoes
not existfor
unre-lated
celors.This
addeddimension
arises throughspatial interactions,revealed in some instances by
induction
effects thatcan occur onlybetween
relatedstirr]uli
{Wyszecki
&
Stiles,
1982;WyszeckL
1986;Lennie
&
D'Zrnura,
1988;
Pokorny,
Shevell,
&
Smith,
1991),
71heUtilingofBrightness "tusions
Perceptual illusionsprovide
information
about thernechanisms underlying nerma! visual perception,
including
that ofbrightness
andIightness.
A
large
Copyright2009.The JapanesePsychonomic Society,Allrights reserved. NII-Electronic
NII-Electronic Library Service
96 The
Japanese
Journal
of PsychonomicScience
Vol.28,No.
1and growing number of
intriguing
brightness
illu-sions have been introduced over the past several
decades; however the number and diversity of
pro-posed explanations
for
these
illusions
is
cumbersome(Kingdom
& Moulden, 1988; FiorentinLBaumgart-ner,
Magnussen,
Schil]er,
&
Thomas,
1990;
Gilchrist,
Kossyfidis,
Bonato,
Agostini,
Cataliotti,
LL
Spehar,
Annan,
& Economou,].999;
Adelson, 2000),Al-though phenomenal
illusions
themselves are oftcnargued to support a particulartheory of brightness
coding, quantitative
data
based
on experimentswhich critically test these claims
is
often lacking.The
goal of our reeent research(Blakeslee
&
McCourt,
1997,
1999,
2001,
2e03,
2004,
2005,
2008;
Blakeslee,Pasieka & McCourt, 2005;Blakeslee,Reetz,
&
McCourt,
2008,
2009)
has
been
to remedy thesedeficienciesby measuring and modeling the spatial
interactions
between
different
areas of the visualfieldthrough the quantitative study of brightness
illusions.
Collecting
quantitative psychophysicaldata
onbrightness
Musions
enlarges thequantita-tivedatabase tocTitically testtheoriesof brlghtness
perception. These
data
inform the continueddevel-opment of amechanistic model of
brightness
percep-tion,the
ODOG
model of Blakeslee and McCourt(1999).
TheODOG
modelhas
simplified ourunder-standing of the rnechanisms underlying
brightness
perception by simultaneously encompassing a large
number ofseemingly
diverse
brightness
phenomena
with a
history
ofdifferent
explanations. Theseex-planations
include
low-level
spatialfiltering
mecha-nisms-the modern equivalent of lateral-inhibitjon originally proposed by Mach
{1838-1916)
and Iaterelaborated
by
Hering
(]834-1918);
explanationsin
terms of
T-
andX-junctions
(Todorovic,
1997;
Zaidi,
Spehar,
&
Shy,
1997};
higher-level
mechanismsin-volving perceptual
inferences
aboutdepth
and!ortransparencyLsuch as these firstproposedi
for
illu-mination by He]mholtz
(1821-1894);
andexplana-tions
in
whichthe
key
factoris
perceptual grouping(GIIchrist
et aL,]999;
Ross
&
Pessoa.
2000)derived
from
theGestalt
principle ot "belongingness"(Gil-christ et aL,
1999;
Kingdom,
1997),The de'finjngfeatures of the ODOG model, which
include
multiscale spatialfiltering,
orientationseLec-tivity
and responsc normaljzation, are characteristicsof cortical visual processing
(Rossi
&
Paradiso,1999;
Rossi, Rittenhouse, & Paradise, 1996;
Gilbert,
Das,Ito,
Kapadia,
&
Westheimcr,
1996;Geisler
&Al-brecht, 1995).
We
contend that explanations couchedin
terrns
of "higher-level"mechanisms are
not required to explain the rnajority of the wide
variety of brightness
illusions
we have examined(Blakeslee
&
McCourt,
1997,
1999,
2001),
and that these illusionsare moreparsimoniously
accountedfor
by
theODOG
model,The
explanatory power ofthe
ODOG
modeldoes
not necessarily confiict withjunction
or grouping analyses, and may actuallyrep-resent amechanistic
basis
for
both.
Final]y,
therearea nurnbeT of effects thatremain unexplained
by
theODOG
modeLA
careful analysis of these Musionswill help to refine the modeL and todetermine the
circumstances under which higher-lcvel factors do,
in
fact,
exert uniqueinfiuences
onbrightness
percep-tion,
A
Spatiat
Nttering
Approach
Simultaneous Bn'ghtness Contrast and
Grating
induc-tion
The brightness of a region of visual space depends
upon the luminance of adjacent regions, Brightness
induction,
in
¢ludesboth
assimilation and contrasteffects. Assimilation occurs when thebrightness of a
test region
becomes
more similarin
brightness
toadjacent regions. Ingeneral,assimilation effects
oc-cur
in
complexdisplays
with small(high-frequency)
patterns(He]son,
1963;Smith,
Jin,
&
Pokorny,2001).
Contrast effects occur when the brightness of a test region appears more different in brightness than
adjacent regions.
A
wel]-known exampleis
simulta-neous
brightness
contrast<SBC).
SBC
produces a(nearly)
homogeneous
brightness
change within an enelosed testfield
such thata gray patch on a whitebackground looksdarker than an equiluminant gray
patch on a black background
[Fig.
1(a)].This effecthas been well quantified with respect to inducing background and testfieldluminance
(Heinemann,
1955).
Although
SBC
decreases
withincreasing
te$tfieldsize,brightness
inductien
occursfor
testfieldsas
large
as 100(Yund
&
Arrnington,
1975).
Since
thisThe Japanese Psychonomic Society
NII-Electronic Library Service The JapanesePsychonomicSociety
M.
E.
McCouRT
andB.
BLAKEsLEE:
Neural
coding of perceived1umlnance97
dilstancefar exceeds the
dimensions
of retinal orLGN
receptive fie]dsinmonkey(DeValois
& Pease,1971;
Yund,
Snodderly,
Hep]er,&
DeValois, 1977;'li'
"',i.i M l/-・-1,・-・
'
.sE-E'RruE[et-=en9eoo=cu.=-E="o==o-evE=cueE
e.Ts e.se O.25DeValois
&
DeValois,1988),
a common explanationfor
SBC
has
been
thatthebrightness
of the test fieldisdetermined
by
theinformation
at the edges oi the75 50 25 o
・25
-50
-75
75 50 25 owa-25so
60LE-T5LL
75el-sosdi 2Sat o-25
-sg
-TS
O.75 O,50 O,25,t,/.!gtt/
igk
rmk."
(f)
}・・i"1,, t/.. rdiEE'X',,x,,
l"''''"''''"''"'11
.,,1'
1,,,,ll
l.,/
{t
l
4/l・K x'L,kI,,x/" e,75 O,50 O,25 D.75(j)
H 32o'fi'
k1(k)
t }7 O,50 O,25o256 5ri2 76e tD24
755D25
a-25.50-75o256
512 76S t024
Spatial
Position(pixels}
Fjgure 1
{a-d)
Four
of the stimuli used to measure the effect of testfield
width on inductionmagnitude.
Display
widthis
320;
testfield
widths ofla,
60,
!20
and320
areillustrated.
Test
field
height is10. Sinewave inducing contrast was constant at
O.75.
Test
field
luminance
was set to thernean of the display
(50
cdlmZ), Note that panel(a)
isa"c]assical"
simu]taneous brightness contrast
(SBC)
stimulus(i.e.,
two IDX10 test fields),and that panel(d)
isa standard grating induction{GI)
stimu]us
(i.e.
a continuous testfield
spanningthe
display).
(eAh)
Point-by-point
brightness
matches(at
O.250
intervals)
across the testfields
ofdisplays
il]ustrated
in panels{a-d).
Open symbols plot meanbrightness matches made tothe testfields
(proportion
mean Iuminance ± 1s.e.m.);filled
symbolsin
(e)
are brightness matches to the
inducing
grating.The
light
grayline
depicts
the veridicalluminance
profileof the stimulus dispLay along a horizontal linethrough the vertical center oi the test
fie]d
anddisplay.
<i-1)
Solid linesrepresent slices taken through theODOG
mode[ filteroutput ioreach o"hestimulus disp]ays inpanels
(a-d),
The lightgray ljneagain depictsthe veridical luminance profile of
the
$timulus displaytaken
at the vertical center of the testfield.
Notc the excellent qualitative andquantitative agreement between the ODOG model output and the corresponding poinVby-point
brightness
rnatchingdata,
The model captures the magnitude and structure of brightness inductionwithin the homogeneeus test fields
Ci-1),
as well as the brightness of the inducing grating itself(D,
SBC and GI are thus demonstrated to be congruent phenomena, which are both accounted forby the
NII-Electronic Library Service
98
The
Japanese
Journal
ofPsychonormcScience
VoL 28,No. 1 bounded region andis
subsequentlyfi11ed-in
oras-signed to theentire enclosed area
(Shapley
&
Enroth-CugelL
1984:
Cornsweet
&
Teller,
1965;
Grossberg
&
Todorovic, 1988; Paradiso & Nakayama, 1991;Rossi & Paradiso, 1996;Paradiso
&
Hahn,
1996;
for
reviewsee
Kingdom
&
Moulden, 1988). Evidence suggeststhat this explanation istoo sirnple, and that
distal
factors
must play a role(Arend,
Buehler.
&
Lock-head, l971;Land & McCann, 1971; Heinemann, 1972;
Shapley
&
Reid,
1985;
Reid
&
Shapley,
1988).
Grating induction
(GI),
unlike SBC, isan induction effect thatproduces a spatial brightness variation(a
grating)
in
an extendecl testfield
[Fig.
I(d}].
The
perceived contrast of the induced grating decreases
with
increasing
inducing
gratingfrequency
and withincreasing test fieLdheight
(McCourt,
1982},suchthat
canceling contrastis
constantfor
a constant product of inducing frequency and testfieldheight(McCourt,
1982; Folcy & McCourt, 1985).GI,
likeSBC,
extends overlarge
distances,
sinceit
is
stillobserved intestfieldsat leastas largeas 6n
(Blakeslee
&
McCourt,
I997).Unlike
SBC,
however,
homogene-ous
brightness
fi1]-in
cannot account forGL
Severalbrightness models have been
proposed
thatincorpo-rate non-hornogeneous
fill-in
mechanisms(Grossberg
& Mingolla, 1987; Pessoa, Mingolla,
&
Neumann,1995),
however,these
mode]shuve
not beensuccess-fully applied to grating induction. Blakeslee and
McCourt
(1997)
suggestedthat
GI
mightbe
under-stood
in
terms of the output of paralle]spatialfilter-ing across mu'!tiple spatial scales
(Moulden
&King-dom,
1991>.An
attractive featureof thisapproach isthat
both
thelow-pass
spatialfrequency
response ofGL and the invariance of
induction
magnitude with viewing distance(i.e.
the tradeoff between theef-fect$of inducing grating spatial frequency and test
field
heighO,
areboth
parsimoniously explained bymultiscale spatial
filtering.
Despite the
fact
thatSBC
is
typicallyconsidered ahomogeneous
brightness
effectdependent
on afi11-in
mechanism, whereas grating induction possesses spatial structure wbich cannot bc produced by a
homogeneous filt-inmechan,ism, ithas bcen
sug-gest.edthat eithcr SBC isa special law frequency
instance ef grating
induction
(McCourt,
1982), orthat
GI
isa particularcase ofSBC
(Zaidi,
1989;
Moul-den
&
Kingdom,
1991).
Blakeslee
and McCourt{1997)
asked whether the mechanism(s) underlyingGI could also account
for
SBC,
or iffundamentally
different
mechanisms were required toexplain thesetwo effccts. The structure and magnitude of
induc-tion
in
both
GI
andSBC
stimuli were measuredwherc the
inducing
¢onditions for the two effectswere rendered as similar as possible
by
employingone cycle of a
low
frequency
sinewave grating as theinducer, Test fielddimensions spanned a range that
incorporated
both
c]assicSBC
andGI
configurations[see
Figs.ICa-d)],
At
each of threetestfield
heights
(1=,
30 and 6C),point-by-point brightness matches{Heinemann,
1972;
McCourt,
1994}
were obtained atintervalsof O.250,fortestfieldwidths of 320
{the
GIcondition),
140,
120,
8e,
60,
30
andIC
[Fig.
1(e-h)].
Potnt-by-point brightness matches were analyzed to assess systematic changes ininduction structure
(i.e.,
departures
from
the sinusoidalbrightness
variationseen in320 wide testfieldGI condition} and in the
average magnitude of
brightness
anddarkness
in-duction within the test
fields,
as afunction
ot test fieldheight andi width. In the widest test fieldsinduction
structure was well accountedtor
by
thesinewavc pattern observed inthe
GI
condition. Astest
field
widthdecreased
thesinewave amplitude ofthe induced structure
in
thetestfield
decreased
Ci.e.
the
patternflattened),
and eventuallybccame
nega-tive
(i.e.,
showed a reverse cusping) at the narrowertestfieldwidths. Both the structure and magnitude
of brightness induction as a function of changing
test
field
1iejghtand width were parsimoniouslyaccounted
for
by the output of adifferentially
w・eighted, octave-interval array of sevendifference-of-Gaussian
CDOG)
filters[Fig.
1(ILI)],Thls array oi spatial filtersdiffered from those previous]yem-ployed to rnode] spatial vision in that itinc]uded
mechanisms tuned to much lower spatial
frequen-cie$.
We
postulatethal
suchfilters
exist at thoselevelsof thevisual system where
brightness
perceptsare determined.
Recent
evidence shows that a sig-nificant number of cellsin
cat and monkey primary' visual cortex respond ina manner correlated withbrightness over distances farlarger than thesize of
The Japanese Psychonomic Society
NII-Electronic Library Service The JapanesePsychonomic Society
M
E.
McCouRT
andB.
BLAKEsLEE:
Neura1
coding of perceived luminance 99their "classica]"
receptive
fields
(Rossi
et a].,1996;
Gi]bertet al. 1996).Thus lateralinteractionsat early
levelsof visual precessing, or feedback from hierar-chically
higher
processing areas(Larnme
&
Roelf-sema, 2000),may allow the integration of brightnessinformation
over]arge
regions of visual space,This
simplc
filtering
explanation can also be generalizedto account forother brightness phenomena
includ-ing
Zaidi's
(1989)
GI
demonstrations
showingboth
localand distal effects;
Shap]ey
and Reid's(1985)
contrast and assimilationdemonstration
modeled asdue totheintegration of localcontrasts across space;
and theinduced spots seen at the street intersections
of theHermann
Grid
classically explainedin
terms of on- and off-center receptive fields(Fiorentini
et a].,1990).
Thus,
the model ofBlakes]ee
andMcCourt
{1997)
brings
together with a common explanation avariety of seemingly
diverse
brightness
phenomenawith a history of differentexplanations that include
local
spatialfiltering,
filling-in
and edgeintegra'tion.
IVhitels
EtTectand fk)dorovids SBCDenvonstration
B]akeslee
andMcCourt
{1999)
subsequentlyad-dressed a group of effects, including the White effect
(White,
1979)
[Fig,
2(a)],
and aSBC
demonstration
ofToderovic
(1997}
[Fig.2(b)],
which cannot beac-counted forby isotropiccontrast models such as the DOG moclel or
fi11-in
models. IntheWhite effect. graytesL patches of identicaL
]uminance
placed on theblack
and whitebars
of a square-wave gratingap-pear differentin bTightness,
What
makes the effectso
interesting,
however,
is
that thedirection
of thebrightness change isindependent of the aspect ratio of the testpatch. Unlike
SBC
and GI,theWhite effectdoes
not correLate with theamoun't ofblack
or whiteborder in contact with the testpatch, For exarnple,
when
the
gray patchis
a vertically orientedrectan-glesittjng atop a white stripe of a vertical grating,
it
has
two short sides that arein
contact(above
andbe]ow)
with the coaxia! white bar upon which itsits,and two leng sides
(left
and right) thatare incontact with theflanking black bars[see
Fjg.2(a)].Thus thetestpatch has greater contact with the dark fianking
bars yet itappears da'rkerthan a simiLar gray patch
fianked
by
whitebars.
This
is
not an assimilation:II'
i
e
sEIiGii
tEI:fi
Figure 2,
(a)
An
example ot theWhite
lus.
(b)
Todorovic's
variation of aous brightness contrast stimulus, In both
stimult the gray test patches are
minant,
but
appeardifferent
in
brightness.
These
effects are not explicab]eby
contrastmodels utilizing isotropicspatial filters.After
Blakeslee and McCourt
{1999).
effect since even ifthe height of the test patch is
reduced so
it
has
more extensiveborder
contact withthe bar on which itjssitting
(i.e.
the coaxial whitebar),
thedirection
of the effectis
unchanged(White,
1979, 1981), White
{1979)
cencluded thatexplana-tions
{whether
contrast or assimilation) thatdepend
simply on the relative amounts oi
black
and white surrounding thegray elements could not explain theeffect,and that
directional
(orientation)
properties ofthe inducing grating must be importanL A number of qualitative filteringexplanations have been
offered
for
theWhite
effect.White
himself
proposeda mechanism called "pattern-specific inhibition"
{White,
1981L
based
on the notion that elongated cortical fiLtershaving similar preferred orientation and spatialfrequency
selectivity, and which receivedtheir input from adjacent retinaL locations,might
tend to inhibit each other and thus produce the
effect Foley and McCourt
(1985)
suggested thathypercornplex-like cortical filterswith small centers and elo'ngated surrounds might be responsible for
NII-Electronic Library Service
100 The
Japanese
Journal
of PsychonomicScience
VoL28,No.
1
dual mechanism model toexp]ain the results of an
investigation
in
which they varied theheight
ofboth
the
fianking
and coaxialinducing
bars. Theycon-cluded that a localmechanism, mediated
by
circu-larly
symmetric center-surround receptivefields,
op-erated a]ong the
borders
of the test patch andpro-duced
a particularlystrong signal at thecornerinter-sections of the testpatch with the coaxial bar.
Ac-cording totheir model itisthiscorner signal thatin
some<unspecified}
mannerdisproportionately
weights the coaxial bar relative to the fiank and
induces brightness
into
the testpatch,Additionally,
they proposed that a more spatially extensive mechanism was requiredto
allow the coaxialbar
teexert an
infiucnce
on thebrightness
of thetestpatch
throughout
its
length. This mechanism issimilar to thatproposedby
Feley
andMcCourt
(1985).
Other
exp]anations of the White effect are basedon higher-order perceptual inferences involving
depth and!or transparency, and the
Gestalt
notion of"belongingness"
(Agostini
&
Profitt,1993; Taya,Ehrenstein & Cavonius, 1995; Spehar, Gilchrist
&
Arend,
1995;
Anderson,
1997;
Ross
&
Pessoa,
2000).
According to the
Gestalt
approach, perceptualor-ganization
{such
as relativedepth
relationsin
theWhjtc stimulus) influence brightness contrast such
that surfaces predorninantly interact
(contrast)
with other surfaces wjth which they are grouped.Agostini and Profitt
(1993)
and Gilchristet al,(1999')
argued thatin
theWhite
effect thetestpatch appears]ighter
(or
darker) when itison the black(or
white}bar
because
oi the phenomenalimpression
thatit
Ltbelongs
to"or has been
`Lgrouped
with" that bar.According to Gilchrist et aL
{1999)
the groupingfactor at work
here
i$
the
T-junction.
whichis
thought tosignal
depth
through occlusion.Of
note,however, isthat both Zaidiet aL
(1997)
and Todoro-vic(1997)
argue that while an explanationbased
on an analysis of localjunctions
inthe stimulus, spe-cifically T-junctions,can account for"rhite'seffect, itdoes net require that T-junctions contribute to per-ceptual organization.
Although both theT-junction and grouping
ana]y-ses offer useful rules forqualitatlvelypredicting the appearance of various
brightness
effects, theyfall
(a)
(d)
(b)1234ss7
Ce)(D
(g)
2
s
*as-mes
*ma-matw*me-me
amil
*ma=wa
(tztzb*ew-me
%*pt-ew
ipg・;tt'i'E /・ti(c) /.n:l:IobOGCerrte;Fr;nyuenc.y'telgeg/(h)
z
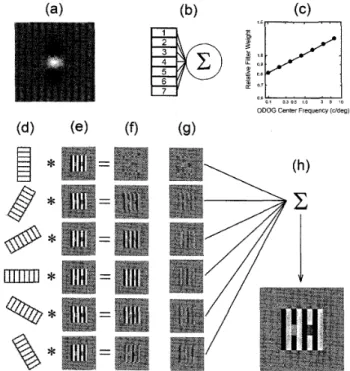
Figure
3.
Adiagrammatic
representation ofthe
Oriented
Difference-of-Gaussians
(ODOG)
model of
brightness
erception,(a)Illustra-tion of a two-dimensional riented
difference-of-Gaussian
(ODOG)
filter.
(b)
Seven
filtcrs,
with centerfrequencies
spaced at octaveintervals,
are summed within orjentationafter being weighted across frequcncy
(c}
using a power
functjon
wtth a slope ofO.1.
(d)
The
resulting six multiscale spatialfilters,
one for each orientation, are convolved with stimuli of interest(e>,
inthisinstance aWhite
stimulus.
The
convolution outputs(/t)
arepooied
across orientation according to theirspace-averaged root-mean-square
{RMS)
tivity level
(g)
to produce a resultant output
(h),
After
Blakeslee andMcCourt
(1999).
Table
1Differenccof Gaussian space constants
Filter
Space
constantCenter
Surround
1234567.0470.094D.18sC.37sO
・7so
1.so 3o.Og3n.18so.37so
-7sz
1.sc 3e6c
NII-ElectronicThe Japanese Psychonomic Society
NII-Electronic Library Service The JapanesePsychonomic Society
M.
E.
McCouRT andB. BLAKEsLEE: Neural coding of perceived luminance 101short of
identifying
an underlying mechanism.B]akeslee and McCourt
(1999>
were able teprovidesuch a mechanistic exp]anation in the form of an
oriented-difference-of
Gaussians
{ODOG)
modet.The
oriented filtersof theODOG rnodel were produced
by
setting the rati,oof
DOG
center/surround spacecon-stants to 1:2 inone orientation and to
1:1
in
theorthogonal orientation
[Table
1].A
gray leve],repre-sentation ofsuch an
ODOG
filter
appearsin
Fig.3(a}.
The center iscircular and thesurround extends be-yond theeenter
for
adistance
of twtcethecenter sizeinone or,ientation but isthesame sizeas thecenter
in
the orthogonal orientation, These filterscan be
de-scribed as
Gaussian
blobs
withinhibitory
fianksor assimp]e-like cells
{such
as thosefound
in
the cortex ofmonkey or cat) that are orientation and spatial
fre-quency
selective. The ODOG mode]is
irnp]emented
jn
6
orientations(O,
30,60,
90,
-30
and-60
degrees).Each orientation
is
representeclby
sevenvolume-balanced filtersthat possess center frequencies
ar-ranged at octave intervals
{from
O.1-6.5c/d). The seven spatialfrequency
filters
[Fig.
3Cb)]
within eachorientation are summed after weighting across
fre-quency using a power
function
with a slope ofO,1
[Fig.
3(c)],This slopeis
consistent with the shallowlew-frequency
fall-off
of thesuprathreshQld contrastsensitivity
function
thatis
expected tobe
associatedwith the high-contrast stimu]i under investigatien
(Georgeson
&
Sullivan,
1975).
The
resulting six rnultiscale spatialfilters,
one per ortentation, arecon-volved with the stimu]us of tnterest
[Fig.
3(d-e)j,
'The
filter
outputs[Fig,
3{f)]
are pooled acrossorienta-tion according to their space-averaged root-mean-square
(RMS)
activityleveL
as computed across theentire irnage,The pooling isinaccord with a simple
response norrnalization in which the filteroutputs
are weighted such that the
RMS
contrastin
the"neural images"
across orientation channels are equated
[Fig.
3(g)].Response nonlinearities foundin
neuronsin
cat and rnonkey visual cortex, such as contrast gain control and the rapidly acceleratingincrease
inresponse at low contrast and saturation athigh
contrast, may represent the physiologicalsub-strate forthis type of response normalization
(Geis]er
&
Albrecht,
1995).
Note
thatwhen thefilters
of theODOG
model are linearlysummed across thefull
range of orientations within each spatial
frequency
these filterscombine to produce a
DOG
filter.
Thus
the DOG model of Blakeslee and McCourt
(i997)
issimply a subset of the
ODOG
mode]in
which thefilter
outputs arelinearly
pooled,
As
mentionedpreviously,
thedefining
featuresofthe
ODOG
model e.g., rnultiscale spatialfrequency
filtering,
orientation selectivity and responsenor-malization, are response characteristics thatare rou-tinely observed at early cortical stages of visual proc-essing
in
both
cat and rnonkey(Rossi
&
Paradiso,1999;Rossi et al. 1996;
Gilbert
et al. 1996;Geisler
&
Albrecht, 1995). ILis specifically the addition of orientation selectivity and response norma]ization,
however, that allows the model to accoun,t
for
an-isotrepic
effects such as theIVhite
effect.An
intui-tive sense
for
the model can be obtainedfrom
exam-ining
Fig.
3(d-f),
When
thelong
axis of themultis-cale
ODOG
fi]ter
!svertical, asit
is
in
theorientation represented by the top row of Fig.3(d-f),theconvo-lution
output of thisfilter
with theWhite
stimulusshows the greatest activity
in
the region of the testpatches and produces the
White
effect.Although
thetop and
bottom
edges of theinducing
grating arealso a good stimulus for this filter,the inducing
grating
itself
is
not.This
situationis
largely
re-versed in the convolutjen output of the multiscalefilterwith ahorizonta]orientation, represented
in
thefourth
row ofFig.
3(d-f).Here
the activity generatedby theinducing grating is
high
compared tothatforthe testpatches.
Added
together,however,
thesetwofilterorientations represent both the testpatches and
the
inducing
grating,Response
normalization priorto summation simply weights the
foatures
extractedby these two filtersequally. This prevents high
contrast
features
Csuch
as theinducing
grating)cap-tured at one orientation from swamping ]ower
con-trastfeatures
{such
as the testpatches) captured at another orientation.Blakeslee and McCourt
(1999)
showed that theODOG
model qualitatively predicts the relativebrightness
ofthe
testpatchesin
theWhite
effect, theTodorovic SBC demonstration. GI and SBC, and
quant,itativelypredicts the relative rnagnitudes of
NII-Electronic Library Service
102
The
Japanese
Journal
of PsychonomicScience
VoL
28,
No.
1
A=caeE[.g=oa9eeocre.aE=Jmc=ovreEcreeE O,3O,2o,ae,e-O,1-e,2-O.3 o .. MM
ma
$
ts
ts
60 30 O.3e,2o]o,e-e,t-O,2-O.3 o .. BBee
ee
as
ma
A c co ¢ DE E
2
--3o
g
:-; cr ) ¢-so
3!.-60 = m
1
oL3e
.o-.
r. L m.zo
rs-di
or-30-6e
SBC3 SBCI Gi3 Gerl W4 W2 T
Stimulus
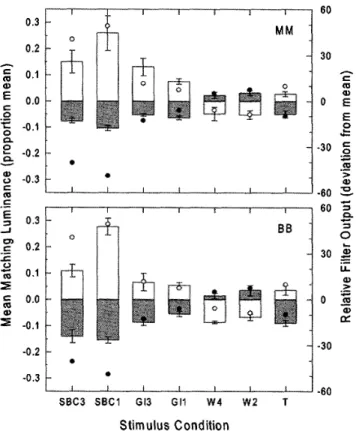
CendMenFigure 4. The bar graph
Cleft
ordinate) plotsthe
deviatien
of mean rnatchingluminance
from
the mcanluminance
(as
a proportion of mean luminance)for
various brightness stimulus conditions, The errorbars
are95%
confidence limits.Data from two subjects appear in the upper and lower panels.
Condition
SBC3
refers tobrightness
matches obtainedin
simultaneousbrightness
contrast conditions[Figure
la] where testpatch height and width werc 30;conditionSBCI
refers tole
testpatches, Thebars extending above the mean represent brightness matches fer test
patches
on the dark background(whtch
appearbrighter
than the rnean), while the bars extending below the mean represent the testpatch rnatehes on the bright background
(which
appear darker thanthe
mean).Next
are matchesfor
two GI displays:a O.03125 cfd sine wave
inducing
grating with a testfield
height of3"
(GI3L
and aO.l25 c/d sinewave
inducing
grating wlth a testfield
height of 10{GII).
The conditions labeled W4and
W8
plot the magnitude of theWhite
effectfor
a O,25 cfd and a O.5 cfd square waveinducing
grating,respective]y. For the O.25 cfd inducing grating,testpatch width was
2a
and testpatchheight
was 40, For the O,5 c7d inducing grating,test patch width was10
and testpatchheight
was20.
Note
that for these two conditions the
bars
extending above the linerepresent matches to test patches
located
on thedark
bars
of theinducing
grating while those below the lineare matchesto
the
test
patches
located on the bright bars of the inducing grating. The finalcondition,{T),
plots themagnitude of brightness induction inthe
Todorovic
stimulus[Figure
2(b)].
The
bar
extending above
the
meanlurninance
represents the match tothe testpatch on thedarkinducing
background with theoverlapping white squares. The bar extending be]ow the mean isthe match
to
the
test
patch onthe
white background with the overlapping black squares. Inducing patterns of 100% contrast were used
in
allbrightness
displays.
The
symbols are read against the Tight ordinate andi represent the ODOGrnodel outputs tothe test
fielcls
in
each stimulus condition, Thefi11ed
symbols are the predictions forthe matches that appear as dark bars and the open symbols are the predictions forthe matches that
appear as white
bars.
The
ODOG
model output and the ernpiricalbrightness
matching data are clearlysimilar across a wide variety of brightness phenomena. After Blakes}ee and McCourt
(1999}.
these brightness effects as measured psychophysi-cal]y using brightness matching
[Fig.41.
This mechanistic explanationdoes
not necessarily confiictwith T-junction or grouping ana]y・ses,
but
may, at]eastto some extent, serve as a mcchanism for
both.
Indeed, tQ the extent that
junctions
infiuence"higher-]evel"
grouping, and to theextent that filters
of the
ODOG
rnode] capture the eperations ofiunc-tions and grouping, one might expect all these ap-proaches to yteld similar results
(Todorovic,
1997;The Japanese Psychonomic Society
NII-Electronic Library Service The JapanesePsychonomic Society
M. E.
McCouRT
andB.
BLAKEsLEE:
Neural
coding of perceived luminance 103A
stdi:s2.2
gee-,g.=:v==m--)
ep =S 32302S2624222018 il・l-I . t'TTTT"'."
,
. ri44140 1136-a. oa32 tst28 :-ord24.)m
G120 i or116aa2 o 3e 6e ge no ase lseDifference
in
Phase
BetweenTestPatchanci BlackBar
(degrees)
Figure 5,
Judged
lightness(fi11ed
symbols,left
ordinate), replotted from
White
andWhite
(1985},
as a function of test patch spatialphase.
Open
symbols ploL predicted test patch brightncss fromODOG
model outputaveraged across
the
width of thetest
patch
(right
ordinate).ODOG
model outputly predicts the linearphase-brightness
tionship reported by White and White
(1985>.
After Blakeslee and McCourt
(1999).
Blakeslee
&
McCourt,
1999).
The
ODOG
rnodel hasthe advantage,
however,
in
thatit
makesquantita-tive predictions about the relative size of various
brightness effects and provides an explanation
for
alarger variety of brightness effects. For example,
SBC
andGI
do
not containT-junctions
orX-junctions
and cannot be addressedby
ajunction
analysis
(B]akeslee
& McCourt, 1999). There isalsono explanation for
GI
based
on eitherGestalt
group-ing or
GilchrisVs
anchoringhypothesis
(Gilchrist
etal.,
1999).
In
addition,Blakeslee
andMcCourt
(1999)
showed that the
ODOG
model accounts for thesmooth transition in mean brightness seen in the
White
effect[Fig.
5]
when the relative phase of thetest patch isvaried relative tothe inducing grating
(White
&
White, 1985}[Fig.
6(a-D].
This smoothtransitLon
is
not readily exp]ai,nedby
aT-junction
orgrouping analysis, Fi,nally,point-by-point
bright-ness matching revealed brightness variations across
the test patches of White stimuli
[Fig.6(g-1)]
(Blakeslee
& McCourt, 1999),as we]1 as GI and SBCstirnuli
(Blakeslee
&
McCourt,
1997>
that
accord withODOG
model predictions.Only
spatialfiltering
can easily accountfor
these types ofbrjghtness
gradi-ents.
Conclusions
andlileiture
Directions
It
is
clear that theODOG
model can account foralarge
number of diversebrightness
effects thathave
previously been explained by a Nny'idevariety of
djffe-rent proposed
brightness
mechanisms,These
expla-nations include low-level iiltering,fi11-in,
edgeinte-gration and
junction
ana]ysis, as well as higher-level mechanismsinvolving
perceptualinferences
aboutdepth and/or transparency, and explanations
in
which the
key
factor
is
visual groupingbased
onsuch concepts as the Gestalt principleof "belonging-ness.'' The fact that all of the induced brightness
effects reviewed here can
be
parsimoniously ac-countedfor
by
theODOG
model suggeststhat
theseparticulareffects
prtmarily
reflect the operations ofearly-stage cortical filtering,and that explanations
in
terms of '`higher-level"
grouping mechanisrns are not
required.
There may, however, be other situations where
higher-order effects on
brightncss
do
occur.For
example, several clajms have
been
made(including
our own>
for
an effect oftransparency on perceived brightness(Adelson,
1993; Anderson, 1997;King-dom,
Blakeslee,
&
McCourt,
1997).
In
theinterests
ofparsirnony,however, careful stud}, isrequired to
de-termine thecircumstanees under which higher-order
factors,
such as transparency, exert a uniqzaeinflu-ence on brightness,and todetermine the magnjtudes
of these
higher-order
effect$.For
example,in
acare-fully
controlled study,Kingdom
et al,(1997)
demon-strated a small effect of perceived transparency on
the brightness of the testpatch in a
SBC
stimulus.Multiplicative transparency affected brightness in
such a way that subjects perceived the testpatch te be brighter than inother configuratton conditions.
Somewhat
surprisingly, thisis
consistent with anexplanation whereby the transparency was partially
discounted Erom the brightness of the test patch.
Carefu]ly
sorting out those brightness effects thatare and are not accounted forby low-level mecha-nisms, as well as rneasuring their relative
magni-tudes, will provide needed
direction,
precision andinsight into the
investjgation
of brightnessNII-Electronic Library Service
104
The
Japanese
Journal
of Psychonomic Science Vol.28,No. 1256 a92 128 64 o256 t92 12B 64 e256 t92 t28 64 o
rl
{d)
aili・mu
O.7 O.5-E=E'Rtu e.3E=.9= O,70ocrEee2 O,5ow.EE="a) e,3eec=stu e,7o==cu ¢ =MM
i i(g).t.7rpm.tt..t...t...t.
BB
c a-.-
..--J
-=CL-JoL
¢ sttam>=cuInt iiilI{lligi
fiIiilllIIIll
i{e)Ii';
.l'
g}
{k)
ri60 "28 ge{
(h)
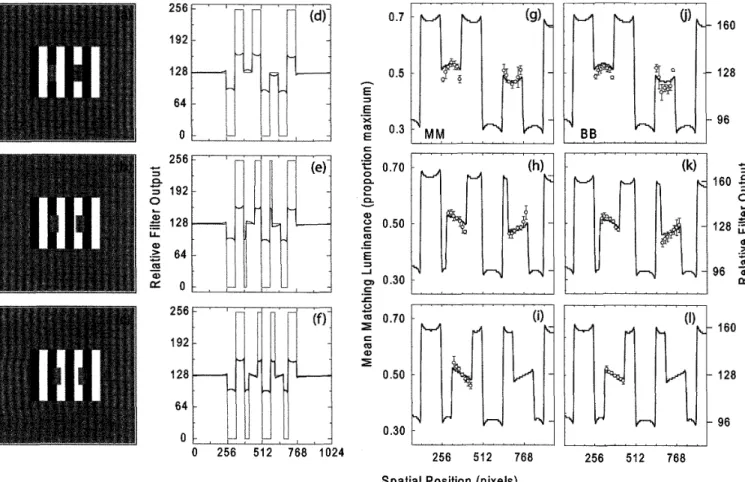
Figure 6.
(a-c)
Theto the inducing relationship with
testpatches
have
been
sby half
[Fig.
5], eliminating the effect,
displays
takenlinesrepresent views of the ODOG
matches
{with
symbols, as read
output closely
After Blakeslee and McCeurt
(1999).
e,50
l
'
(l]
O,30 o 2s6 512 768 1024 2s6 St2 76B Spatia[PesitEen{pixel$}White stimulus Mustrating
the
effect of shiftingthe
phgrating.
(a)
In the standard configuration the gray Lheblack
bar,and a 180fiphase re]ationship with the
hifted
tothe rightby
450 phase angle; thisThe test patches in panel
(c>
have been shitted by 900
(d-f)
The lightgray linesdepict
the veri'
along ahorizontal
line
through the vertical center of thecorresponding slices taken through the
ODOG
modelrnodel output
(solid
lines)illustratedin panels<d-f),
an95%
confidenceintervals)
obtained at seven locatiens acrossagainst
left
ordinate).parallelsthe observed brightness variations across the test
(l}
2565t2T6Bs16o
-a8
:.t28
.l
-e96-e
at ri60 n2s 96ase of
'the
testpatch relativetest patch
is
in
a OO phasewhite bar, In panel
(b)
bothreduces the magnitude oi the effect
phase angle, completoly
dical
luminance
profiles
of the stimulustest
field
anddisp]ay.
Solid
filteroutput,
<g-l)
Magnified
d point-by-point
brightness
each 20 testpatch(open
Data
from
two subjects(MM
andBB)
are shown,ODOG
modelpatches in
these
stimuli.
Acknowledgement
This work was supported by grants frornthe
Na-tienaLScience Foundation
{NSF:
IBN-0212789), theNational
Eye InstLtute(NEI:
ROI EYO14015) and theNationaL
Center forResearch
Resources(NCRR:
P20
RR020151>.
NEI
andNCRR
are components of theNational
Institutes
ofHealth
(NIH).
The
contents ofthisreport are solely the responsibllity of thc authors and do not necessarily reflect the oMcial views of the
NIH or NSF.
References
Adelson,
E.H,
(1993).
Perceptual
organization andthe
judgrnent
ofbrightness
Science,
262,
2044.
Adelson,
E,H.
(2000).
Lightness
perception andness
illusions.
In
Gazzaniga
M.
(Ed.).
The
IVbw
Cog-nitive Neurosciences,
2"d
ed,Cambridge,
MA: MIT Press.Agostini,
T.
&
Profftt,D.
R.
(1993).
Perceptualganization evokes simultaneous
lightness
contrast.Perception,
22,
263L272.
Anderson,
B.
C1997).
A
theory ofjl]usory
lightness
and transparency in monocular and binocular
The Japanese Psychonomic Society
NII-Electronic Library Service The JapanesePsychonomic Society
M.
E.
McCouRT
andB.BLAKEsLEE:
Neural
codlng ofperceived
luminance
105
ages:
The
role of contourjunctions.
Pigrception,26,
419-453.
Arend, L.E.
(].993).
Mesopic lightness, brightness,and brightness contrast,
Perception
andPsycho-physics,
54(4),
469-476.Arend, L,E,,Buehler,
J.
N.&
Lockhead, G,R,(1971)
Difference information in brightness perception.
Percoption
and 1?sychophysics.9,
367-37e,
Blakeslee,B.,&
McCourt,
M.
E.
(1997).
Simi]ar
mecha-nisms underlie sirnultaneous brtghtness contrastand grating
induction.
Vision
Research,
37,
2849-'
2869.
BlakesLee,
B.
&
]vlcCourt,
M.
E.
{1999).
A
multiscale spatialfiltering
account of theWhite
effect,simul-taneous brightness contrast and grating induction.
VisionResearch, 39,4361-4377.
'
Blakeslee,
B.
&
McCourt,
M,
E,
(2001).
A
multiscalespatial
filtering
account of theWertheimer-Benaryeffect and the corrugated Mondrtan. Vision
Re-search,
41,
2487-2502,
B]akeslee,B. & McCourt, M, E.
(2003).
A multiscalespatial filteringaccount of brightness phenomena.
In:
Harris,
L.,
&
Jenkin,
M,
(Eds.),
Levels
of
tion,Springer,
NY,
New
York.
Blakeslee,
B,,
&
McCourt,
M.
E.
{2004).
A
unifiedory of
brightness
contrast and assimilationporating oriented multiscale spatial fi]teringand
contrast normalization. VisionResearch, 44, 2503.
Blakeslee, B.
&
McCourt,
M.E,(2005>.
A multisca]espatial
filterjng
account ef gratinginduction
andremote brightness induction effects: Reply to
vinenko.
fercoption,
34, 793-802.Blakeslee,B.
&
McCourt,
M.
E.
(2008),
Nearly taneous brightnessinduction.
foumal
of
Wsion,
8
(2):
15,
1-8,
http://journatofvision.org18/2115L
doi:10.1167f8.2.15.
Blakeslee,B. Pasieka, SNF.,& ],CcCourt,rv[.E.
{2005).
Oriented
multiscale spatiaLfilterlng
and contrastnormalization:
A
parsimonious model ofness induction ina continuum of stimuli including
White, Howe and simultaneous brightness
trast.
Vision
Research,
45,
607-615.
Btakeslee,
B.
Reetz,
D.,
&
McCourt,
M.
E.
(2008).
ingtoterrnswith ]ightnessand brightness:Effects of stimu]us configuration and instructions on
ghtness and lightness
judgments.
lbormal
of
Vision,8(11):3,1-14, http://journa]ofvision.orgf8/1113f,
dei:10.ll6718.11.3.
Blakes]ee,B.,Reetz,D.,
&
McCourt,M.
E.
(2009},
tialfilteringversus anchoring accounts of
ness/Iightness perception instaircase and
neous
brightnessllightness
contrast stimuli.Ibur
nat
of
Esion, 9(3):22,1-17.http:/fjournalofvision.org!9/3122Ldoi:10.1167/9.3.22.
CIE
(1970).
international
Lighting
Vocabulary.
3i`Ed,Publ.
No. 17,(El,O.
Paris:
Bureau
Central
de
la
CIE,
Cornsweet,
T.N.
&
Teller.
D.
(1965).
Relation
ofin-crement threshelds to brightness and luminance.
foumaat
of
theQPtical
Society
of
America,
55(10),
1303-1308.
DeValois, RL.
&
DeValois,
K.K.
(1988}.
Spat'ial
Iiision.New York:Oxford
University Press.DeValois,
R,
L.
&
Pease,
P.
L.
(1971).
Contours
andcontrast:
Responses
of monkeylateral
geniculate cells toluminance and color figures,Science,171,
694-696.
Fiorentini,
A.
Baumgartner,G.
Magnussen,
S.
Schil-ler,P.H.
&
Thornas,J.
P,(1990).
The perception of
brightness
anddarkness:
Re}ations teneuronalceptive
fields.
InSpillman,L,,
&
Werner,J,
S,
(Eds.),
Visual PleTception:The IVeuroPhysiolQgical
tions,
San
Diego:
Acadernic
Press,Foley,
JM.
&
McCourt,
M. E.(1985}.
Visual
gratinginduction.
Iburnal
of
theQptical
Societyof
AmericaA,2, 1220-1230.
Geisler.
W.
S.
&
Albrecht,
D.
G.
(1995).
Bayesian
lysisof identification
performance
inmonkey ual cortex: Nonlinear mechanisms and stimuluscertainty.
Vision
Research,
35,
2723-2730.
Georgeson,
M.A. &Sul]ivan,
G.
D.(1975)
Contrast
eonstancy: Deb]urring inhuman vision by spatial
frequency
channels.foumal
of
RhJ,siology
(Lond.),
252,
627-656.
Gilbert,C,D,,Das, A. ILo,M.,Kapadia, M. &
theimer,
G.
(1996).
Spattal integrationand cortical
dynamics.
I]roceedings
of
theAdetional
Academy
of
Sciences,
[ISA,
93,
615-622,
Gilchrist,A.,Kessyfidis, C.,Bonato, F.,Agestini,T.
Cataliottj,
J.,
Lj,
X.,
Spehar,
B.,Annan,
V.
&
mou,E.
(1999).
An
anchoring theory oflightness
perceptien.
RsychologicaJReview, 106, 795-834.Grossberg,
S.,
&
Mingolla,
E.
(1987).
Neural
dynarnics
of surface perception: Boundary webs, illuminants,
and shape-from-shading.
Computer
Vlsion,
ics,and image Precessing,37,116-165,
Grossberg,
S.,
&
Todorovic, D.(1988}.
Neuralics
of 1-D and 2-D brightness perception:A unifiedrnodel of classical and recent phenomena.
tionand RsychoPdysics,43,241-277,
Hejnemann, E.G.
(1955),
Simu]taneeus brightness
duction
as a function ofinducing
and test-fie]dluminances,
fou"ial
of
ExPerimental Flsychology,50,89-96,
Heinemann, E.
G.
{1972).
Sirnultaneousbrightness
duction.
In
Jameso,
D,
andHurvic,
L.
M,
{Eds.),
dbooh
of
Sensoew
Physiology,
V[IL4
Wszaal
phJ,sics.
Springer-Ver]ag
(Berlin).
Helson.
H.
(1963}.
Studies
of anomalous contrast andassimilation.
Iburnal
of
theQPtical
SocietyqfAmeFica,53,179-I84・.
Kingdom, F.A.A. & Moulden, B.
(1988).
BorderNII-Electronic Library Service
106
The
Japanese
Journal
of Psychonomte Science Vol.28, No. 1fects
onbrightness:
A review of findings,modelsand issues.Spatial Vision,3(4),225-262.
Kingdom, F.
A.
A.
(1997).
Simultaneous
contrast:The
legacies
ofHering
andHelmholtz.
.Percoption,
26,
673-677.
Kingdorn, F.A. A.,Blakeslee, B.
&
McCourt,
ME.
(1997).
Brightness
with and without perceivedtransparency:
When
docsit
make a difference?fercePtion,26,
493-506.
Lamme,
V.
A,
F.,
&
Roe]fsema,
P.R.
(2000).
Thc
tinctmodes of vision offered by fecdforward and
recurrent processing. Trends
in
IV2uroscience,23,11,571-579.
Land, E.H. & McCann,
J.
J.
(197
1
).
The
rctinex theoryof vision
foumal
of
lheQPtical
Sociely
ofAmerica,
61, 1-11.
Lennie, P. & D'Zmura, M.
0988).
Mechanisms ofcolor vision.
CRC
Criticat
Reviews
in
Neurobiology,
3(4),
333-400.
McCourt, M. E.
(1982).
A spatial frequency dependentgrating-induction effect.
Vision
Research,
22,
134.McCourt,
M E,
(1994),
(}ratinginduction:A newplanation for statienary visual phantoms. Vision
Research, 34, 1609-1618,
Mou]den,
B.
&
Kingdom,
F.A,A.
(1989),
White's
effect:
A
dual
mechanism,Vision
Research,
29,
1245-1259.Moulden, B. & Kingdom,
F.AA,
(l991).
Thelocal
border
mechanismin
gratinginduction.
Vision
search,
31,
1999-2008.Paradiso,M.A,,& Hahn, S,
(1996).
Filling-inpercept$produced by
]uminancc
moclulation. Visionsearch,
36,
2657'2663.
Paradiso, M. A.,& Nakayama. K.
Q991).
Brightnessperception and
filling-in,
VisionResearch,31.
1236.
Pessoa,
L.,
Mingolla,
E.
&
Neumann,
H.
(1995).
A
contrast- and luminance-driven mu]tjseale
work model of
brightness
perception. Visionsearch, 35,2201'2223.
Pokorny,
J.,
SheveLl,
S.K.,&
Smith,V.
C.(1991).
our appearance and colour constancy. In
Gouras,
P.
(Ed.),
Vision
andVisual
Llyshinction
(Vol.
6,
The
Perception
ofCo]or,
pp.43-61),
Boca
Raton, FL:CRC Press.
Reid,
C,
R.
&
Shapley,
R.
C1988),
Brightness
induction
by localcontrast and the spatial dependence of
assimi]ation. VisionResearch, 28{1),115-132.
Ross, W. D.,& Pessoa, L.
(2000).
Lightness irorntrast:A selective integration model. Rgrceptionand
RsJ)choph)'sics,62(6),1160-1181.
Rossi,A.
F.
&
Paradiso,M. A.(1996).
Temporal limits of brightness induction and mechanisms ofness perception. VisionResearch, 36, 1391-1398.
RossL
A.
F.
&
Paradiso,
M.
A.
(1999),
Neural
corre-lates
of perceivedbrightness
in
the retina,lateral
geniculate nucleus, and striate cortex.
fournal
of
Arleuroscience,
19,6145-6156,Rossi,
A.F.
Rittenhouse,
C.D.
&
Paradiso,
M.A.
C1996}.
The
representation otbrightness
inpri-mary visual cortex. Science,273, l104-1107.
Shapley,
R.
& Enroth-Cuge]],C,
<1984).
Vi$ual
adap-tation
and retinal gain-controls.thogress
in
Retinal
Research,
3,
263--346.
Shapley, R.& Reid,R.C.
(1985).
Contrast andassimi-lationinthe pcrception of
brightness.
Proceedingsof
theIVationalAcademy
of
Science
USA,
82,
5983L
5986.
Smith,
V,C.
Jin,
P.Q.
&
Po]<orny,J.
(2001).
The role of spatial frequency incolor induction.Vision
Re-search, 4L IO07-1021.
Spehar,
B.Gi]chrjst,
A,
L. & Arend, L.E.(1995).
Thecritical role of relative luminance relations in
tc'seffect and grating
induction.
Vision
Research,
35,
2603-・2614.
Taya, R.,Ehrcnstein, W.,& Cavonius, C,
<1995).
ing the strength of the Munker-White effect by
stereoscopic vievtTing. Percoption,24,
685-694.
Todorovic, D.
{1
997).
Lightness andjunctions,
tion,
26,
379--39s.
White,
M.&
White, T.(1985>.
Counterphase lightncssinduction. vasionResearch, 25, 1331.-1335,
Whil/e,
M.
<1979).
A
new effect oC pattern onceived
]ightness.
Perception,
8,
413-416.
Whitc, M.
(198".
The cffect of the nature of thesurround on the perceived lightness of grey bars
within square-wave test gratings.
I'ercoption,
10,
215-230.
WyszeckL
G.
Cl986).
Color
appearance, InBoff,K.R.Kaufman L.,
&
ThDmas,
J.B.
(Eds.),
Hdndbooh
of
Percoption
andHuman
Rei:formance
(Vol.
1,
Sensory
Processcs
andPerception},
John
Wiley
andSons
(New
York).Wyszecki,
G.,
&
Stiles,
W.S.{1982).
Color Science:Concepts and Mbthods.
Quantitative
Data andmulae
(pp.
487),John
Wilcy&
Sons,New
York.Yund,
E.W.,&
Armington.J.C.
(1975).
Color and
brightness
contrast effects as afunctien
of spatialvariables. Iijsion
Research,
15,
917-929.Yund, E,W.
Snodder]y,
D.M., ll'epler,N,K.,
&
Valois,
R.
L.
(1977).
Brightness
contrast effectsin
rnonkey
lateral
gcniculate nucleus. Sensompiesses, 1,260-271.
Zaidi,
Q.
(1989).
LocaL and distalfactors
in
visualgrating induction.
Vision
Research,29,691-697.
Zaidi,
Q.,
Spehar,B. &Shy,
M.(1997).
Induced effectsof background and
foregrounds
in
sienal configurations: The role of T-junctions.
caption, 26,395-408.