ZnCl
2and vitamin C, known as antioxidants, differently potentiate the
cytotoxicity of H
2O
2in rat thymocytes: Cytometric analysis using forward
and side scatters
Takuya Kawanai*, Soya Harada*, Chiharu Kubota*, Erika Hashimoto, Yasuo Oyama
Laboratory of Cellular Signaling, Faculty of Integrated Arts and Sciences, The University of Tokushima, Tokushima 770-8502, Japan
Corresponding author: Yasuo OYAMA (E-mail: oyama@ias.tokushima-u.ac.jp)
* Member of ‘2009 Journal Club for Undergraduate Studies’
Abstract
The ‘antioxidant hypothesis’ proposes that antioxidant nutrients afford protection against chronic diseases by decreasing oxidative damages. The ability of zinc to retard oxidative processes has been recognized for many years. However, the application of ZnCl2 potentiates the cytotoxicity of H2O2. Thus, some antioxidants may be cytotoxic under certain oxidative conditions. Therefore, in this study, the effect of vitamin C, one of antioxidant nutrients, on the cells treated with H2O2 has been examined to see if vitamin C potentiates the cytotoxicity of H2O2. Experiments were carried out with flow cytometer and rat thymocytes. Vitamin C also potentiated the cytotoxicity of H2O2. The increase in cell lethality induced by the combination of H2O2 and ZnCl2 was associated with the increase in population of shrunken cells with increased intensity of side scatter. However, it was not the case for the combination of H2O2 and vitamin C. The profile of cytotoxicity induced by H2O2 and vitamin C was different from that by H2O2 and ZnCl2. It may be suggested that the effects of zinc and vitamin C varies from cytoprotective to cytotoxic, being dependent on the type of oxidative stress.
Keywords: Zinc; Vitamin C; Hydrogen peroxide; Cytotoxicity.
1. Introduction
Zinc and vitamin C supplements are available for common people to promote and/or maintain good health conditions (Prasad, 2008; Mandl et al., 2009; Maggini et al., 2010). However, ZnCl2 potentiates the cytotoxicity of H2O2 in rat thymocytes (Matsui et al., 2009) by inducing excessive increase in intracellular Zn2+ concentration (Matsui et al., 2010). Thus, although the ability of zinc to retard oxidative processes has been recognized for many years, zinc is cytotoxic under certain oxidative stress. Vitamin C is also known as an anti-oxidant and it protects the body against oxidative stress (Padayatty et al., 2003). However, hydroxyl radical, a potent oxidative radical, is generated by vitamin C and H2O2, being independent of mediation by transition metals (Smirnoff and Cumbes, 1989; Nappi and Vass, 2000). Therefore, the combination of vitamin C and H2O2 may induce cytotoxic action. In this study, the effects of ZnCl2 and vitamin C on the cytotoxicity of H2O2 were studied to see if vitamin C potentiates the
cytotoxicity of H2O2 and to compare the actions of ZnCl2 and vitamin C on H2O2 cytotoxicity.
The ‘antioxidant hypothesis’ proposes that antioxidant nutrients afford protection against chronic diseases by decreasing oxidative damages. However, randomized primary and secondary intervention trials failed to show any consistent benefit from the use of antioxidant supplements on cardiovascular diseases or cancer risk, with some trials even suggesting possible harm in certain subgroups (Stanner et al., 2004). Since both zinc and vitamin C are recognized to be against oxidative stress, this study may give an insight to elucidate the cytotoxic action of ‘antioxidants’ under certain oxidative condition.
2. Materials and methods
2.1. Chemicals
H2O2 was purchased from Sumitomo Chemical Co. (Osaka, Japan). Propidium iodide was obtained from Molecular Probes Inc. (Eugene, Oregon, USA).
Takuya Kawanai • Soya Harada • Chiharu Kubota • Erika Hashimoto • Yasuo Oyama
Other chemicals (NaCl, CaCl2, MgCl2, KCl, glucose, HEPES, NaOH, and ZnCl2) were supplied from Woko Pure Chemicals (Osaka, Japan).
2.2. Animals and cell preparation
This study was approved by the Committee for Animal Experiments in the University of Tokushima (No. 05279). The procedure to prepare cell suspension was similar to that previously reported (Chikahisa and Oyama, 1992; Chikahisa et al., 1996). In brief, thymus glands dissected from Wistar rats under ether anesthesia were sliced at a thickness of 400-500 µm with razor under chilled condition (3-4ºC). Thereafter, the slices were triturated by gently shaking in chilled Tyrode's solution (in mM: NaCl 150, KCl 5, CaCl2 2, MgCl2 1, glucose 5, HEPES 5, with an appropriate amount of NaOH to adjust pH to 7.3-7.4) to dissociate thymocytes. Then, the Tyrode's solution containing the cells was passed through a mesh (a diameter of 53 µm) to prepare cell suspension. The beaker containing the cell suspension was bathed at 36-37ºC for 1 hr before the experiment.
Rat thymocytes were used for present study because of following reasons. First, the cell membranes of thymocytes remain intact because single cells can be prepared without enzymatic treatment. Second, the process of cell death is extensively studied in murine thymocytes (McConkey et al., 1994; Quaglino and Ronchetti, 2001; Ortiz et al., 2001; Thompson et al., 2003).
2.3. Fluorescence measurements of cellular parameters
The methods for measurements of cellular parameters using a flow cytometer (CytoACE-150, JASCO, Tokyo, Japan) and propidium iodide were similar to those previously described (Chikahisa and Oyama, 1992; Chikahisa et al., 1996; Matsui et al., 2008). The fluorescence was analyzed by JASCO software (Ver.3XX, JASCO). There was no fluorescence from reagents used in this study, except for fluorescent probes, under our experimental condition. The cytogram (forward scatter versus side scatter) was constructed from 2 × 10³ cells. Forward scatter is a parameter for cell size while side scatter represents intracellular density.
To assess cell lethality, propidium iodide was added to cell suspension to achieve a final concentration of 5 µM. Since propidium stains dead cells and the cells having compromised membranes, the measurement of propidium fluorescence from cells provides a clue to estimate the cell lethality. The fluorescence was measured at 2 min after the application of propidium iodide by a flow cytometer. Excitation wavelength for propidium was 488 nm and emission was detected at 600 ± 20 nm.
2.4. Experimental protocol
H2O2 (2 µl) was added to the cell suspension (2 ml). The cell density was about 5 × 10⁵ cells/ml. To examine the effects of ZnCl2 and vitamin C, the agents were respectively added to the suspension just after applying H2O2. The cells were incubated with respective agent and H2O2 at 36-37°C under room air condition. The data acquisition of propidium fluorescence from 2 × 10³ cells by a flow cytometer required 10 sec at least.
Effect of H2O2 at concentration of 1, 3 and 10 mM on thymocytes was examined in preliminary study. Thymocytes were tolerant to oxidative stress induced by 1 mM H2O2 during a period of 3 hr after adding H2O2 into cell suspension. It was likely that H2O2 at 3-10 mM was lethal for thymocytes during exposure lasting for 2 hr or longer because the prolonged exposure of thymocytes to 3-10 mM H2O2 produced a time dependent increase in the population of cells stained with propidium, indicating a time-dependent increase in cell lethality. The time dependent change in population of cells exerting propidium fluorescence by 10 mM H2O2 was more rapid than that by 3 mM H2O2. The incubation with 3 mM H2O2 for 2 hr induces only small increase (less than 10%) in cell lethality that was suitable to study the actions of ZnCl2 and vitamin C on H2O2-induced cytotoxicity.
2.5. Statistics
Values were expressed as mean ± standard deviation of 4 experiments. Statistical analysis on significance was performed with Tukey multivariate method. A P value of < 0.05 was considered significant. However, small difference (5 % or less of the control) was not applicable for statistical analysis because the control values varied within ± 2.5 % in some cases.
3. Results
3.1. Changes in cell lethality by ZnCl2, vitamin C,
H2O2, and their combinations
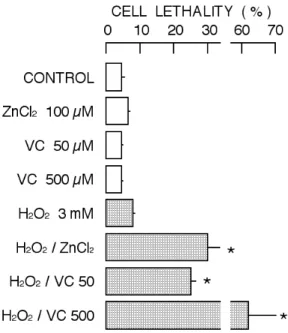
The cells were respectively incubated with 100 µM ZnCl2, 50 µM and 500 µM vitamin C, 3 mM H2O2, and the combinations with H2O2 for 2 hr. As shown in Fig. 1, the population of cells stained with propidium (dead cells and/or the cells having compromised membranes) in the presence of ZnCl2, vitamin C, and H2O2 alone was similar to the control. The incubation of cells with the combination of H2O2 with ZnCl2 or vitamin C increased the population of cells stained with propidium. The results were summarized in Fig. 2. The lethality of cells incubated with the combination of H2O2 with ZnCl2 or vitamin C was significantly higher than those of control cells and the cells respectively incubated with ZnCl2, vitamin C, and H2O2.
Figure 1. Population of dead cells and/or the cells having compromised membranes accessed with cell stainability with
propidium iodide. Histogram of intensity of propidium fluorescence was constructed with 2000 cells after 2 hr incubation with ZnCl2, vitamin C, H2O2, or their combinations (H2O2 and ZnCl2, H2O2 and vitamin C). Dotted line indicates the population of cells exerting propidium fluorescence in the histogram.
Figure 2. Change in cell lethality accessed with cell
stainability with propidium iodide. In this study, the cell lethality was percentage population of cells stained with propidium. Column and bar indicate mean and standard deviation of four experiments. Symbol (*) show significant difference (P<0.05) between control cell group and the group of cells treated with ZnCl2, vitamin C, H2O2, or their combination.
3.2. Changes in cell populations by ZnCl2, vitamin C,
H2O2, and their combinations
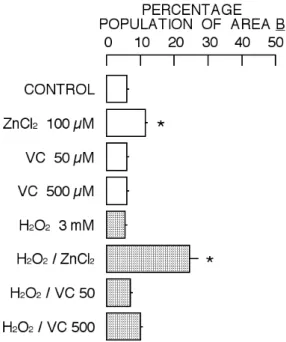
There was one population in the cytogram (forward scatter versus side scatter) under control condition (Area A of Fig. 3). However, the incubation of rat thymocytes with cytotoxic substances usually increases the population of cells with decreased intensity of forward scatter and increased intensity of side scatter (Area B of Fig. 3), resulting in two distinctive populations in the cytogram (Nakao et al., 2003; Iwase et al., 2004; Yamaguchi et al., 2005; Chikutei et al., 2006; Horimoto et al., 2006: Nishimura et al., 2006, 2008; Oyama et al., 2007; Fujimoto et al., 2009; Kinazaki et al., 2009; Sakanashi et al., 2009; Ogata et al., 2010). The increase in cell lethality induced by cytotoxic substances is usually associated with the increase in the population of shrunken cells, the cells with decreased intensity of forward scatter and increased intensity of side scatter, as shown in the cytogram obtained from the cells simultaneously incubated with 100 µM ZnCl2 and 3 mM H2O2 (Figs. 3 and 4). However, it was not the case for the cytogram in the combination of H2O2 with vitamin C (Figs. 2, 3, and 4). Thus, the combination of 3 mM H2O2 with 50 µM or 500 µM vitamin C increased the lethality without significant increase in the population of cells belonging to Area B.
Takuya Kawanai • Soya Harada • Chiharu Kubota • Erika Hashimoto • Yasuo Oyama
Figure 3. Cytogram (forward scatter versus side scatter) of cells incubated with ZnCl2, vitamin C, H2O2, or their combination for 2 hr. Cytogram was constructed with 2000 cells. Cytogram was tentatively divided to two areas, A and B, by the eye-drawn line that was based on forward and side scatters. The circle in Area B was drawn to emphasize the cell population that appeared in the case of the combination of H2O2 and ZnCl2.
Figure 4. Change in percentage population in Area B by
2 hr incubation with ZnCl2, vitamin C, H2O2, or their combination. Column and bar indicate mean and standard deviation of four experiments. Symbol (*) show significant difference (P<0.05) between control cell group and the group of cells treated with ZnCl2, vitamin C, H2O2, or their combination.
3.3. Changes in forward and side scatters by ZnCl2,
vitamin C, H2O2, and their combinations
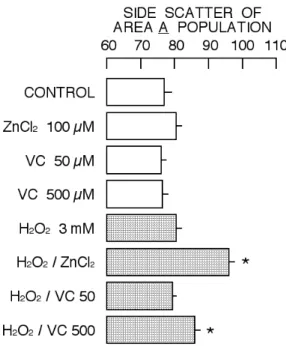
The profile of cytotoxicity induced by the combination of 3 mM H2O2 with 50 µM or 500 µM vitamin C seems to be against the cytometric concept described above and previously (Nakao et al., 2003; Iwase et al., 2004; Yamaguchi et al., 2005; Chikutei et al., 2006; Horimoto et al., 2006: Nishimura et al., 2006, 2008; Oyama et al., 2007; Fujimoto et al., 2009; Kinazaki et al., 2009; Sakanashi et al., 2009; Ogata et al., 2010). Therefore, the change in profile of cell population belonging to Area A of cytogram was further analyzed. As shown in Fig. 5, the simultaneous incubation of H2O2 and ZnCl2 induced significant decrease in cell population of Area A while it was not the case for others. The intensity of forward scatter was significantly decreased by the respective combination of 3 mM H2O2 with 100 µM ZnCl2, 50 µM vitamin C, or 500 µM vitamin C (Fig. 6). The decrease in forward scatter intensity by the combination of H2O2 and vitamin C was more than that by the combination of H2O2 and ZnCl2. The intensity of side scatter was significantly increased by the combination of 3 mM H2O2 with 100 µM ZnCl2 or 500 µM vitamin C (Fig. 7). The increase in side scatter intensity by the combination of H2O2 and vitamin C was less than that by the combination of H2O2 and ZnCl2. The profile of cytogram of cells simultaneously incubated with H2O2 and ZnCl2 was different from that with H2O2 and vitamin C.
Figure 5. Change in percentage population in Area A by
2 hr incubation with ZnCl2, vitamin C, H2O2, or their combination. Column and bar indicate mean and standard deviation of four experiments. Symbol (*) show significant difference (P<0.05) between control cell group and the group of cells treated with ZnCl2, vitamin C, H2O2, or their combination.
Figure 6. Change in forward scatter, a parameter for
cells size, of cells belonging to Area A by 2 hr incubation with ZnCl2, vitamin C, H2O2, or their combination. Decrease in forward scatter indicates shrinkage. Symbol (*) show significant difference (P<0.05) between control cell group and the group of cells treated with ZnCl2, vitamin C, H2O2, or their combination.
Figure 7. Change in side scatter, a parameter for
cellular density, of cells belonging to Area A by 2 hr incubation with ZnCl2, vitamin C, H2O2, or their combination. Symbol (*) show significant difference (P<0.05) between control cell group and the group of cells treated with ZnCl2, vitamin C, H2O2, or their combination.
Figure 8. Change in cell lethality in population
belonging to Area A by 2 hr incubation with ZnCl2, vitamin C, H2O2, or their combination. Column and bar indicate mean and standard deviation of four experiments. Symbol (*) show significant difference (P<0.05) between control cell group and the group of cells treated with ZnCl2, vitamin C, H2O2, or their combination.
Takuya Kawanai • Soya Harada • Chiharu Kubota • Erika Hashimoto • Yasuo Oyama
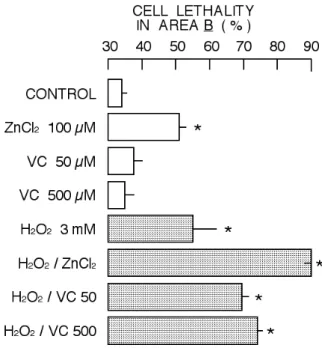
3.4. Changes in cell lethality of populations classified with forward and side scatters
The cell lethality in Area A population is usually much less than that in Area B population as also shown in Figs. 8 and 9. The lethality of control cell population in Area A was 2.6 ± 0.2 % while it was 33.9 ± 2.5 % in Area B. Similar tendency was observed in the cases of 100 µM ZnCl2, 50 µM and 500 µM vitamin C, 3 mM H2O2 (Figs. 8 and 9). The respective combination of H2O2 with ZnCl2 or vitamin C increased the cell lethality in both areas. Though the increase in lethality of Area B population by the combination of H2O2 with ZnCl2 was significantly more than that by the combination of H2O2 with vitamin C, it was opposite in Area A population (Figs. 8 and 9).
Figure 9. Change in cell lethality in population
belonging to Area B by 2 hr incubation with ZnCl2, vitamin C, H2O2, or their combination. Column and bar indicate mean and standard deviation of four experiments. Symbol (*) show significant difference (P<0.05) between control cell group and the group of cells treated with ZnCl2, vitamin C, H2O2, or their combination.
4. Discussion
Both ZnCl2 and vitamin C, known as antioxidants, potentiated the cytotoxicity of H2O2 (Figs. 1 and 2). While the cell lethality induced by ZnCl2, vitamin C, or H2O2 alone was less than 10%, the combination of H2O2 with ZnCl2 or vitamin C increased the lethality to more than 20% (Fig. 2). In the combination of 3 mM H2O2 and 500 µM vitamin C, the cell lethality was more than 60%. The simultaneous application
of ZnCl2 and vitamin C seems to synergistically potentiate the cytotoxicity of H2O2 in rat thymocytes when their incubation time was 2 hr. Therefore, zinc (ZnCl2) and vitamin C may exert cytotoxic action under certain oxidative conditions.
The treatment of cells with cytotoxic substances usually increases the population of cells with decreased intensity of forward scatter and increased intensity of side scatter (Area B of Fig. 3), resulting in two distinctive populations in the cytogram (Nakao et al., 2003; Iwase et al., 2004; Nishimura et al., 2006, 2008; Chikutei et al., 2006; Oyama et al., 2007; Sakanashi et al., 2009; Ogata et al., 2010). Forward scatter is a parameter for cell size while side scatter reflects cellular density. Thus, cytotoxic substances increase the population of shrunken cells with increased cellular density. The cytotoxic profile in the combination of 3 mM H2O2 with 100 µM ZnCl2 supports the ‘concept’ described above (Figs. 3, 4, and 5). However, the profile of cytotoxicity induced by the combination of H2O2 and vitamin C was different from that in the case of H2O2 and ZnCl2. The population of shrunken cells with increased cellular density did not significantly increase in the case of H2O2 and vitamin C (Fig. 5). Thus, the combination of H2O2 and vitamin C increased the cell lethality without significantly affecting cellular density (Fig. 7). The increase in cell lethality of Area A population by the combination of H2O2 and vitamin C was higher than that by the combination of H2O2 and ZnCl2 while it was opposite in Area B (Figs. 8 and 9).
The cell death induced by H2O2 is potentiated by ZnCl2 and suppressed by TPEN, a chelator for intracellular Zn2+ (Matsui et al., 2009). The simultaneous application of H2O2 and ZnCl2 greatly increases intracellular Zn2+ concentration (Matsui et al., 2010). Therefore, the phenomenon via the increase in intracellular Zn2+ concentration is involved. In the case of vitamin C, the cell death may be resulted from its interaction with H2O2 that produces hydroxyl radical in extracellular space (Smirnoff and Cumbes, 1989; Nappi and Vass, 2000). If so in present study, hydroxyl radical would deteriorate cell membrane, resulting in the increase in population of cells stained with propidium iodide. It may be suggested that zinc and vitamin C differently induce cytotoxic action under certain oxidative conditions although these substances are known to possess antioxidant activity.
Acknowledgement
The study was supported by the grant (2009) from the Office of Dean, Faculty of Integrated Arts and Sciences, The University of Tokushima, Tokushima, Japan.
References
Chikahisa, L., Oyama, Y., 1992. Tri-n-butyltin increases intracellular Ca2+ in mouse thymocytes: a flow-cytometric study using fluorescent dyes for membrane potential and intracellular Ca2+. Pharmacol. Toxicol. 71, 190-195.
Chikahisa, L., Oyama, Y., Okazaki, E., Noda, K., 1996. Fluorescent estimation of H2O2-induced changes in cell viability and cellular nonprotein thiol level of dissociated rat thymocytes. Jpn. J. Pharmacol. 71, 299-305.
Chikutei, K., Oyama, T.M., Ishida, S., Okano, Y., Kobayashi, M., Matsui, H., Horimoto, K., Nishimura, Y., Ueno, S.Y., Oyama, Y., 2006. Propofol, an anesthetic possessing neuroprotective action against oxidative stress, promotes the process of cell death induced by H2O2 in rat thymocytes. Eur. J. Pharmacol. 540, 18-23.
Fujimoto, A., Sakanashi, Y., Matsui, H., Oyama, T., Nishimura, Y., Masuda, T., Oyama, Y., 2009. Cytometric analysis of cytotoxicity of polyphenols and related phenolics to rat thymocytes: potent cytotoxicity of resveratrol to normal cells. Basic Clin. Pharmacol. Toxicol. 104, 455-462.
Horimoto, K., Nishimura, Y., Oyama, T.M., Onoda, K., Matsui, H., Oyama, T.B., Kanemaru, K., Masuda, T., Oyama, Y., 2006. Reciprocal effects of glucose on the process of cell death induced by calcium ionophore or H2O2 in rat lymphocytes. Toxicol. 225, 97-108.
Iwase, K., Tatsuishi, T., Nishimura, Y., Yamaguchi, J.Y., Oyama, Y., Miyoshi, N., Wada, M., 2004. Cytometric analysis of adverse action of diphenyl ditelluride on rat thymocytes: cell shrinkage as a cytotoxic parameter. Environ. Toxicol. 19, 614-619.
Kinazaki, A., Sakanashi, Y., Oyama, T.M., Shibagaki, H., Yamashita, K., Hashimoto, E., Nishimura, Y., Ishida, S., Okano, Y., Oyama, Y., 2009. Micromolar Zn2+ potentiates the cytotoxic action of submicromolar econazole in rat thymocytes: possible disturbance of intracellular Ca2+ and Zn2+ homeostasis. Toxicol. In Vitro. 23, 610-616. Maggini, S., Wenzlaff, S., Hornig, D., 2010. Essential
role of vitamin C and zinc in child immunity and health. J. Int. Med. Res. 38, 386-414.
Mandl, J., Szarka, A., Bánhegyi, G., 2009. Vitamin C: update on physiology and pharmacology. Br. J. Pharmacol. 157, 1097-1110.
Matsui, H., Sakanashi, Y., Nishimura, Y., Kawanai, T., Oyama, Y. Ishida, Y., Okano, Y., 2009. Effects of Zn2+ chelators, DTPA and TPEN, and ZnCl
2 on the cells treated with hydrogen peroxide: a flow-cytometric study using rat thymocytes. Nat. Sci. Res. Univ. Tokushima 23, 12-18. http://web.ias.tokushima-u.ac.jp/bulletin/natj.html Matsui, H., Oyama, T.M., Okano, Y., Hashimoto, E.,
Kawanai, T., Oyama, Y., 2010. Low micromolar
zinc exerts cytotoxic action under H2O2-induced oxidative stress: Excessive increase in intracellular Zn2+ concentration. Toxicol. (In Press) doi:10.1016/j.tox.1010.06.011
Matsui, H., Sakanashi, Y., Oyama, T.M., Oyama, Y., Yokota, S., Ishida, S., Okano, Y., Oyama, T.B., Nishimura, Y., 2008. Imidazole antifungals, but not triazole antifungals, increase membrane Zn2+ permeability in rat thymocytes Possible contribution to their cytotoxicity. Toxicol. 248, 142-150.
McConkey, D.J., Jondal, M., Orrenius, S., 1994. The regulation of apoptosis in thymocytes. Biochem. Soc. Transac. 22, 606-610.
Nakao, H., Umebayashi, C., Nakata, M., Nishizaki, Y., Noda, K., Okano, Y., Oyama, Y., 2003. Formaldehyde-induced shrinkage of rat thymocytes. J. Pharmacol. Sci. 91, 83-86.
Nappi, A.J., Vass, E., 2000. Hydroxyl radical production by ascorbate and hydrogen peroxide. Neurotoxic. Res. 2, 343-355
Nishimura, Y., Oyama, T.B., Sakanashi, Y., Oyama, T.M., Matsui, H., Okano, Y., Oyama, Y., 2008. Some characteristics of quercetin-induced cytotoxicity on rat thymocytes under in vitro condition. Toxicol. In Vitro. 22, 1002-1007. Nishimura, Y., Kanada, A., Yamaguchi, J.Y.,
Horimoto, K., Kobayashi, M., Tatsuishi, T., Kanemaru, K., Ueno, S.Y., Oyama, Y., 2006. Cytometric analysis of lidocaine-induced cytotoxicity: a model experiment using rat thymocytes. Toxicol. 218, 48-57.
Ogata, I., Kawanai, T., Hashimoto, E., Nishimura, Y., Oyama, Y., Seo, H., 2010. Bisabololoxide A, one of the main constituents in German chamomile extract, induces apoptosis in rat thymocytes. Arch. Toxicol. 84, 45-52.
Ortiz, R., Cortés, L., González-Márquez, H., Gómez, J.L., González, C., Cortés, E., 2001. Flow cytometric analysis of spontaneous and dexamethasone-induced apoptosis in thymocytes from severely malnourished rats. Br. J. Nutr. 86, 545-548.
Oyama, Y., Matsui, H., Morimoto, M., Sakanashi, Y., Nishimura, Y., Ishida, S., Okano, Y., 2007. Synergic cytotoxic action induced by simultaneous application of zinc and clotrimazole in rat thymocytes. Toxicol. Lett. 171, 138-145.
Padayatty, S.J., Katz, A., Wang, Y., Eck, P., Kwon, O., Lee, J.H., Chen, S., Corpe, C., Dutta, A., Dutta, S.K., Levine, M., 2003. Vitamin C as an antioxidant: evaluation of its role in disease prevention. J. Am. Coll. Nutr. 22, 18-35.
Prasad, A.S., 2008. Zinc in human health: effect of zinc on immune cells. Mol. Med. 14, 353-357. Quaglino, D., Ronchetti, I.P., 2001. Cell death in the
Takuya Kawanai • Soya Harada • Chiharu Kubota • Erika Hashimoto • Yasuo Oyama
Sakanashi, Y., Oyama, T.M., Matsuo, Y., Oyama, T.B., Nishimura, Y., Ishida, S., Imai, S., Okano, Y., Oyama, Y., 2009. Zn2+, derived from cell preparation, partly attenuates Ca2+-dependent cell death induced by A23187, calcium ionophore, in rat thymocytes. Toxicol. In Vitro. 23, 338-345. Smirnoff, N., Cumbes, Q.J., 1989. Hydroxyl radical
scavenging activity of compatible solutes. Phytochem. 28, 1057-1060.
Stanner, S.A., Hughes, J., Kelly, C.N., Buttriss, J., 2004. A review of the epidemiological evidence for the 'antioxidant hypothesis'. Public Health Nutr. 7, 407-422.
Thompson, L.F., Vaughn, J.G., Laurent, A.B., Blackburn, M.R., Van De Wiele, C.J., 2003. Mechanism of apoptosis in developing thymocytes as revealed by adenosine deaminase-deficient fetal thymic organ cultures. Biochem. Pharmacol. 66, 1595-1599.
Yamaguchi, J.Y., Nishimura, Y., Kanada, A., Kobayashi, M., Mishima, K., Tatsuishi, T., Iwase, K., Oyama, Y., 2005. Cremophor EL, a non-ionic surfactant, promotes Ca2+-dependent process of cell death in rat thymocytes. Toxicol. 211, 179-186.
Received June 30, 2010 Accepted July 16, 2010