Requirements of the Juvenile Prawn for
Calcium, Phosphorus, Magnesium, Potassium,
Copper, Manganese, and Iron
著者
KANAZAWA Akio, TESHIMA Shin-ichi, SASAKI
Mitsuru
journal or
publication title
鹿児島大学水産学部紀要=Memoirs of Faculty of
Fisheries Kagoshima University
volume
33
number
1
page range
63-71
別言語のタイトル
クルマエビにおけるカルシウム, リン, マグネシウ
ム, カリウム, 銅, マンガンおよび鉄の要求量
URL
http://hdl.handle.net/10232/13303
Vol. 33, No. 1, pp. 63-71 (1984)
Requirements of the Juvenile Prawn for Calcium, Phosphorus,
Magnesium, Potassium, Copper, Manganese, and Iron*1
Akio Kanazawa*2, Shin-ichi Teshima*2 and Mitsuru Sasaki*3
Abstract
The feeding experiments were conducted to examine the requirements of the juvenile prawn Penaeus japonicus Bate for the minerals such as Ca, P, Mg, K, Cu, Mn, and Fe. The dietary value of these minerals for the prawns was evaluated in terms of weight gain, feed conversion, survival rate, and molting frequency. Growth of the prawns was improved by the supplement of 1-2% P to the diets, however such an effect of P was affected by dietary Ca levels. The best growth of the prawns was found with the diets supplemented with 1 ~2# levels of Ca and P at the Ca/P ratio of 1:1. Growth of the prawns was also improved by the supplements of Mg (0.1 -0.5&) and K (0.9 and 1.8&), but not by those of Cu (0.06 and 0.\2%\ Mn (0.01 ~0.196), and Fe (0.006-0.012&). These results show that P. japonicus juveniles require dietary sources of P (1 ~296\ Ca (1 -296), Mg (0.396), and K (0.996), but possibly not Fe, Cu, and Mn for normal growth.
Kanazawa et al.l) have introduced a refined diet for studying the nutritional requirements of
the prawn Penaeus japonicus Bate. After that, much information has been accumulated for the
nutritional requirements of the prawn and other crustacean species.2»3) However, the knowledge
of mineral requirements with prawns is still scanty. The composition of minerals used in our earlier
studies4* was provisionally designed in consideration of the mineral mixtures of diets for fish and
insects. In the present study, therefore, we intend to clarify the mineral requirements of P. japonicus
juveniles in order to make up a well-balanced mineral mixture. This paper presents the requirements
of the prawn for P, Ca, Mg, K, Cu, Mn, and Fe, indicating the necessity of inclusion of P, Ca, Mg, and K in the purified diet for good growth.
Materials and Methods Prawns and feeding methods
The prawns P. japonicus, weighing each about 0.2 g, were obtained from Mitsui-Nohrin Kaiyo-sangyo Co. (Kagoshima, Japan), maintained on a commercial diet (Evian; Kyowa-Hakko Kogyo Co., Japan) until they grew up to 0.5 ~ 1.0 g in body weight, and then divided into lots of 15
prawns in an aquarium (30 liter-capacity) for feeding trials. The prawn juveniles were given the test diets at the 1596 level of their body weight daily at 25°C for 30 or 60 days. The basal diet
was similar to that used in the previous study1*, but slightly modified as follows. Soybean oil was substituted with pollack liver oil and the pH value of diets was adjusted to 6.8 with NaOH
*! The results of this research were orally presented at the annual meetings of Japanese Society of Scientific
Fisheries, 1975 and 1976.
*2 Faculty of Fisheries, Kagoshima University, 50-20 Shimoarata-4, Kagoshima 890, Japan.
64 Mem. Fac. Fish., Kagoshima Univ. Vol. 33, No.l (1984)
solution. The test diets used in this study contained the same levels of ingredients each other, except for minerals and cellulose equal to 1003?. The concentrations of P, Ca, K, Mg, Fe, Mn, and Cu in the diets were adjusted with the following salts (see Tables 1, 4, 6, and 8);
NaH2P04-2H20, Na2HP04-2H20, K2HPO4, Ca3(P04), CaCOa, CH3COOK, MgS047H20,
FeS04-7H20, MnS04-5H20, and CuS04. The methods for preparation of diets and rearing of
the prawn were similar to those described previously1*.
Experimental designs and feeding experiments
Five feeding experiments were conducted in this study. Experiments I, II, and III were design ed as one-way layout experimentsin order to check preliminarilythe requirements of P. japonicus juveniles for P, Ca, Mg, and Fe. The dietary value of test diets was evaluated in terms of weight gain, feed conversion, survival rate, and molting frequency. In experiment I, the requirements
of prawns for Ca and P were examined with the diets 1 to 9 (Table 1) containing various levels
of Ca (0.53 to 2.11$ in diets) and P (0 to 4.2$). In experiments II and III, the requirements of prawns for Mg and Fe were investigatedwith the diets 10 to 13 containing Mg (0,0.036,0.072, and 0.154$) (Table4), and the diets 14to 17containingFe (0, 0.007,0.014, and 0.027$) (Table
6), respectively.
The results of experiments I, II, and III suggested that the prawn juveniles necessitate dietary sources of Ca, P, and Mg but not Fe for growth. In experiments IV and V, therefore, the re quirements of prawns for Ca, P, and Mg were reexamined to obtained more reliable evidence. In experiments IV and V, the experimental groups were designed by using an orthogonal array
(L8)5), and the requirements of prawns for K, Mn, Fe, and Cu in addition to Ca, P, and Mg
were checked by assigning the kinds and quantities (96 in diets) of the minerals as factors and levels, respectively, as follows: Factors A (Ca: Ai = l.G6$, A2= 2.11$), B (P: Bx = 1.0696,
B2 = 2.11$), C (Mg: Ci = 0.1$, C2= 0.3$, C3 = 0.5$), D (K: Di = 0.9$, D2=1.8$), E (Fe: Ei = 0, E2= 0.00396), F(Cu: Fi = 0, F2= 0.003$), andG(Mn: Gi = 0, G2=0.00196, G3 = 0.01$).
The factors and levels were alloted to the following files in the orthogonal array. Experiment IV: file numbers 1 (A), 2 (B), 3 (AxB), 4 (C1C2), 5 (D), 6 (E + F), and 7 (G2G3). Experiment V:
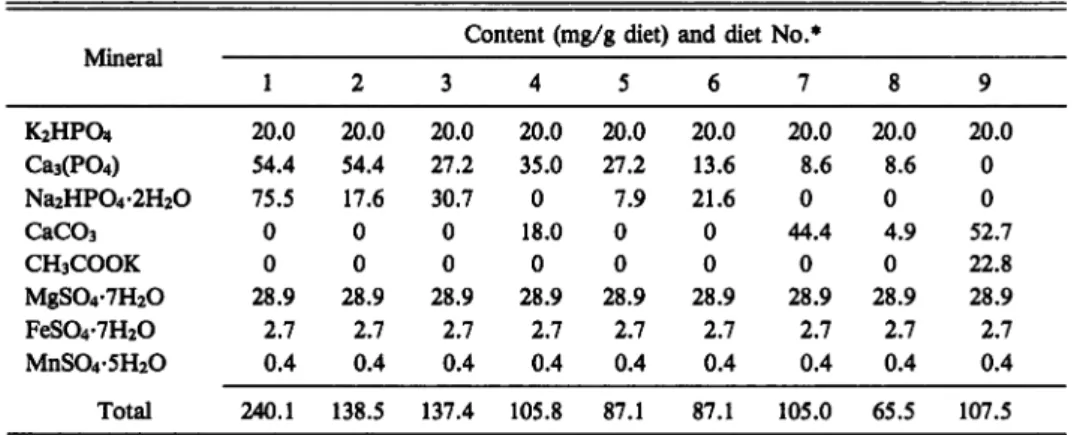
Table 1. Composition of the mineral mixtures used in experiment-I
Mineral
Content (mg/g diet) and diet No.*
1 2 3 4 5 6 7 8 9 K2HPO4 20.0 20.0 20.0 20.0 20.0 20.0 20.0 20.0 20.0 Ca3(P04) 54.4 54.4 27.2 35.0 27.2 13.6 8.6 8.6 0 Na2HP04-2H20 75.5 17.6 30.7 0 7.9 21.6 0 0 0 CaC03 0 0 0 18.0 0 0 44.4 4.9 52.7 CH3COOK 0 0 0 0 0 0 0 0 22.8 MgS04-7H20 28.9 28.9 28.9 28.9 28.9 28.9 28.9 28.9 28.9 FeS04-7H20 2.7 2.7 2.7 2.7 2.7 2.7 2.7 2.7 2.7 MnS04-5H20 0.4 0.4 0.4 0.4 0.4 0.4 0.4 0.4 0.4 Total 240.1 138.5 137.4 105.8 87.1 87.1 105.0 65.5 107.5
* The test diets (pH 6.8-6.9) contained the following ingredients (g/100 g of dry diet) besides minerals:
glucose 5.5, sucrose 10.0, a-starch 4.0, glucosamine HC1 0.8, casein 50.0, sodium citrate 0.3, sodium succinate 0.3, cholesterol 0.5, pollack liver oil 8.0, vitamines 2.7, agar 3.0, and cellulose equal to 100.
file numbers 1 (A), 2 (B), 3 (Ax]B), 4 (C2C3), 5 (D), 6 (GiG2), and 7 (e, part of errors). Table 8 shows the diets used in experiments IV and V. The data obtained from experiments IV and V (Table 9) were put together and analysed synthetically (Table 10) to evaluate the effects of factors
and levels on the dietary value (Table 11).
Mineral concentrations of the prawn bodies after the feeding trials
At the end of feeding trials, the concentrations of Ca, P, Mg, and Fe were determined with the whole body and/or hepatopancreas of the prawns after ashing with nitric acid and perchloric acid. Ca and P concentrations were determined by orthocresolphthalein complexone^ and molybden
blue7* methods, respectively. Fe concentration was estimated by the orthophenanthroline method8*.
Mg concentration was determined by the EDTA method9).
Results Experiments I, II, and in
Tables 2 and 3 show the results of experiment I. The prawn P. japonicus gave the highest values
for weight gain, feed conversion, and survival rate when fed the diet 5 supplemented with 1.06$
Ca plus 1.06$ P and the diet 8 supplemented with 2.11$ Ca plus 2.11$ P (Table 2). The diet 7 supplemented with 1.06$ Ca plus 2.11$ P also gave a high weight gain, but the survival rate
of prawns with this diet was lower than that of prawns with the diets 5 and 8. These results sug
gested that the dietary value of supplemental Ca and Mg was variable with the ratio of Ca/P. The molting frequency of prawns seemed not to vary with the dietary Ca and P levels, although the prawns fed the diets 3, 4 and 6 gave a slightly lower values for molting frequency than the other groups. Table 3 shows the Ca and P concentrations of the whole bodies of prawns after
the feeding trials. Both Ca and P concentrations of the prawns bodies remained almost constant regardless the dietary Ca and P levels. The results of experiment I indicate that P.japonicus juveniles require supplemental 1.06-2.11$ levels of Ca and P at the Ca/P ratio of 1.0 in the purified diets.
Table 2. Effects of Ca and P levelsin diets on the weightgain, feed conversion, survival rate, and molting frequency of P. japonicus juveniles
Diet No. Content P in diets Ca (mg/g) Ca/P Weight gain (%rx Feed conversion*2 (%) Survival rate (96) Molting frequency*3 1 0 2.11 42 8 70 2.3 2 0.53 0.53 1.0 25 4 90 2.0 3 0.53 2.11 4.0 40 8 90 1.5 4 1.06 0.53 0.5 41 9 100 1.6 5 1.06 1.06 1.0 79 17 100 1.9 6 1.06 2.11 2.0 22 4 60 1.3 7 2.11 1.06 0.5 85 16 80 1.8 8 2.11 2.11 1.0 80 17 90 2.1 9 4.22 2.11 0.5 19 3 70 1.8
*l Fifteen prawns, weighing 0.36-0.46 g in initial body weight, were reared for 30 days.
*2 The quantities of food inteked may benot always determined correctly because the prawn nibbles the diets.
*3 Molting frequency =
i, date
66 Mem. Fac. Fish., Kagoshima Univ. Vol. 33, No.l (1984)
Table 3. Effects of dietary Ca and P levels on the Ca and P contents of the prawnbodies Diet Dietary level (96) Content of the prawns (mg/g fresh wt.)*
No. P Ca P Ca Ca/P 1 0 2.11 2.70 11.9 4.4 2 0.53 0.53 2.71 13.1 4.8 3 0.53 2.11 2.22 13.8 6.2 4 1.06 0.53 2.15 11.4 5.3 5 1.06 1.06 2.73 13.0 4.8 6 1.06 2.11 2.44 13.1 5.4 7 2.11 1.06 2.70 12.5 4.6 8 2.11 2.11 2.77 12.7 4.6 9 4.22 2.11 2.68 11.2 4.2
* The Ca and P contents were determined with the whole bodies of the prawns fed the test diets for 30 days.
Table 4 shows the results of experiment II. The weight gain, feed conversion, and survival rate of the prawns were improved with the increasing levelsof Mg in diets, indicating that P. japonicus juveniles probablyrequire dietary sources of Mg for growth. The highest values for weight gain, feed conversion, and survival ratewereobserved with the diet 13 supplemented with 0.154$ Mg. But, the molting frequency of prawns was not variable with the dietary Mg levels at the levels of 0.036-0.154$ in diets. Table 5 shows the Mg and Ca concentrations of the hepatopancreas
and remains of prawns after the feeding trials. The Mg and Ca concentrations of the hepatopan creas and remains did not vary markedly with the dietary Mg levels.
Table 4. Effects of dietary Mg levels on the weight gain, feed conversion, survival rate, and molting
frequency of P. japonicus juveniles
Diet Mg content Weight Feed conversion Survival Molting
No. (96 of diets)*1 gain (96)*2 (96) rate (96) frequency
10 0 155 13.4 90 1.7
11 0.036 259 19.8 100 1.9
12 0.077 280 22.3 100 2.0
13 0.154 357 25.0 100 1.9
*! Mg contentwasadjusted with MgS04-7H20. The diets 10to 13 contained the following minerals (mg/g diet) besides Mg; K2HP04, 20.0; Ca3(P04), 27.2; Na2HP04, 7.9; FeS04-7H20, 2.7;MnS04-5H20,0.4. *2 Fifteen prawns, weighing 0.30-0.33 g in initial body weight, were reared for 60 days.
Table 5. Effects of dietary Mg levels on the Mg and Ca contents of the prawn tissues*
Diet No. Dietary Mg level (96 of diets) Mg content (no Hepatopancreas ig/g fresh wt.) Remains Ca content (mg/g fresh wt.) Hepatopancreas Remains 10 0 37.7 2.2 3.9 16.7 11 0.036 37.3 1.6 4.3 17.9 12 0.077 37.3 2.0 4.0 17.7 13 0.154 35.4 1.0 4.4 17.2 * The Mg and Ca contents of the hepatopancreas andremained tissues were determined with the prawns
Table 6 shows the results of experiment III. The weight gain and feed conversion of prawns
decreased with the increasing levelsof Fe in diets, although the survival rate and molting frequen cy remained roughly constant regardless the dietary Fe levels. These results indicated that growth
of the prawn was suppressed on the diets supplemented with more than 0.007$ Fe. Table 7 shows
the Fe and Ca concentrations of the hepatopancreas and remains of prawns after the feeding trials.
As the dietary Fe levels were increased, the Fe concentration of the hepatopancreas decreased,
whereas that of the remains increased slightly. With the increasing Fe levels in diets, the Ca con centration of the hepatopancreas also decreased slightly, but that of the remains remained almost constant.
Table 6.Effects of dietary Fe levels on the weight gain, feed conversion, survival rate, and molting frequency of P. japonicus juveniles
Diet
No.
Fe content
(96 of diets)*1 gain ($)*2Weight
Feedconversion (96) Survival rate (96) Molting frequency 14 0 455 43.3 60 1.7 15 0.007 395 45.0 70 1.9 16 0.014 138 15.9 70 2.0 17 0.027 126 7.9 60 1.9
*l Fe content was adjusted with FeS04-7H20. Thediets 14to 17contained the following minerals (mg/g
diet) besides Fe: K2HP04, 20.0; Ca3(P04), 27.2; Na2HP04, 7.9; MgS04-7HzO, 28.9; MnS04-5H20, 0.4.
*2 Fifteen prawns, weighing 0.25-0.28 g in initial body weight, were reared for 60 days.
Table 7. Effects of dietary Fe levels on the Fe and Ca contents of the prawn tissues*
Diet Dietary Fe level
(96 of diets)
Fe content (mg/fresh wt.) Hepatopancreas Remains
Ca content (mg/fresh wt.)
No. Hepatopancreas Remains
14 0 6.60 0.95 5.34 15.5 15 0.007 5.53 0.99 4.41 15.4 16 0.014 4.38 1.52 4.81 15.7
17 0.027 4.30 1.13 4.60 15.4
* The Fe and Ca contents of the hepatopancreas and remained tissues weredetermined with the prawns
fed the test diets for 60 days.
Experiments IV and V
As mentioned above, the results of experiments I, II, and III indicated that the prawn probably requires the supplemental Ca, P, and Mg but not Fe for growth. In experiments IV and V, hence, the dietary value of Ca, P, and Mg was reexamined by the feeding experiments which were designed
as factorial experiments using an orthogonal array Ls (Table 8). In addition, the dietary value of supplemental Mn and a mixture of Fe-Cu (1:1) was investigated in experiment IV. The results of the feeding trials are given in Table 8. Table 9 shows the results of the analysis of variance
with the weight gain, feed conversion, survival rate, and molting frequency data.
As for the weight gain, a significant difference (P<0.10) was observed in the following fac
tors: Ca x P (interaction between Ca and P), Mg (0.3$, 0.5$), K (0.9$, 1.8$), and R (variabiUty
68 Mem. Fac. Fish., Kagoshima Univ. Vol. 33, No.l (1984)
Table 8. Experimental groups, the mineral composition of diets, and the results of feeding trials in experiments IV and V
Experi- r
Diet
Mineral supplemented (mg/g dry diet) Weight Feed con- Survival
Molting
ment* urouP
No.
Ca
P Mg
K Mn Fe
Cu gain (96) version($) rate ($6) frequency
1 18 10.6 10.6 1.0 9.0 0.01 0 0 46.1 3.9 63 1.9 2 19 10.6 10.6 3.0 18.8 0.1 0.03 0.03 61.8 6.6 50 2.3 3 20 10.6 21.1 1.0 9.0 0.1 0.03 0.03 21.2 2.0 38 2.0 IV 4 21 10.6 21.1 3.0 18.0 0.01 0 0 57.4 5.1 63 1.8 5 22 21.1 10.6 1.0 18.0 0.1 0 0 11.0 0.9 50 1.7 6 23 21.1 10.6 3.0 9.0 0.1 0.03 0.03 36.4 3.7 38 1.8 7 24 21.1 21.1 1.0 18.0 0.01 0.03 0.03 42.2 3.5 50 1.6 8 25 21.1 21.1 3.0 9.0 0.1 0 0 39.6 3.5 50 1.4 1 26 10.6 10.6 3.0 9.0 0 0 0 121.5 23.5 100 0.9 2 27 10.6 10.6 5.0 18.0 0.01 0 0 30.7 5.3 78 0.5 3 28 10.6 21.1 3.0 9.0 0.01 0 0 90.5 17.4 100 0.3 V 4 29 10.6 21.1 5.0 18.0 0 0 0 18.6 3.6 78 1.0 5 30 21.1 10.6 3.0 18.0 0 0 0 52.2 8.7 67 0.9 6 31 21.1 10.6 5.0 9.0 0.01 0 0 58.2 12.2 100 0.8 7 32 21.1 21.1 3.0 18.0 0.01 0 0 75.1 15.5 100 0.3 8 33 21.1 21.1 5.0 9.0 0 0 0 108.4 21.6 89 0.7
* Experimental groups were designed using an orthogonal array Ls. The test diets contained a fixed level of K2HP04 (20.0 mg/g diet) and Ca3(PO)4 (27.2 mg/g diet) and varying levels of other minerals. The Ca, P, Mg, K, Fe, and Cu in diets were adjusted by the quantities of CaC03, NaH2P04-2H20, MgS04-7H20, CH3COOK, MnS04-5H20, FeS04-7H20, and CuS04, respectively.
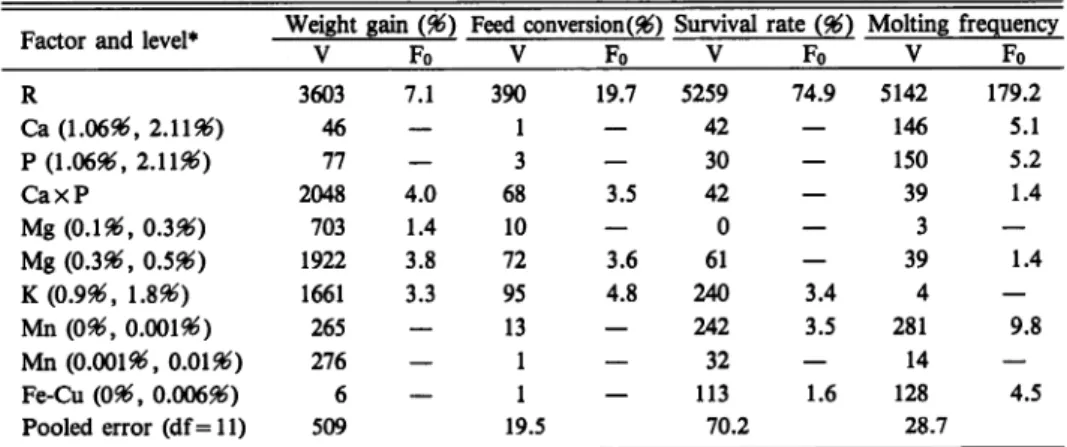
Table 9. Analysis of variance with the data from experiments IV and V
Factor and level* Weight gain (96) Feed conversion (96) Survival rate (96) Molting frequency V Fo V Fo V Fo V Fo R 3603 7.1 390 19.7 5259 74.9 5142 179.2 Ca (1.06$, 2.U96) 46 — 1 — 42 — 146 5.1 P (1.06$, 2.11$) 77 — 3 — 30 — 150 5.2 CaxP 2048 4.0 68 3.5 42 — 39 1.4 Mg (0.1$, 0.3$) 703 1.4 10 — 0 — 3 — Mg (0.3$, 0.5$) 1922 3.8 72 3.6 61 — 39 1.4 K(0.9$, 1.8$) 1661 3.3 95 4.8 240 3.4 4 — Mn (096, 0.001$) 265 — 13 — 242 3.5 281 9.8 Mn (0.001$, 0.01$) 276 — 1 — 32 — 14 — Fe-Cu (096, 0.00696) 6 — 1 — 113 1.6 128 4.5 Pooled error (df = 11) 509 19.5 70.2 28.7
* R: variabilityof the data between experiments IV and V. CaxP indicates the interaction between the factors, Ca and P.
the factors such as Ca (1.06$, 2.11$), P (1.06$, 2.11$), Mg (0.1$, 0.3%), Mn (0$, 0.001$), Mn (0.001$, 0.01$), and Fe-Cu (0$, 0.006$). The factors such as CaxP, Mg (0.3$, 0.5$), and K (0.9$, 1.8$) were also significant (P<0.10) with the feed conversion. The survival rates were significantly (P<0.10) different with the factors, K (0.9$, 1.8$) and Mn (0$, 0.001$).
The molting frequency was significantly different with the factors, Ca (1.06$ ,2.11$; P<0.05),
P (1.06$, 2.11$; P<0.05), Mn (0$, 0.001$; P<0.01), and Fe-Cu (0$, 0.0006$; P<0.10).
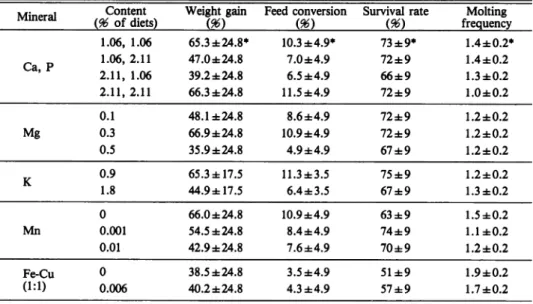
Table 10 shows the population means and confidence limit (P = 0.95) of the weight gain, feed conversion, survival rate, and molting frequency of the prawn juveniles which were fed the diets with varying levels of Ca, P, Mg, K, Mn, and Fe-Cu. The results of experiments IV and V (Tables 9 and 10) supported the results of the dietary value of supplemental Ca, P, and Mg in experiments
I and II.
Table 10. Population means and confidence intervals of the weight gain, feed conversion, survival rate, and molting frequency of P. japonicus juveniles
Mineral Ca, P Content (96 of diets) Weight gain m Feed conversion m
Survival rate Molting frequency 1.06, 1.06 65.3 ±24.8* 10.3 ±4.9* 73 ±9* 1.4 ±0.2* 1.06,2.11 47.0 ±24.8 7.0±4.9 72±9 1.4 ±0.2 2.11, 1.06 39.2 ±24.8 6.5 ±4.9 66±9 1.3±0.2 2.11,2.11 66.3 ±24.8 11.5±4.9 72±9 1.0 ±0.2 0.1 48.1 ±24.8 8.6±4.9 72±9 1.2 ±0.2 Mg 0.3 66.9±24.8 10.9±4.9 72±9 1.2 ±0.2 0.5 35.9±24.8 4.9±4.9 67±9 1.2 ±0.2 K 0.9 65.3 ±17.5 11.3±3.5 75 ±9 1.2 ±0.2 1.8 44.9 ±17.5 6.4±3.5 67±9 1.3±0.2 0 66.0 ±24.8 10.9±4.9 63 ±9 1.5±0.2 Mn 0.001 54.5 ±24.8 8.4±4.9 74±9 1.1 ±0.2 0.01 42.9 ±24.8 7.6±4.9 70±9 1.2 ±0.2 Fe-Cu 0 38.5 ±24.8 3.5 ±4.9 51±9 1.9 ±0.2 (1:1) 0.006 40.2 ±24.8 4.3 ±4.9 57±9 1.7 ±0.2 * Confidence limits (P=0.95) Discussion
Considering the results of experiments I to V, we concluded the following. (1) The supplements of 1.06-2.11$ levels of Ca and P to the purified diets were indispensable for growth of P. japonicus juveniles. But, the Ca/P ratio in diets affected the dietary value of supplemental Ca
and P, the favorable ratio of Ca/P being about 1.0. (2) The additions of 0.3$ Mg and 0.9$ K to the diets were also effective in improving growth. (3) The supplemental Mn, Fe, and Cu had no effect on the improvement of dietary value of diets. Contrarily, the addition of excessive Fe (more than 0.014$ in diets) suppressed growth of the prawn.
By the feeding experiments designed as one-way layout experiments, Deshimaru and Yone10)
have shown that the prawn juveniles require supplemental 2.0$ P, 1.0$ K, and 0.2$ trace metals including Al, Zn, Mn, Cu, Co, etc. but not Ca, Mg, and Fe for growth. Kitabayashi et al.n) have revealed the necessity of supplemental Ca in the diets of prawn juveniles. Our finding on the dietary value of supplemental K and Fe almost agreed with that on the same prawn obtained by Deshimaru and Yone10), but not with that on the red sea bream Chrysophrys major, a marine fish1215). As mentioned above, however, the information on the effects of supplemental Ca and
70 Mem. Fac. Fish., Kagoshima Univ. Vol. 33, No.l (1984)
Mg for the prawn is conflicting.
Literatures have shown that the supplement of suitable levels of Ca to diets was effective in
improving growth of the catfish Ictaluruspunctatus16*, the rainbow trout Salmo gairdnerill), and the carp Cyprinus carpiolS). The supplemental Mg has also been revealed to improve growth of the carp19) and the rainbow trout20*21*. Whereas, Ogino and Takeda22* have pointed out that growth of the carp was correlated with dietary P levels but not with Ca levels, suggesting that the carp is likely to balance the ratio of Ca/P of bodies by controlling the absorption or excretion of Ca. The red sea bream has also been shown not to require supplemental Ca23) and Mg24* when the diets contained small amounts of Ca (more than 0.136$) and Mg (more than 0.012$) together with sufficient amounts of Ca (more than 0.68$), presuming the possible uptake of both Ca and Mg from sea water by this fish. Deshimaru and Yone10) have thought that the prawn P. japonicus possibly meets the Ca requirement by uptaking Ca from environmental water, because the 45Ca dissolved in sea water was absorbed more effectively by the prawns fed the diets without supplemental Ca as compared with the groups fed the diets with supplemental Ca25). In the pre sent study, however, the significant (P<0.10) interaction was found between the effects of sup
plemental Ca and P on the weight gain, feed conversion, and survival rate of the prawn (see Table 9). Therefore, we assume that a supplemental Ca may play some role in the effective utilization of dietary P by the prawn. This point will warrant further detailed studies in future.
References
1) Kanazawa, A., M. Shimaya, M. Kawasaki and K. Kashiwada (1971): Nutritional requirements of prawn I. Feeding of artificial diet. Bull. Japan. Soc. Sci. Fish., 36, 949-954.
2) Kanazawa, A. (1980): Nutritional requirements of lobster, shrimp, and prawn. Marine Sci., 12, 864-871. 3) New, M.B. (1980): A bibliography of shrimp and prawn nutrition. Aquaculture, 21, 101-128. 4) Kanazawa, A., N. Tanaka, S. Teshima and K. Kashiwada (1971): Nutritional requirements of prawn II.
Requirements for sterols. Bull. Japan. Soc. Sci. Fish., 37, 211-215.
5) Ishikawa, H., T. Fujimori and H. Kume (1964): "Design of Experiments (In Japanese)", Lower Vol., pp. 303-363, Tokyo-Kagakudojin, Tokyo.
6) Conerty, H.V. and A.R. Briogs (1966): Determination of serum calcium by means of the or-thocresolphthalein complexone. Am. J. Clin. Path., 45, 290-296.
7) Tausky, H.H. and E. Shorr (1953): A microcolorimetric method for the determination of inorganic phosphorus. /. Biol. Chem., 202, 675-685.
8) Mitsuda, H. (1961): "Experiments of Nutritional Chemistry (In Japanese)", pp. 267-269, Izumishobo Co., Tokyo.
9) Mitsuda, H. (1961): "Experiments of Nutritional Chemistry (In Japanese)", pp. 247-251, Izumishobo Co., Tokyo.
10) Deshimaru, O. and Y. Yone (1978): Requirement of prawn for dietary minerals. Bull. Japan. Soc. Sci. Fish., 44, 907-910.
11) Kttabayashi, K., H. Kurata, K. Shudo, K. Nakamura and S. Ishikawa (1971): Studies of formula feed for kuruma prawn I. On the relationship among glucosamine, phosphorus, and calcium. Bull. Tokai Reg. Fish. Res. Lab., 65, 109-118.
12) Sakamoto, S. and Y. Yone (1976): Requirement of red sea bream for dietary Fe-I. Rep. Fish. Res. Lab.
Kyoshu Univ., 3, 53-58.
13) Sakamoto, S. and Y. Yone (1978): Requirement for red sea bream for dietary Na and K. /. Fac. Agr. Kyushu Univ., 23, 79-84.
Sci. Fish., 44, 223-225.
15) Sakamoto, S. and Y. Yone (1979): Availabilities of three iron compounds as dietary iron sources for red sea bream. Bull. Japan. Soc. Sci. Fish., 45, 231-235.
16) Andrews, J.W., T. Murai and C. Campbell (1973): Effects of dietary calcium and phosphorus on growth, food conversion, bone ash and hematocrit levels of catfish. /. Nutr., 5, 766-771.
17) Arai, S., R. Muller, Y. Shimma and T. Nose (1975): Effects of calcium supplement to yeast grown on hydrocarbons as feedstuff for rainbow trout. Bull. Freshwater Fish. Res. Lab., 25, 33-40.
18) Nakamura, Y. (1982): Effects of dietary phosphorus and calcium contents on the absorption of phos phorus in the digestive tract of carp. Bull. Japan. Soc. Sci. Fish., 48, 409-413.
19) Ogino, C. and J.Y. Chiou (1976): Mineral requirements in fish II. Magnesium requirement of carp. Bull.
Japan. Soc. Sci. Fish., 42, 71-75.
20) Cowey, C.B., D. Knox, J.W. Adron, S. George and B. Pmm (1977): The production of renal calcinosis by magnesium deficiency in rainbow trout (Salmo gairdnen). Br. J. Nutr., 38, 127-135.
21) Ogino, C, F. Takashima and J.Y. Cmou (1976): Requirement of rainbow trout for dietary magnesium.
Bull. Japan. Soc. Sci. Fish., 44, 1105-1108.
22) Ogino, C. and H. Takeda (1976): Mineral requirements in fish III. Calcium and magnesium requirements in carp. Bull. Japan. Soc. Sci. Fish., 42, 793-799.
23) Sakamoto, S. and Y. Yone (1976): Requirement of red sea bream for dietary Ca. Rep. Fish. Res. Lab. Kyushu Univ., 3, 59-64.
24) Sakamoto, S. and Y. Yone (1979): Requirement of red sea bream for dietary Mg. Bull. Japan. Soc. Sci. Fish., 45, 57-60.
25) Deshimaru, O., K. Kuroki, S. Sakamoto and Y. Yone (1978): Absorption of labelled calcium-45Ca by prawn from sea water. Bull. Japan. Soc. Sci. Fish., 44, 975-977.