Asian Economy: The Impact of Skyrocketing Oil
Prices on Asia
権利
Copyrights 日本貿易振興機構(ジェトロ)アジア
経済研究所 / Institute of Developing
Economies, Japan External Trade Organization
(IDE-JETRO) http://www.ide.go.jp
journal or
publication title
Yearbook of Asian Affairs 2006
page range
33-42
year
2007
T
he price of oil during 2004 and 2005 rose to abnormal heights, with the price rising to exceed US$70 per barrel after the hurricanes. The average WTI (West Texas Intermediate) oil price in 2005 was US$57. In Japan, the high prices have been attributed to OPEC and China, but the United States is also an important factor. It appears that the price of oil will not drop below US$55 due to the fragility of the oil supply cushion and the addition of a risk premium.In Asia where firm growth continues in oil demand due to economic development, the impact of high oil prices on the economy is being dealt with for the time being, but there is concern that, if this situation is unex-pectedly prolonged, it may cause severe damage. There is a need for Asia to respond to the issues stated herein and to boost its strength and flexi-bility as an oil consumer.
Soaring and Violent Fluctuations of Oil Prices
In 1987, the method of setting oil prices was switched from standard oil price system (a fixed price system in which Arabian light was the stan-dard) to a fluctuating price system (which is linked to the market price). There were temporarily high prices due to the Gulf crisis, but until 1995 oil prices performed stably in the range of US$14 to US$20 per barrel (Figure 4.1). However starting in 1996, wild fluctuations outside of this range occurred repeatedly, and the price of oil in 2000 remained over US$30 despite increased production by OPEC.
Oil prices rose until the beginning of the Iraq War in March 2003 and then dropped at the start of the war. It was expected that oil prices would
High Oil Prices and the
Asian Economy: The
Impact of Skyrocketing
Oil Prices on Asia
Y
OSHIKIO
GAWAChapter 4
further decline when the end of the war was declared in May, but instead prices rose and remained above US$30. In 2004, oil prices surpassed US$35 and continued to edge upward. In October, prices exceeded the abnormally high level of US$50 (Figure 4.1).
At the end of 2004, prices dropped to the low US$40 range, but resumed their uptrend in 2005. At the end of June 2005, the market entered the abnormal skyrocketing phase where the price exceeded US$60. The price continued to creep upward after that, and due to Hurricane Katrina at the end of August, oil prices soared temporarily to more than US$70. Subsequently, prices remained around US$60 or higher due to hurricanes. In the end, the average WTI oil price in 2005 was an abnormally high US$57.
Factors in the Soaring and Violent Fluctuations
The sudden rise in oil prices from 2004 was the result of complex interac-tion of diverse factors. The following nine factors are the primary ones. (1) Development of conditions in Iraq and trends in oil production and
export: A recovery in production was visible following the end of the Iraq War, but prewar production and export levels have not been rein-Figure 4.1. Soaring and Violent Fluctuations of Oil Prices since 2000
Hurricane Katrina
Asian Economic Crisis Price Plunge 9-11 Terror Dubai Iraq War (US$/barrel) 1985 86 87 88 89 90 91 92 93 94 95 96 97 98 99 2000 01 02 03 04 05 06 Gulf Crisis Brent WTI 65 60 55 50 45 40 35 30 25 20 15 10 5
Source: Prepared from data in the International Energy Agency’s Oil Market Report and
High Oil Prices and the Asian Economy: The Impact of Skyrocketing Oil Prices on Asia | 35
stated due to the quagmire of internal strife.
(2) Growth of global oil demand: Demand stagnated after the popping of the IT bubble in 2000, but since 2003, demand has recovered in the United States and is accelerating in Asia and in China in particular. (3) Supply obstructions in major producer countries: Obstructions to
sup-ply occurred in Venezuela and Nigeria, in addition to Iraq. The issue of Iran’s nuclear development also spread loss of confidence concern-ing supply.
(4) Decline in oil production capacity in the OPEC oil-producing coun-tries: Due to overproduction due to soaring prices, only around one million barrels/day remains in 2005 capacity.
(5) Sluggishness of rise in oil production in non-OPEC countries: A decline in North Sea oil production has become evident, and signs of decelerated production are becoming visible in Russia, which had led production increases for the past five years.
(6) Supply obstructions in Russia: The Yukos incident in 2004 and the stoppage of supply to Ukraine in 2005 caused large uncertainties about oil and gas supply.
(7) Fragility of the supply cushion of the US market: The ability of the US market to adjust to tight supply, i.e., the supply cushion, is fragile due to the decline in oil-refining surplus capacity, the low level of oil prod-uct stocks, and decline in natural gas supply surplus capacity, etc. (8) Repeated hurricanes in the United States: In 2005 multiple large
hurri-canes struck the coast of the Gulf of Mexico, and the damage caused obstructed the supply of oil and gas.
(9) Increase in speculative transactions and the rise of risk premiums: Speculative funds were invested in oil futures, giving rise to a pre-mium disassociated from actual supply and demand, and the overreac-tion of the futures market became radical.
Weakening of the Supply Cushion Primarily in the US Market
In the discussion within Japan, soaring oil prices were often explained as an OPEC problem or a Chinese problem, but the more important factor was the US problem. We will examine the above-mentioned factors (7) to (9) from the standpoint of the price gap between recent energy prices and the WTI crude oil price (Figure 4.2).
In 2003, the prices of natural gas and heating oil jumped up due to the cold wave in February and the consumption of stockpiles, and abnormally
high natural gas prices continued until June. So, oil prices remained high following the end of the Iraq War. Subsequently, because of higher gaso-line prices due to low stockpiles and lack of production surplus capacity and because of continued high natural gas and heating oil prices due to tight supply during the winter, oil prices remained high, in the range of US$30 per barrel.
In 2004, oil prices jumped higher due to tight gasoline demand, reach-ing the US$40 range in May. This produced a price gap of US$20 with May WTI crude. From July, the rise was led by crude oil, topping US$50 in October. This was because, while demand for oil was increasing pri-marily in China, OPEC’s surplus capacity was nearly exhausted, and then the Yukos problem occurred.
Soaring prices in 2005 followed the same structure. In particular, from late August massive hurricanes struck the coast of the Gulf of Mexico in succession, directly hitting oil and gas supply facilities. A large amount of the stockpiles were consumed, and oil prices fluctuated in the US$60 range. Wintertime natural gas prices also rose sharply.
With an eye on these supply and demand fluctuations, large amounts of speculative funds were invested in the futures market. Special mention Figure 4.2: Soaring Gasoline, Heating Oil, and Natural Gas Prices
in the US Market 30 25 20 15 10 5 0 -5 -10 -15 1 2003 2004 2005 2006 2 3 4 5 6 7 8 9 10 11 12 1 2 3 4 5 6 7 8 9 10 11 12 1 2 3 4 5 6 7 8 9 10 11 12 1 2 -20
Price differential from WTI crude ($/barrel)
Soaring gasoline/heating oil Soaring gas
Soaring heating oil/gas Soaring gasoline
Soaring crude oil
Soaring heating oil/gas Soaring heating oil/gas
Soaring gas WTI Crude Gasoline Heating Oil Natural Gas Soaring gasoline
Source: Prepared using data from the website of the US Department of Energy and NYMEX
must be made of the fact that overreaction in that market further exacer-bated the high prices.
Looking back overall, it can be said that the facility overcapacity devel-oped during the 1970s oil crisis was resolved over the ensuing quarter century. This structural surplus was a significant supply cushion in the past, but in the end it became fragile and began to hit various barriers of supply and demand fundamentals. It can be said that the speculative funds invested in the futures market worsened the bottleneck and caused high prices, trapping the world in a cycle of violent fluctuations which will result in a market crash when the turning point arrives.
The price of around US$40 (on barrel basis) for natural gas in February 2006 was an appropriate level for oil prices given the level of supply and demand, but it is unlikely to drop below US$55 for the time being due to the bottleneck in the supply cushion and the addition of a risk premium. This is because there is not instant fix and a certain amount of time is necessary to strengthen the supply cushion by development of oil drilling, increasing equipment, and building up stockpiles, etc. The world must be prepared for violent oil price fluctuations from US$30 to US$70 henceforth.
Asia’s Economic Development and Bullish Increase in Oil Demand
Since the end of the 1980s, Asia has achieved startling economic develop-ment. Oil demand increased annually, with consumption of five hundred thousand to one million barrels daily from 1990 to 1997. Oil demand in Asia then grew sluggish until 2002 due to the Asian economic crisis and the burst of the IT bubble in the United States. In 2003 and 2004, demand again increased to around one million barrels per day due to economic conditions primarily in China.
Under these circumstances, the economy was exposed to the abnor-mally high prices of 2004 and 2005, and the oil market report of the International Energy Agency (IEA) predicted lower oil demand in 2005 (Figure 4.3). According to the Chinese statistics, net oil imports in 2005 were lower than those of the previous year, and this appears to be due to the effect of the soaring prices. On the other hand, there is data that tells of active economic growth in 2005, and so it is difficult to draw a conclu-sion. Furthermore, Asian oil demand in 2006 is expected to increase over the 2005 level.
Economic Impact of Soaring Oil Prices
Among the impacts of rising oil prices on the economy are (1) income shift to oil-producing countries, (2) rising prices overall due to higher prices on imports, and (3) a decline in exports due to the deceleration of the global economy. Of those, we can see the short-term and direct impact on income shift to oil-producing countries.
A rough analysis was conducted of the economic impact caused by income transfer due to higher prices starting in 2000 in Asian countries (Table 4.1). Specifically, a study was made of income transfer as a share of GDP in oil-producing countries which occurred from rising prices start-ing in 2000, compared to the average prices in 1991 to 1999. Unknown figures for 2004 and 2005 were estimated based on certain assumptions.
Looking at the results, Japan’s GDP loss due to income transfer agrees with what is generally said. Compared to Japan, NIEs such as South Korea and Taiwan and developing oil-importing countries such as Thailand and Figure 4.3. Year-on-Year Increases Reveal Steady Increase in Oil Demand in Asia 3.0 2.5 2.0 1.5 1.0 0.5 0 -0.5 -1.0 1990 91 92 93 94 95 96 97 98 99 2000 01 02 03 04 05 06 -1.5 (Million barrels/day)
Sources: International Energy Agency, Oil Market Report, and BP, Statistical Review of World Energy, 2005.
Economic disorder in former Soviet Union and Eastern Europe
Asian economic crisis
Asia
Europe/Former Soviet Union Other
North America Total
Abnormally high oil prices IT bubble pops
the Philippines felt greater impact. The impact on China was relatively small, and this is mostly likely due to the fact that its ratio of oil imports is still low.
Because oil-producing countries receive income transfers, a GDP increase is created in countries such as Malaysia and Viet Nam, but since Indonesia has changed to become a net importer of oil, it was in the group suffering a GDP loss. Indonesia carried out large petroleum fuel price hikes, suppressing the opposition from the people. In Bangladesh and Myanmar, the proportion of the economy dependent on oil is small, and so the impact was light.
Because there is a strong perception, as of the end of 2005, of the abnormally high prices as being temporary, the economic impact has also been perceived as temporary. However, if the abnormally high prices are unexpectedly prolonged, there is concern that the Asian economy may High Oil Prices and the Asian Economy: The Impact of Skyrocketing Oil Prices on Asia | 39
Table 4.1. Effects of Oil Export/Import Income Transfer Due to Soaring Prices from 2000
Income transfer due to oil export/import as a percentage of GDP (%):
Japan -0.40 -0.17 -0.17 -0.29 -0.61 -1.23 South Korea -1.49 -0.62 -0.59 -1.03 -2.19 -4.32 China -0.53 -0.22 -0.24 -0.45 -1.21 -2.37 Taiwan -0.95 -0.42 -0.42 -0.74 -1.60 -3.18 Philippines -1.57 -0.65 -0.59 -1.02 -2.18 -4.27 Thailand -1.57 -0.62 -0.64 -1.14 -2.65 -5.11 Vietnam 1.79 0.74 0.61 0.97 2.69 4.96 Malaysia 1.33 0.55 0.53 1.05 2.26 4.23 Singapore -1.17 -0.56 -0.53 -0.80 -2.24 -4.62 Indonesia 0.93 0.29 0.16 0.08 -0.08 -0.28 Myanmar -0.90 -0.24 -0.21 -0.46 -1.13 -2.35 Bangladesh -0.47 -0.23 -0.22 -0.39 -0.85 -1.65 India -1.10 -0.46 -0.47 -0.78 -1.70 -3.31 Pakistan -1.46 -0.59 -0.56 -0.83 -1.58 -3.09 Sri Lanka -1.49 -0.63 -0.65 -1.14 -2.53 -4.89
Total for Asia -0.54 -0.23 -0.23 -0.41 -0.93 -1.87
9.39 4.03 4.06 7.20 15.86 31.98
Increase compared to 1991–99 average price ($/barrel)
Source: Prepared based on energy and economic data of IEA and BP statistical data. Note: Figures for 2004 and 2005 are estimates based on certain assumptions.
2001
receive a body blow damage, especially from the impact of (2) and (3) above. The impact is likely to particularly massive on the oil-importing developing countries in Asia where industrialization is progressing. Long-term Increase in Asia’s Oil Imports
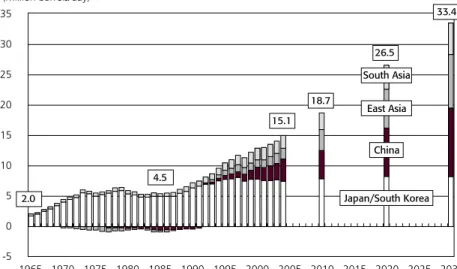
It is predicted that the rapid expansion of net oil imports by Asia will con-tinue over the long term due to the bullish increase in demand for oil accompanying economic development (Figure 4.4). In the 1980s, Japan was the primary oil importer, but throughout the 1990s, oil imports by China, East Asia, and South Asia grew and are currently double the amount of Japan’s imports. Henceforth oil imports by this region are fore-cast to expand to just under three time those of Japan by 2010, just over four times by 2020, and just under six times by 2030.
What this signifies is that dependence on Middle Eastern oil will quan-titatively further increase. Oil imports from the Middle East quanquan-titatively doubled from 1985 to 2004, and it is possible that they will further double between the current time and 2030. To the extent that dependence on the Middle East increases, the occurrence of any emergency situation in that region that obstructs the supply of oil will have a grave impact.
Figure 4.4. Rapid, Long-term Expansion of Extra-regional Oil Imports by Asia 1965 1970 1975 1980 1985 1990 1995 2000 2005 2010 2015 2020 2025 2030 35 30 25 20 15 10 5 0 -5 (Million barrels/day)
Source: Prepared based on data from BP, Statistical Review of World Energy, 2005, and IEA, World Energy Outlook, 2004.
2.0 4.5 15.1 18.7 26.5 33.4 South Asia East Asia China Japan/South Korea
High Oil Prices and the Asian Economy: The Impact of Skyrocketing Oil Prices on Asia | 41
Having experienced two oil shocks in the 1970s and prepared an emergency system including oil stocks, it was possible to respond rela-tively calmly to the Gulf crisis in 1990 and the Iraq War in 2003. As a result of that, however, an increasing number of people lack clear aware-ness of the oil crisis, and so there is concern that people may panic if an emergency situation were to occur across Asia.
Issues to Be Overcome by Asia
Through 2004 and 2005, oil prices soared and remained high, but this is not related to the problem of exhaustion of oil resources. There is no need to aim excessively for independence from oil, which is not economically feasible. It is enough if oil resources are used rationally, by employing the right resources in the right places.
Judging from the weakening of the supply cushion due to delayed long-term investment and the oil market’s overreaction due to increased speculative deals in the futures market, it is difficult to avoid wild fluctua-tions and to ensure stabilization of oil prices. To deal with these kinds of changes in the supply and demand structure, it is necessary for Asia to boost its strength and flexibility as a consumer region while overcoming the issues stated below.
(1) Development of the oil market: It is necessary to build international oil markets that represent consumer regions, such as Rotterdam in Europe and the Gulf Coast in the United States, and to transmit price information to inform competition among energies in the consumer region.
(2) Flexibility to switch fuels in consumer regions: It is necessary to have the capacity in the consumer regions to mix different types of energies such as oil, coal, and gas and to easily switch among them. For instance, a gasifier plant may be considered as one option.
(3) Construction of emergency oil stocks and a coordinated utilization system: It is necessary for Asian countries to build their own emer-gency oil stocks corresponding to their economic level and to con-struct a system for coordination in the event that the stocks are uti-lized.
(4) Preparation of oil stocks at the consumer level: Since it is unlikely that oil companies will increase stocks because it is costly, if violent oil price fluctuations become unavoidable, then consumers need to pre-pare stocks to deal with violent price fluctuations.
(5) Development of oil and gas resources in the former Soviet Union and preparation of a supply network: As a source other than the Middle East for oil and gas, it is necessary to put effort into development of oil and gas resources in the former Soviet Union and to prepare a supply network such as a pipeline to Asia.
(6) Development of technology for effective usage of coal available in the region: To effectively utilize coal, which is a promising resource avail-able in Asia, it is necessary to promote development of clean coal tech-nology which is earth friendly.
(7) Development and spread of energy conservation and environmental conservation technology: So as to ensure the environmental integrity of energy usage and to not needlessly expand energy demand, it is nec-essary to ensure the spread to developing countries of energy-saving technology and environmental conservation technology.
(8) Development of renewable energy and new energy: It is necessary to develop nonfossil, renewable energies, etc., that are sufficiently com-petitive and have the supply capacity to compete with fossil fuels. Heretofore, energy demand was considered to be fixed and the empha-sis has been on ensuring diversity and stability of energy acquired from outside the country or the region. In the future, it will be important to change our way of thinking and to increase the strength and flexibility of the consumer regions. The global oil supply-demand structure is entering a new phase, and based on that, there are multiple issues that need to be tackled in the twenty-first century.