Formal registration and informal firms in
Cambodia
著者
Tanaka Kiyoyasu
権利
Copyrights 2021 by author(s)
journal or
publication title
IDE Discussion Paper
volume
807
year
2021-02
INSTITUTE OF DEVELOPING ECONOMIES
IDE Discussion Papers are preliminary materials circulated to stimulate discussions and critical comments
Keywords: Informal sector, formalization, registration, Cambodia JEL classification: O12, O17, D22
§ Research fellow, Economic Integration Studies Group, Institute of Developing Economies, JETRO IDE DISCUSSION PAPER No. 807
Formal Registration and Informal Firms in
Cambodia
Kiyoyasu TANAKA
§February 2021
Abstract
This paper estimates the impact of formal registration on firm-level performance. I construct a unique panel dataset on both formally registered and unregistered establishments in Cambodia for 2011 and 2014. The sample includes 8,350 informal firms in 2011, of which 216 firms obtained a formal registration in 2014. To mitigate selection bias, I employ a difference-in-differences method combined with propensity-score matching and a propensity-score-weighted regression method. My results show a significantly positive impact of formalization on sales and value added, but little significant effect on labor productivity. Formalization increases non-wage expenditures significantly, consistent with the hypothesis that formalized firms increase their purchases from other formal firms to benefit from Cambodia’s value added tax system.
The Institute of Developing Economies (IDE) is a semigovernmental, nonpartisan, nonprofit research institute, founded in 1958. The Institute merged with the Japan External Trade Organization (JETRO) on July 1, 1998. The Institute conducts basic and comprehensive studies on economic and related affairs in all developing countries and regions, including Asia, the Middle East, Africa, Latin America, Oceania, and Eastern Europe.
The views expressed in this publication are those of the author(s). Publication does not imply endorsement by the Institute of Developing Economies of any of the views expressed within.
INSTITUTE OF DEVELOPING ECONOMIES (IDE), JETRO 3-2-2, WAKABA,MIHAMA-KU,CHIBA-SHI
CHIBA 261-8545, JAPAN
©2021 by author(s)
No part of this publication may be reproduced without the prior permission of the author(s).
3
Formal Registration and Informal Firms in Cambodia
†Kiyoyasu Tanaka§
(Institute of Developing Economies)
February 2021
Abstract
This paper estimates the impact of formal registration on firm-level performance. I construct a unique panel dataset on both formally registered and unregistered establishments in Cambodia for 2011 and 2014. The sample includes 8,350 informal firms in 2011, of which 216 firms obtained a formal registration in 2014. To mitigate selection bias, I employ a difference-in-differences method combined with propensity-score matching and a propensity-score-weighted regression method. My results show a significantly positive impact of formalization on sales and value added, but little significant effect on labor productivity. Formalization increases non-wage expenditures significantly, consistent with the hypothesis that formalized firms increase their purchases from other formal firms to benefit from Cambodia’s value added tax system.
Keywords: Informal sector, formalization, registration, Cambodia JEL Classification: O12, O17, D22
† I acknowledge the financial support of JSPS Grant-in-Aid for Young Scientists (B) Grant Number
16K17129 and for Scientific Research (A) 18H03637. For data assistance, I thank Fumihiko Nishi and Kim Net. All remaining errors are my own.
§ Research fellow, Institute of Developing Economies, JETRO; address: 3-2-2 Wakaba, Mihama-ku,
4
1. Introduction
A vast number of workers in developing economies find employment opportunities in the informal sector such as self-employment, home businesses, and other small enterprises. Since these informal firms are associated with lower profits, productivity, and wage payments, the formalization of informal firms has important implications for economic development (La Porta and Shleifer, 2014). However, prior work provides mixed evidence for the benefits of formalization on firm performance. Experimental studies provide informal businesses incentives to register with the government and find a relatively small effect of formalization on the performance (de Mel et al., 2013; De Giorgi and Rahman, 2013; Benhassine et al., 2018). Meanwhile, other non-experimental studies tend to find positive effects (McKenzie and Sakho, 2010; Fajnzylber et al., 2011; Rand and Torm, 2012; Demenet et al., 2016; Boly, 2018), whereas McCaig and Nanowski (2019) find no evidence of formalization benefits for household businesses in Vietnam. Thus, there remains an open question of whether formality improves firm performance.
In this paper, I seek to estimate the causal impact of formal registration on informal firms by using previously unexplored panel data in Cambodia. Specifically, I use the Economic Census of Cambodia (ECC) in 2011 for a baseline dataset. The ECC surveys all nonfarm establishments and enterprises over the entire territory of Cambodia, without any establishment-size threshold. For a post period, I use the Inter-censal Economic Survey of Cambodia (ESC) in 2014, which is a nationally representative survey based on a stratified multistage sampling method. Using survey information on registration with the Cambodian Ministry of Commerce, I define formal (informal) firms as establishments with (without) a formal registration. By linking 504,955 establishments in the ECC with 12,178 establishments in the ESC, I construct panel data for 9,022 firms. For my analysis, I focus on a sample of 8,350 informal firms in 2011, of which 216 firms obtained a formal registration in 2014.
To estimate a causal impact of formalization on firm outcomes, I adopt a standard difference-in-differences (DID) method, which measures formalization effects by comparing changes in outcomes for formalized firms during the 2011-2014 period with changes in outcomes for non-formalized firms during the same period. A key issue for identification is that formalized firms may systematically differ from non-formalized firms in various aspects, which may affect both a formalization decision and firm outcomes. To mitigate possible selection bias in the DID estimate of formalization effects, I combine propensity-score matching (PSM) with the DID method (Heckman et al., 1997; Smith and Todd, 2005). Nevertheless, the PSM-DID method still makes it difficult to control for unobserved industry and region shocks and to examine an interactive effect of
5
formalization on other firm characteristics. To address both these issues and selection bias, I also employ a propensity-score-weighted (PSW) regression method (Hirano et al., 2003). My results show that formal registration has a significantly positive impact on sales and value added for informal firms. The PSW results indicate that formalized firms increased their sales by 161% and their value added by 151%. These impacts are significantly smaller for self-employed informal firms. The impact of formalization on profits is significantly positive only for informal firms with more than one worker. I do not find evidence that formalization improves labor productivity across firm types. Additionally, I examine channels through which formalization improves performance by estimating the effect of formalization on intermediate outcomes. Formalization increases non-wage expenditures significantly, which is consistent with the hypothesis that formalized firms increase their purchases from other formal firms to benefit from Cambodia’s value added tax system. Formalization also increases wage payments and the number of regularly employed workers, but has little impact on the number of family workers. This suggests that an increase in wage payments for formal workers is an important source of formalization effects for economic development.
Prior empirical literature uses experimental and observational data to estimate formalization benefits for informal firms. Experimental studies use a sample of firms in large cities in Sri Lanka (de Mel et al., 2013) and Benin (Benhassine et al., 2018). Observational studies use firm-level and household-level surveys in developing economies such as Bolivia, Brazil, and Vietnam (McKenzie and Sakho, 2010; Fajnzylber et al., 2011; Rand and Torm, 2012; Demenet et al., 2016; Boly, 2018; McCaig and Nanowski, 2019). Baseline surveys in these studies are not based on a nationally representative sample frame that covers both formal and informal firms, suggesting that previous results may suffer from sampling bias if surveys contain a biased set of informal firms that became formal in specific regions. In this respect, this paper is the first to exploit a baseline dataset that surveys all nonfarm establishments and enterprises over the entire territory in an economy, which serves as a sample frame for a post-period survey. My comprehensive data allow me to address the sampling issue, thereby providing credible external validity for my results in the case of Cambodia.
The rest of this paper is organized as follows. Section 2 describes the formal registration system in Cambodia, followed by discussing costs and benefits for informal firms to obtain a formal registration. Section 3 explains my empirical strategy to identify the impact of formalization on firm outcomes. Section 4 describes data sources, data construction, and sample characteristics. Section 5 discusses the estimation results. Section 6 concludes.
6
2. Formal registration in Cambodia
This section describes the formal registration system in Cambodia and explains the costs and benefits for informal firms to obtain a formal registration. The Cambodian government established a regulatory framework for commercial enterprises in the “Law Bearing upon Commercial Regulations and the Commercial Register,” which was enacted in 1995 and amended in 1999. This law defines the meaning of commercial enterprises and stipulates the obligation of firms to register, with a description of formal registration procedures. The National Assembly in Cambodia adopted the “Law on Commercial Enterprise” in 2005, which applies to partnerships, private limited companies, public limited companies, and foreign businesses.
To establish a formal enterprise under Cambodian law, firms must register with the Ministry of Commerce or the Provincial Department of Commerce. Specifically, registration procedures require firms to (i) provide the registrar with the specific location of the office and the name of its agent; (ii) deposit a legally required initial capital in a bank and submit evidence of the deposit; (iii) check the uniqueness of the company name at the Intellectual Property Department and the Business Registration Office; and (iv)
publish an abstract of the company organization documents and incorporate the company with the Business Registration Department in the Ministry of Commerce (World Bank, 2014). During the study period, the procedure costs are estimated to require at least 400 USD. The estimated time to complete the registration is at least one month. However, in practice, these registration procedures are typically complex and may require lengthy steps to negotiate with government officials, who may delay an application to seek facilitating payments. To reduce application time and administration costs, firms may need to seek expert advisory services from company registration agents. Taken together, the up-front costs of formal registration include formal registration fees, time costs of registration processes, and administrative costs for government officials.
Formal registration can yield benefits for firms in several ways. First, formal registration enables firm owners to conduct business activities as a legally established enterprise. This legal framework improves the formal management of corporate activities and reduces uncertainty costs in future business planning and potential commercial disputes. Documents on corporate registration are typically necessary to obtain official licenses and business approvals from related government ministries. Administrative and legal validity is a key benefit of the formal registration for commercial operations. Second, the formal registration can reduce possible fines that may be levied during an inspection if the business is not properly registered. Nevertheless, this does not imply that
7
unregistered firms are advantageous in avoiding tax payments. The tax systems for business in Cambodia as of the year 2011 consisted of real and estimated regimes. Specifically, registered firms must pay their tax based on their real income, whereas unregistered firms need to pay taxes based on their estimated income. Because a vast number of unregistered firms do not properly register with the tax authority, tax officials visit individual establishments to calculate taxable income based on their estimated income and receive tax payments at the site.
Third, formal registration enables firm owners to claim tax credits for their purchases from registered suppliers, which generate tax benefits for formally registered firms (de Paula and Scheinkman, 2010). In the case of Cambodia, formally registered firms must register with the General Department of Taxation to obtain the identification number of value added tax (VAT). They must charge VAT on their sales and issue VAT invoices that contain the VAT identification numbers of suppliers and buyers. With proper VAT invoices, registered firms can offset the VAT paid on their purchases against the VAT paid on their sales. However, if suppliers do not have the VAT identification number, registered firms cannot claim tax credits for their purchases from the unregistered suppliers. Thus, the formal registration is a first step for firms to gain tax benefits from business transactions with other registered firms. Consistent with this explanation, McKenzie and Sakho (2010) highlight the VAT benefits of tax registration in Bolivia.
Fourth, formal registration can help firms to gain better access to formal credit (Straub, 2005). Although unregistered businesses do not typically record a precise flow of commercial operations in an accounting book, formally registered firms must have a proper record of their business operations. Accounting records on assets and operations serve as credible documentation for formal lenders to evaluate business risk and repayment rates of loan applications. Financial screening helps formal firms to access long-term capital under reasonable interest rates, thereby supporting the growth of their commercial operations. However, it should be highlighted that formal registration may not be a pre-requisite for access to formal credit in developing economies with a weak legal system. In the case of Cambodia, local legal institutions in business law and the court system typically do not provide adequate protection of lenders’ interests, and thus formal banks typically require collateral for loans. These lenders visit borrowers’ business sites to inspect and register their land and building. Because these assets are generally registered in the names of individual business owners, rather than corporate entities, banks prefer to lend to individuals, rather than corporations (Harner, 2003; Ung and Hay, 2011). For these reasons, formal registration may not substantially improve access to
8
formal credit, as is consistent with the weak evidence of formalization effects on credit access (McKenzie and Sakho, 2010; Rand and Torm, 2012).
In sum, informal firms seeking formal registration must pay registration fees, spend time in the process, and incur administrative costs in registration. Meanwhile, registration allows them to benefit from legal consistency, a lower likelihood of fines, tax credits in the VAT system, and improved access to formal credit. A registration decision should depend on these costs and benefits; i.e., greater benefits would induce informal firms to obtain a formal registration, whereas larger costs would discourage them from registering with the government. However, this analysis of registration decisions does not answer the question of whether informal firms improve their performance after formal registration. It is also unclear which performance measures would change after registration. To address these questions, I proceed to estimate formalization effects on informal firms in Cambodia.
3. Empirical strategy 3.1. Benchmark model
To examine the impact of formalization on firm performance, I specify an empirical model for firm i, industry s, region r, and year t:
𝑌𝑌𝑖𝑖𝑖𝑖 = 𝛽𝛽𝐹𝐹𝐹𝐹𝐹𝐹𝐹𝐹𝐹𝐹𝐹𝐹𝑖𝑖𝑖𝑖+ 𝑓𝑓𝑖𝑖 + 𝑓𝑓𝑠𝑠(𝑖𝑖),𝑖𝑖 + 𝑓𝑓𝑟𝑟(𝑖𝑖),𝑖𝑖+ 𝜀𝜀𝑖𝑖𝑖𝑖 (1) where 𝑌𝑌𝑖𝑖𝑖𝑖 is a measure of business performance for firm i in year t. Outcome variables include sales, value added, gross profits, and labor productivity. Since the sample includes only firms that were initially unregistered in 2011, 𝐹𝐹𝐹𝐹𝐹𝐹𝐹𝐹𝐹𝐹𝐹𝐹𝑖𝑖𝑖𝑖 takes on unity for registered firm i in 2014, and zero otherwise. 𝑓𝑓𝑖𝑖 is a firm-level fixed effect to control for unobserved firm heterogeneity such as owners’ age, sex, ability, and education. Other fixed effects, 𝑓𝑓𝑠𝑠(𝑖𝑖),𝑖𝑖 and 𝑓𝑓𝑟𝑟(𝑖𝑖),𝑖𝑖 , are included to control for unobserved time-varying effects in industry s and region r of firm i, respectively; these include any demand, supply, and technology shocks across industries and regions for any year. Finally, 𝜀𝜀𝑖𝑖𝑖𝑖 is an error term.
The coefficient of interest is 𝛽𝛽 for measuring the causal impact of formalization on outcomes. The identification is based on a standard DID method. Specifically, I exploit two sources of variations in outcomes: (1) a difference in outcomes between formalized and non-formalized firms, and (2) a difference in outcomes between pre- and post- periods. By comparing changes in outcomes for formalized firms during the 2011-2014 period with changes in outcomes for non-formalized firms during the same period, the DID method gives an estimate of the causal impact of formalization. Because firm outcomes depend on a variety of economic factors, a wide range of fixed effects helps to
9
isolate potential confounding factors from the causal impact on firm outcomes. Additionally, the DID method assumes that outcomes for both formalized and non-formalized firms would exhibit parallel trends in the absence of obtaining a formal registration in 2014.
3.2. Propensity-score matching and weighting
A key identification issue in the benchmark model is that registration decisions are not random. Formalized firms may systematically differ from non-formalized firms in various aspects, which may affect both the formalization decision and firm outcomes. Non-random selection can violate the parallel trends assumption, implying that the DID estimate of formalization effects may suffer from selection bias. To address this issue, I combine PSM with the DID method (Heckman et al, 1997; Smith and Todd, 2005). The PSM method computes propensity scores to match formalized firms with similar non-formalized firms based on the closest propensity score.1 Using a matched sample, the DID method compares a change in performance between formalized firms and similar non-formalized firms. With the PSM-DID method, I can balance the distributions of observed characteristics between formalized and non-formalized firms to reduce potential selection bias due to unobserved heterogeneity between treatment and control groups.
To estimate a propensity score for formalization, I specify a logit model in a first stage for firm i and base year 𝑡𝑡0:
𝑃𝑃𝐹𝐹(𝑇𝑇𝑖𝑖 = 1) = 𝑓𝑓�𝑿𝑿′𝑖𝑖,𝑖𝑖0𝜹𝜹+ 𝑑𝑑𝑠𝑠(𝑖𝑖),𝑖𝑖0 + 𝑑𝑑𝑟𝑟(𝑖𝑖),𝑖𝑖0 + 𝑒𝑒𝑖𝑖� (2) where 𝑇𝑇𝑖𝑖 takes on unity if firm i obtains a formal registration in 2014, and zero otherwise. 𝑿𝑿𝑖𝑖,𝑖𝑖0 is a vector of firm-level characteristics in the base year 𝑡𝑡0 . These include log employment size, business area index, firm age, a dummy variable for female representative, a dummy for proprietorship, and a dummy for rented business place. 𝑑𝑑𝑠𝑠(𝑖𝑖),𝑖𝑖0 is a vector of base-year variables on industry-level characteristics for firm i, including the share of formal firms’ employment in aggregate industry employment and dummy variables for major industrial sectors such as manufacturing, wholesale/retail, accommodation/restaurant, and education. 𝑑𝑑𝑟𝑟(𝑖𝑖),𝑖𝑖0 is a dummy variable that takes on unity if firm i operates in Phnom Penh, the capital province of Cambodia, during a base year. Using the estimated propensity scores from equation (2), I match each firm to a single firm with the opposite treatment whose propensity score is closest. Taking the average of the difference between observed and counterfactual outcome changes for each firm, I compute an average treatment effect of formalization on the treated.
1 There are alternative matching methods, and (dis)advantages over alternative methods are discussed
10
A PSM-DID method provides a useful solution to address selection bias in a formalization decision, but it is subject to at least two issues for my analysis. First, it is difficult to control for time-varying industry and regional effects. The local average treatment effect based on the PSM-DID method may contain unobserved time-varying shocks across industries and regions. Second, formalization effects may depend on other firm characteristics such as self-employment. The average treatment effect may mask an important interactive effect of formalization on other firm characteristics.
An alternative approach to address both selection bias and these issues is to use a PSW regression method (Hirano et al., 2003). In the first stage, I estimate the logit model in equation (2) to compute a propensity score for firm i. The inverse of propensity scores is used to construct weights for formalized and non-formalized firms in common support. By applying more weight to firms with a higher propensity score, the PSW method achieves a balance in covariates between formalized and non-formalized firms in a regression framework of equation (1). However, estimation results may be sensitive to some observations with extremely large (small) weights in the PSW method. I address this issue by excluding observations with the top and bottom 5% of estimated propensity scores in the distribution. In addition, the regression framework allows me to control for time-varying industry and regional effects in the PSW estimation and compute an interaction effect of formalization.
Finally, I highlight that a propensity-score method estimates a causal impact of formalization effects under assumptions, as shown in Rosenbaum and Rubin (1983). The first assumption is conditional independence that potential outcomes are independent of treatment assignment, conditional on observable pre-treatment covariates. In my setting, this suggests that firm outcomes are independent of formalization decisions, conditional on observed firm characteristics during a pre-formalization period. In practice, there may exist unobserved time-varying firm characteristics that affect the formalization decision and outcomes simultaneously, which would cause a bias in estimated formalization effects in an unknown direction and magnitude (McCaig and Nanowski, 2019). The second assumption is the presence of common support. This implies sufficient overlap of the distribution of propensity scores between formalized and non-formalized firms to ensure a match for formalized firms.
4. Data description 4.1. Data sources
My main dataset is constructed from the ECC in 2011 and the ESC in 2014. These surveys were funded by Japanese official development assistance and implemented by
11
the National Institute of Statistics (NIS) in the Cambodian Ministry of Planning. The main purpose of the ECC is to survey economic activities of all nonfarm establishments and enterprises over the entire territory of Cambodia.2 The survey defines an establishment as a unit of economic entity managed by a single ownership in a single physical location with some durable facilities. The survey covers all the establishments and enterprises, including the street vendors that operate at a fixed location but can move.3 Census enumerators visited each establishment to interview its representative and/or owner and fill out a questionnaire through an in-person meeting. The NIS collected all the questionnaires for data input and made two data files separately by two data-input operators, which are examined for data consistency.
The ESC is a nationally representative survey based on a stratified multistage sampling method. In the first step, all establishments with 50 persons or more are selected. The sample includes 1,619 establishments and approximately 508,000 workers, accounting for 0.32% of the total number of establishments and 30.3% of the total number of workers in the ECC. In the second step, a stratified multistage sampling method is used to select small and micro-scale establishment samples. Specifically, enumeration areas (EAs) in the ECC are stratified into three strata according to industrial characteristics. In total, 30 EAs are selected from the 6 largest provinces, and 20 EAs are selected from the 18 other provinces. These sample EAs are allocated to the three strata proportionately in terms of the number of EAs in each province, such that 540 EAs are selected and account for around 3% of all the EAs in Cambodia. Up to 30 establishments are selected from each EA.
These surveys ask each establishment about whether they register with the Ministry of Commerce or the Provincial Department of Commerce. Because the questionnaires explicitly indicate that “the form is strictly confidential and used only for the statistical purposes and not used for taxation,” the surveys address a concern that some respondents may refuse to answer or falsely report if they are concerned that their information is used for taxation. Additionally, the registration status does not directly determine tax payments in Cambodia, implying little tax incentives to report a false claim on registration status. Thus, I define formal firms as the establishments that have a formal registration. Informal firms are the establishments that have no formal registration.
2
In a preparation stage for the ECC in 2011, the NIS conducted the establishment listing in Phnom Penh for 2006, the establishment survey in Phnom Penh for 2007, and the nation-wide establishment listing in 2009.
3 The survey does not cover the establishments classified into the following categories: (1) agriculture,
forestry, and fishing, (2) public administration and defense, (3) activities of households as employers, (4) activities of extraterritorial organizations and bodies, and (5) mobile establishments such as a bike taxi and a street peddler.
12
4.2. Panel data construction
Using these datasets, I construct panel data at the establishment-level; the number of establishments is 504,955 in the ECC and 12,178 in the ESC. First, the ECC includes the serial number of each establishment in a village or enumeration area. I use the geographic information and the serial number to generate a unique identification number for every establishment in 2011. I use similar establishment information in the ESC to generate a unique identification number for every establishment in 2014. In principle, survey enumerators for the ESC must assign the same serial number for the same establishments listed in the ECC and assign the new serial number for new establishments in the EAs after 2011. Thus, I can use the same serial number to link individual establishments in the same EAs between 2011 and 2014.
However, the serial number may be subject to survey errors such as reporting mistakes. I exclude matched sample establishments with a large difference between 2011 and 2014 in terms of the following variables: a change in a 1-digit industry code; more than 10 years difference in years of starting business; and possible outliers in employment growth rates as defined by the bottom and top 1% of distribution. Removing these establishments reduces the risk of linking different establishments incorrectly across years. Additionally, the ESC does not track establishments based on contact information, implying that the 2014 survey should remove the establishments that had relocated across EAs or shut down after 2011. Because contact information in the ESC is not available for public access, it is not possible to track relocating establishments.
Another issue is that linking establishments with the serial number leaves a large number of unmatched establishments in the ESC, even after accounting for the new entrants that did not exist in the ECC. In particular, a large number of micro establishments are unmatched, which may lead to sample selection bias in the analysis. A plausible reason is that survey enumerators visited establishments listed in the ECC, but did not assign the same serial number in practice. If they assigned incorrect serial numbers, I might mistakenly classify these establishments as unmatched. To address this issue, I use a record linkage method to match observations between two datasets where no perfect key fields exist (Herzog et al., 2007). Using the Stata program, reclink, I calculate a matching score for observations based on establishment characteristics such as survey areas, legal status, representative gender, and business information. I use the matching score to link previously unmatched establishments in the ECC and ESC. Finally, I remove observations from the sample that are likely incorrectly matched, based on criteria of extremely large sales growth and other deviations across years.
13 4.3. Sample characteristics
Table 1 shows a transition matrix of sample firms between formal and informal status during the period 2011 and 2014.4 Among 9,022 firms, the number of formal and informal firms is 672 and 8,350 in 2011, respectively. Among 8,350 informal firms in 2011, 216 firms became formal in 2014. While the vast majority of informal firms remained informal, only a small number of informal firms became formal. From the total number of sample firms, 90.2% of informal firms remained informal and 2.4% of informal firms became formal. Meanwhile, 5.2% of formal firms remained formal and 2.3% of formal firms became informal.
---Table 1 here---
By way of comparison, I discuss similar panel data in prior studies, which have a slightly different formality definition and sample coverage. Rand and Torm (2012) used a survey on Vietnamese manufacturing firms, which includes 1,366 formal and informal firms in the sample. In their sample, 10.3% of informal firms became formal and 48.5% of informal firms remained informal during the sample period. Meanwhile, Demenet et al. (2016) used a survey on Vietnamese firms in the urban area, which includes 1,983 firms in the sample. Their sample shows that 7.4% of informal firms became formal and 66.4% of informal firms remained informal. As compared with these surveys, my sample has a significantly larger number of firms and a smaller share of formalized (initially informal) firms. These differences suggest that the prior surveys may include a disproportionately greater share of successful informal businesses because they tend to register with the government. In this respect, my survey data should reduce the likelihood of oversampling formalized firms and over-estimating formalization effects due to the oversampling of successful formalized firms
Key outcome variables include sales, value added, profits, and labor productivity. Value added is measured by sales minus intermediate input. Sales include all income gains from operating activities such as selling goods and providing services. Intermediate input is computed from expenses minus wages because data on expenses include every expense being paid for operating activities such as the purchase of materials for sale, instruments for providing services, rent, and employees’ salaries and wages. Profits are computed as value added minus wage payments to capture entrepreneurial profits. Labor productivity is value added per worker. These variables are defined as a natural logarithm of nominal USD values for one month in February 2011 or 2014.
14
Table 2 presents the summary statistics of outcome variables for initially informal firms in 2011 and 2014. First, formalized firms show higher values in these outcomes than non-formalized firms do in 2011. Because informal businesses with better performance were likely to register with the government, it is crucial to control for selection bias in estimating formalization effects. Second, both formalized and non-formalized firms show higher values in these outcomes in 2014. These figures imply that formalization can improve informal firms’ performance after formal registration. However, it is also important to disentangle confounding factors from the causal impact of formalization on these outcomes.
---Table 2 here--- 5. Estimation results
5.1. DID estimation
Table 3 presents the results of my benchmark model by DID estimation. I report clustered standard errors at the firm level. In column (1), the coefficient 𝛽𝛽 is significant and positive, implying that formalized firms increased their sales by 245%.5 Column (2) shows that value added increased significantly by 245%, and column (3) suggests that profits increased by 139%. In column (4) for labor productivity, the coefficient 𝛽𝛽 is positive, but not significant. Thus, the benchmark results imply that formalization effects are significantly positive for outcomes such as sales, value added, and profits. There is no significant impact of formalization on labor productivity. However, the DID results must be carefully interpreted because the estimate of positive formalization effects may capture selection bias in which informal businesses with better performance choose to obtain a formal registration.
---Table 3 here---
5.2. Propensity-score matching estimation
I proceed to address a self-selection issue in this section. Table 4 presents the first-stage logit estimation of a formalization decision for initially informal firms.6 While my primary objective is to achieve a balance in covariates between formalized and non-formalized firms, the results show key characteristics of the formalization decision. Specifically, formalized firms are more likely than non-formalized firms to be larger in employment and business area, younger in firm age, managed by a male representative, and operated under proprietorship. They also tend to employ a smaller share of family workers and use a rented place for business. In terms of industry characteristics,
5 The following marginal effects of formalization is computed as 100 × �exp�𝛽𝛽̂� − 1�. 6 Appendix Table 2 presents the summary statistics of the sample for logit estimation.
15
formalized firms tend to belong to industries with a higher share of formal-sector employment. Although the results show no significant difference across industrial sectors, they tend to be located in Phnom Penh, the capital of Cambodia.
---Table 4 here---
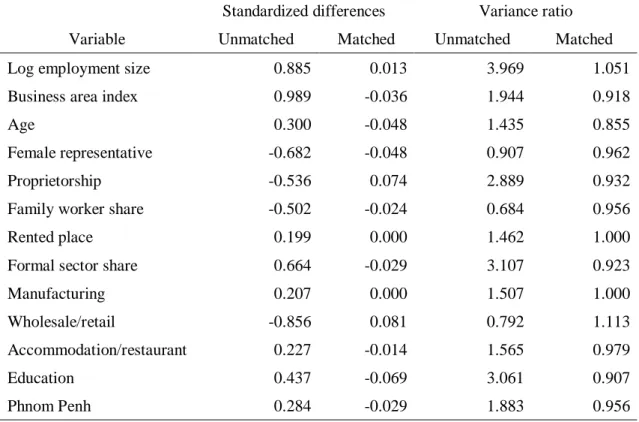
The first-stage logit estimation gives propensity scores to match each firm to a single firm with the opposite treatment whose propensity score is closest. Table 5 shows that propensity-score matching significantly improves the balancing in observed baseline covariates between formalized and non-formalized firms. Specifically, matching substantially reduces the standardized differences in the covariates between formalized and non-formalized firms, with their values being sufficiently close to zero (Austin, 2009). Table 5 also reports variance ratios in unmatched and matched samples. As compared with the unmatched sample, the matched sample shows that the variance ratios in all the covariates become closer to one. Thus, matching also improves balancing in the variances of baseline covariates between formalized and non-formalized firms.7
---Table 5 here---
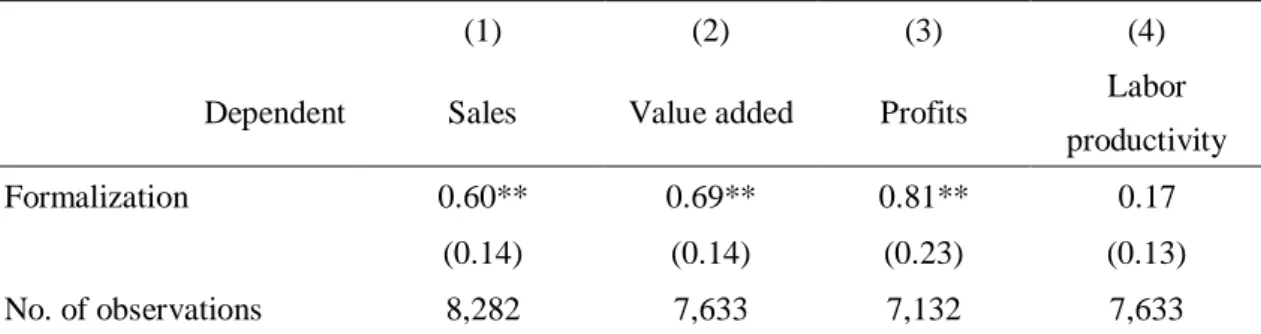
Table 6 presents the results of formalization effects by PSM-DID estimation. Column (1) shows that the coefficient 𝛽𝛽 is significant and positive, implying that formalized firms increased their sales by 82.2%. In column (2), the coefficient 𝛽𝛽 is also significant and positive, implying that formalized firms increased their value added by 99%. Column (3) shows a significantly positive coefficient for profits, implying that formalization increases entrepreneurial profits by 125%. Additionally, there is no significant impact of formalization on labor productivity. These results are qualitatively consistent with the benchmark results. A key difference is that the estimated formalization impacts are much smaller in the PSM-DID estimation. Because the benchmark model does not explicitly control for different distributions of observed baseline covariates between formalized and non-formalized firms, selection decisions might generate an upward bias for formalization effects in the benchmark model.
---Table 6 here---
5.3. Propensity-score-weighted estimation
Table 7 shows the results by a PSW method, which controls for not only selection bias, but unobserved time-varying shocks across industries and regions. Consistent with the previous results, columns (1) and (2) show that the coefficient 𝛽𝛽 is significant and positive for both sales and value added. Specifically, formalized firms increased their
7 Imai et al. (2008) argue that it is incorrect to use hypothesis tests for checking balance because the
16
sales by 161% and their value added by 151%. As compared with the estimated effects in a PSM-DID method, the PSW method yields larger estimated impacts on sales and value added, suggesting that unobserved time-varying effects across industries and regions might produce a downward bias in the PSM-DID results. Meanwhile, the estimated effects in the PSW method are smaller in magnitude than those in a DID method, consistent with the PSM-DID results. In addition, columns (3) and (4) show that the coefficient 𝛽𝛽 is not significant for profits and labor productivity.
---Table 7 here---
The PSW estimation suggests that formalized firms increased their sales and value added significantly. Their profits and labor productivity did not change significantly when compared with similar non-formalized firms. An important question is whether this finding is sensitive to data construction and formality definition. A first concern is that some establishments may be incorrectly linked in panel data construction and thus drive the above results. To check this issue, I exclude the observations in the bottom 5% of match scores, which may lead to false matches. Panel A of Appendix Table 3 shows the PSW results. I find that the coefficient 𝛽𝛽 is significant and positive for sales and value added, but not significant for profits and labor productivity. Thus, the main results are robust to potentially false matches in panel data construction.
A second concern is that the finding may be sensitive to the formality definition. While formal registration with the Ministry of Commerce is an objective criterion to define formalized firms, an alternative definition may better capture a formalization process in the informal sector. Specifically, some firms may not register with the Ministry of Commerce, but obtain an official license and/or approval from other ministries and agencies. Because these firms may also represent formalized firms, the formality definition can include formal registration and/or official license. Using this definition of formality, I report the PSW results in Panel B of Appendix Table 3. I find that the coefficient 𝛽𝛽 is significant and positive for sales and value added, but not significant for profits and labor productivity. Thus, the main results are also robust to the alternative definition of formalization.
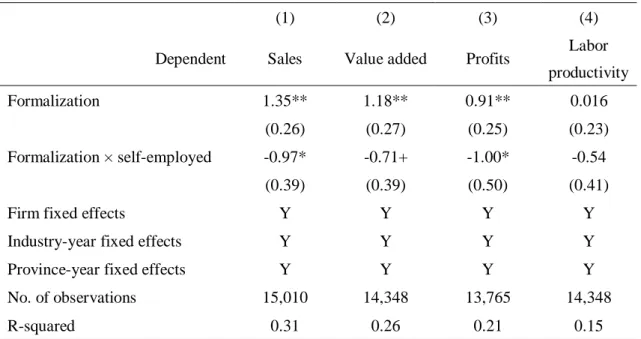
Discussions up to this point have focused on average formalization effects. Formalization effects can be heterogeneous across formalizing firms because informal firms and workers are heterogeneous in many respects such as the degree of informality (Mazumbar, 1976). For instance, self-employed workers run their subsistence small businesses and formal registration may have a smaller impact on their performance than on that of larger informal firms. To examine this heterogeneity, Table 8 presents the results of the benchmark model including an interaction term between 𝐹𝐹𝐹𝐹𝐹𝐹𝐹𝐹𝐹𝐹𝐹𝐹𝑖𝑖𝑖𝑖 and a dummy
17
for initially self-employed ownership. In column (1), the coefficient 𝛽𝛽 is significant and positive whereas the coefficient of the interaction term is significant and negative. This suggests that the positive impact of formalization on sales is significantly smaller for self-employed firms. Columns (2) and (3) also show that the positive impact of formalization on sales and profits is significantly smaller for self-employed firms. In column (4), the coefficients are not significant for both 𝐹𝐹𝐹𝐹𝐹𝐹𝐹𝐹𝐹𝐹𝐹𝐹𝑖𝑖𝑖𝑖 and the interaction term, implying that formalization does not improve labor productivity across firm types.
---Table 8 here---
5.4. Formalization effects on intermediate outcomes
The previous results show formalization effects on outcomes, but shed little light on possible channels through which formalization affects outcomes. To address this issue, this section examines the effect of formalization on intermediate outcomes. Specifically, I re-estimate the benchmark model using a PSW method for the following dependent variables: the log of non-wage expenditures, wage payments in nominal USD values, an index of business area,8 working days during one month, total workers, regularly employed workers, and unpaid family workers.
Table 9 presents the results for intermediate outcomes. Column (1) shows that the coefficient of formalization is significant and positive for non-wage expenditures, including intermediate inputs and tax payments. Formalization increases the non-wage expenditure by 263%. This result is consistent with the hypothesis that formalized firms pay more on their purchases from other formally registered suppliers and benefit from Cambodia’s VAT system. In column (2), the coefficient is significant and positive, suggesting that formalization increases wage payments by 860 USD. Wage payments for workers should be a crucial source of larger value added after formalization. Additionally, column (3) shows that the coefficient is significant and positive for the business area index, implying that formalized firms significantly expand the area of their business place. Given that the size of a business place can be a proxy for capital stock, formalization could be associated with an increase in capital input. In column (4), the coefficient is significant and positive for working days. Although formalized firms operate longer, the estimated coefficient implies an increase of only 0.8 days.
---Table 9 here---
In column (5), the coefficient is significant and positive, suggesting that formalized
8 The area of business place in square meters is classified into nine groups as follows; (1) under 5m2,
(2) 5m2 to 10m2, (3) 10m2 to 30m2, (4) 30m2 to 50m2, (5) 50m2 to 100m2, (6) 100m2 to 200m2, (7)
18
firms increase their total number of workers by 8.3 persons. To examine a composition of the employment growth, I examine the effect of formalization on regular and family workers in columns (6) and (7), respectively. The results show that the coefficient is significant and positive only for regular workers, implying that an increase in regularly employed workers is a key source of the employment growth. Consistent with the finding in Rand and Torm (2012), formalization is associated positively with formal employment.
6. Conclusion
Informality is pervasive in developing economies, and the formalization of informal businesses is a crucial policy issue for economic development. This paper sheds light on formalization benefits by using a unique panel dataset in Cambodia. My baseline dataset covers all nonfarm establishments and enterprises over the entire territory of Cambodia, without any establishment-size threshold. A post-period survey is nationally representative based on a stratified multistage sampling method. After constructing panel data for 9,022 firms, I examine a sample of 8,350 informal firms in 2011, out of which 216 firms obtained a formal registration in 2014. My empirical strategy is to adopt a standard DID method as a benchmark model and address econometric issues such as selection bias by using propensity-score matching and propensity-score-weighted regression methods.
My results show that formal registration has a significantly positive impact on sales and value added for informal firms, with significantly smaller impacts for self-employed informal firms. Although formalization has a significantly positive impact on informal firms with more than one worker, I do not find evidence that formalization improves labor productivity. Formalization also increases non-wage expenditures significantly, which supports the hypothesis that formalized firms increase their purchases from other formal firms to benefit from Cambodia’s VAT system. Formalization also increases wage payments and the number of regularly employed workers, suggesting that positive impacts on formal workers are an important source of formalization effects for economic development.
My analysis highlights that only a small number of informal firms become formal in Cambodia, but formal registration has a large positive impact on the performance of formalized firms. A likely channel is that formalized firms can benefit from the VAT system when they participate in supply chains with other formal firms. The reason is that formal registration is a prerequisite to obtain a tax identification number, which is used to claim tax credits. These results are generally consistent with the existing non-experimental studies, but are in stark contrast with previous non-experimental evidence
19
showing small formalization effects. A plausible explanation is that formal registration alone could have no direct benefit for firm performance because formalized firms obtain a formal registration and increase their business operations with other formal firms at the same time. Given that self-registration is a key signal for the high growth of informal firms, supporting informal businesses that self-select to register would be more beneficial for policy instruments than simply enforcing informal businesses to register with the government.
20
References
Austin, P. C. 2009. Balance diagnostics for comparing the distribution of baseline covariates between treatment groups in propensity-score matched samples. Statistics in Medicine, 28(25). 3087-3107. Benhassine, N., McKenzie, D., Pouliquen, V., Santini, M. 2018. Does inducing informal firms to formalize make sense? experimental evidence from Benin. Journal of Public Economics, 157, 1-14.
Boly, A. 2018. On the short- and medium-term effects of formalisation: panel evidence from Vietnam.
Journal of Development Studies, 54(4), 641-656.
Caliendo, M., Kopeinig, S. 2008. Some practical guidance for the implementation of propensity score matching. Journal of Economic Survey, 22(1), 31-72.
Demenet, A., Razafindrakoto, M., Roubaud, F. 2016. Do informal businesses gain from registration and how? Panel data evidence from Vietnam. World Development, 84, 326-341.
De Giorgi, G., Rahman, A. 2013. SME’s registration: evidence from an RCT in Bangladesh.
Economics Letters, 120(3), 573-578.
de Mel, S., McKenzie, D., Woodruff, C. 2013. The demand for, and consequences of, formalization among informal firms in Sri Lanka. American Economic Journal: Applied Economics, 5(2), 122-150.
de Paula, Á., Scheinkman, J. A. 2010. Value-added taxes, chain effects, and informality. American
Economic Journal: Macroeconomics, 2 (4), 195-221.
Fajnzylber, P., Maloney, W. F., Montes-Rojas, G. V. 2011. Does formality improve micro-firm performance? Evidence from the Brazilian SIMPLES program. Journal of Development
Economics, 94(2), 262-276,
Harner, S. M. 2003. Financing SMEs in Cambodia: why do banks find it so difficult? Private Sector Discussions No. 14, Mekong Project Development Facility.
Heckman, J., Ichimura, H., Todd, P. 1997. Matching as an econometric evaluation estimator: evidence from evaluating a job training programme. Review of Economic Studies, 64(4), 605-654. Herzog, T. N., Scheuren, F. J., Winkler, W. E. 2007. Data Quality and Record Linkage Techniques.
New York: Springer.
Hirano, K., Imbens, G., Ridder, G. 2003. Efficient estimation of average treatment effects using the estimated propensity score. Econometrica, 71(4), 1161-1189.
Imai, K., King, G., Stuart, E. A. 2008. Misunderstandings between experimentalists and observationalists about causal inference. Journal of the Royal statistical Society, Series A
(Statistics in Society), 171(2), 481-502.
Khandker, S. R., Koolwal, G. B., Samad, H. A. 2010. Handbook on Impact Evaluation: Quantitative
Methods and Practices. Washington, D.C.: The World Bank.
La Porta, R., and Shleifer, A. 2014. Informality and development. Journal of Economic Perspectives, 28(3), 109-126.
Mazumbar, D. 1976. The urban informal sector. World Development, 4(8), 655-679.
McCaig, B. Nanowski, J. 2019. Business formalisation in Vietnam. Journal of Development Studies, 55(5), 805-821.
McKenzie, D., Sakho, Y. S. 2010. Does it pay firms to register for taxes? The impact of formality on firm profitability. Journal of Development Economics, 91(1), 15-24.
Rand, J., Torm, N. 2012. The benefits of formalization: evidence from Vietnamese manufacturing SMEs. World Development, 40(5), 983-998.
Rosenbaum, P. R., Rubin, D. B. 1983. The central role of the propensity score in observational studies for causal effects. Biometrika, 70(1), 41-55.
Smith, J. A., Todd, P. 2005. Does matching overcome Lalonde’s critique of nonexperimental estimators? Journal of Econometrics, 125(1-2), 305-353.
Straub, S. 2005. Informal sector: The credit market channel. Journal of Development Economics, 78(2), 299-321.
Ung, L., Hay, S. 2011. SMEs access to finance in Cambodia. In: Harvie, C., Oum, S., Narjoko, D. (Eds.), Small and Medium Enterprises (SMEs) Access to Finance in Selected East Asian
Economies. (pp. 83-116). Jakarta: ERIA.
21
22 Table 1. Sample characteristics
Year 2014
Informal Formal Total
Year 2011 Informal 8,134 216 8,350 (90.2) (2.4) Formal 205 467 672 (2.3) (5.2) Total 8,339 683 9,022
Notes: Figures show the number of establishments; parentheses show the percent share of
total sample firms; Formal is defined as establishments that register with the Ministry of Commerce.
Source: Author's calculation using Economic Census of Cambodia in 2011 and Inter-censal Economic Survey of Cambodia in 2014
23 Table 2. Descriptive statistics on outcome variables
Formalized Firms Non-formalized Firms
Variable 2011 2014 2011 2014
Log sales 7.31 8.33 5.94 6.33
(1.86) (1.95) (1.30) (1.35) [188] [187] [8,108] [8,116]
Log value added 6.64 7.62 4.69 5.08
(2.13) (1.99) (1.46) (1.50) [174] [172] [7,649] [7,907] Log profits 5.97 6.65 4.49 4.87 (1.85) (1.86) (1.24) (1.27) [140] [139] [7,257] [7,551] Labor productivity 4.53 4.99 4.02 4.33 (1.06) (1.10) (1.15) (1.20) [174] [172] [7,649] [7,907]
Notes: Figures show the mean of corresponding variables, with parentheses for the standard
deviation and brackets for the number of observations; Formality is defined as establishments that registered with the Ministry of Commerce; sales, value added, and profits are measured in USD during February 2011/2014.
24 Table 3. DID estimation of formalization effects
(1) (2) (3) (4)
Dependent Sales Value added Profits Labor productivity Formalization 1.24* 1.24* 0.87* 0.022
(0.50) (0.55) (0.37) (0.32)
Firm fixed effects Y Y Y Y
Industry-year fixed effects Y Y Y Y
Province-year fixed effects Y Y Y Y
No. of observations 16,599 15,902 15,087 15,902
R-squared 0.12 0.094 0.096 0.098
Notes: Dependent variables are defined as the log of the corresponding variables; parentheses
show standard errors that are clustered at the firm-level; each observation is weighted by sampling weights in the Inter-censal Economic Survey of Cambodia in 2014; **, *, and + indicate significance at the 1%, 5%, and 10% levels, respectively.
25 Table 4. First-stage logit estimation of formalization Dependent: dummy for formalizing firms
(1)
Variable Coef. Std. Err.
Log employment size 0.31** (0.076)
Business area index 0.36** (0.059)
Age -0.020+ (0.011)
Female representative -0.70** (0.18)
Proprietorship 1.23** (0.39)
Family worker share -1.05** (0.33)
Rented place 0.52** (0.19)
Formal sector share 2.22** (0.38)
Manufacturing -0.17 (0.28) Wholesale/retail -0.29 (0.28) Accommodation/restaurant 0.43 (0.30) Education -0.27 (0.32) Phnom Penh 0.42* (0.20) Constant -6.24** (0.55) No. of observations 8,350 Pseudo R-squared 0.25
Notes: Parentheses show robust standard errors; all explanatory variables are measured using
a base year of 2011; **, *, and + indicate significance at the 1%, 5%, and 10% levels, respectively.
26
Table 5. Balancing between treatment and control groups
Standardized differences Variance ratio Variable Unmatched Matched Unmatched Matched Log employment size 0.885 0.013 3.969 1.051 Business area index 0.989 -0.036 1.944 0.918
Age 0.300 -0.048 1.435 0.855
Female representative -0.682 -0.048 0.907 0.962 Proprietorship -0.536 0.074 2.889 0.932 Family worker share -0.502 -0.024 0.684 0.956
Rented place 0.199 0.000 1.462 1.000
Formal sector share 0.664 -0.029 3.107 0.923
Manufacturing 0.207 0.000 1.507 1.000
Wholesale/retail -0.856 0.081 0.792 1.113 Accommodation/restaurant 0.227 -0.014 1.565 0.979
Education 0.437 -0.069 3.061 0.907
Phnom Penh 0.284 -0.029 1.883 0.956
27
Table 6. PSM-DID estimation of formalization effects
(1) (2) (3) (4)
Dependent Sales Value added Profits Labor productivity Formalization 0.60** 0.69** 0.81** 0.17
(0.14) (0.14) (0.23) (0.13) No. of observations 8,282 7,633 7,132 7,633
Notes: Dependent variables are defined as a change in the log of the corresponding variables
between years 2011 and 2014; parentheses show Abadie-Imbens robust standard errors; **, *, and + indicate significance at the 1%, 5%, and 10% levels, respectively.
28 Table 7. PSW estimation of formalization effects
(1) (2) (3) (4)
Dependent Sales Value added Profits Labor productivity Formalization 0.96** 0.92** 0.45 -0.18
(0.23) (0.23) (0.37) (0.23)
Firm fixed effects Y Y Y Y
Industry-year fixed effects Y Y Y Y
Province-year fixed effects Y Y Y Y
No. of observations 15,010 14,348 13,765 14,348
R-squared 0.29 0.25 0.19 0.14
Notes: Parentheses show standard errors that are clustered at the firm-level; each observation
is weighted by sampling weights in the Inter-censal Economic Survey of Cambodia in 2014; **, *, and + indicate significance at the 1%, 5%, and 10% levels, respectively.
29
Table 8. PSW estimation of heterogeneous formalization effects
(1) (2) (3) (4)
Dependent Sales Value added Profits Labor productivity Formalization 1.35** 1.18** 0.91** 0.016
(0.26) (0.27) (0.25) (0.23) Formalization × self-employed -0.97* -0.71+ -1.00* -0.54
(0.39) (0.39) (0.50) (0.41)
Firm fixed effects Y Y Y Y
Industry-year fixed effects Y Y Y Y
Province-year fixed effects Y Y Y Y
No. of observations 15,010 14,348 13,765 14,348
R-squared 0.31 0.26 0.21 0.15
Notes: Parentheses show standard errors that are clustered at the firm-level; each observation
is weighted by sampling weights in the Inter-censal Economic Survey of Cambodia in 2014; **, *, and + indicate significance at the 1%, 5%, and 10% levels, respectively.
30 Table 9. PSW estimation of intermediate outcomes
(1) (2) (3) (4) (5) (6) (7) Dependent Non-wage expenditure Wage payments Business area Working days Total workers Regular workers Family workers Formalization 1.29** 859.9** 2.26** 0.79** 8.28** 8.12** 0.17 (0.23) (243.5) (0.35) (0.30) (1.77) (1.64) (0.28)
Firm fixed effects Y Y Y Y Y Y Y
Industry-year fixed effects Y Y Y Y Y Y Y
Province-year fixed effects Y Y Y Y Y Y Y
No. of observations 14,711 15,010 15,026 15,006 15,026 15,026 15,026
R-squared 0.31 0.42 0.48 0.13 0.48 0.46 0.21
Mean of dependent variable 5.55 154.3 3.11 26.7 3.17 2.49 1.73
Notes: Parentheses show standard errors that are clustered at the firm-level; each observation is weighted by sampling weights in the Inter-censal
31
Appendix
Appendix Table 1. The Number of establishments by industry
Data
Panel Industry Year 2011 Year 2014
Manufacturing 71,416 1,899 1,208
Electricity, gas, steam and air conditioning supply 4,607 106 48 Water supply; sewerage, waste management 461 41 8
Construction 188 17 6
Wholesale and retail trade 292,350 6,437 5,285
Transportation and storage 1,557 43 21
Accommodation and food service activities 69,662 1,489 1,061 Information and communication 4,711 62 40 Financial and insurance activities 3,584 150 69
Real estate activities 120 4 1
Professional, scientific and technical activities 957 14 3 Administrative and support service activities 6,023 146 70
Education 9,874 726 567
Human health and social work activities 4,885 174 107 Arts, entertainment and recreation 1,780 65 35
Other service activities 32,780 805 493
Total 504,955 12,178 9,022
Notes: Panel indicates the number of establishments that are linked between 2011 and 2014.
Source: Economic Census of Cambodia in 2011 and Inter-censal Economic Survey of Cambodia in 2014
32
Appendix Table 2. Summary statistics of the sample for logit estimation
Variable N Mean Std. Dev. Min Max
Formalization 8,350 0.03 0.16 0 1
Log employment size 8,350 0.71 0.98 0 6.85 Business area (index) 8,350 3.17 2.06 1 9.00
Age 8,350 8.45 8.18 1 33
Female representative 8,350 0.62 0.49 0 1
Proprietorship 8,350 0.92 0.27 0 1
Family worker share 8,350 0.26 0.27 0 0.83
Rented place 8,350 0.13 0.34 0 1
Formal sector share 8,350 0.11 0.16 0.012 0.96
Manufacturing 8,350 0.12 0.32 0 1.00
Wholesale/retail 8,350 0.62 0.49 0 1
Accommodation/restaurant 8,350 0.12 0.32 0 1
Education 8,350 0.06 0.24 0 1
33 Appendix Table 3. Robustness checks
(1) (2) (3) (4)
Dependent Sales Value added Profits Labor productivity Panel A: Match Quality of Panel ID
Formalization 0.34* 0.48* 0.092 -0.22 (0.16) (0.20) (0.41) (0.35)
Controls Y Y Y Y
No. of observations 14,442 13,815 13,238 13,815
R-squared 0.23 0.20 0.18 0.16
Panel B: Alternative Definition of Formality
Formalization 0.79** 0.65** 0.14 -0.26 (0.20) (0.19) (0.41) (0.28)
Controls Y Y Y Y
No. of observations 13,625 13,116 13,078 13,116
R-squared 0.28 0.25 0.21 0.15
Notes: Controls include firm-fixed effects, industry-year fixed effects, and province-year
fixed effects; parentheses show standard errors that are clustered at the firm-level;
formalizing firms in panel B are those that obtained formal registration with the Ministry of Commerce and/or official license from other ministries and agencies in 2014; each
observation is weighted by sampling weights in the Inter-censal Economic Survey of Cambodia in 2014; **, *, and + indicate significance at the 1%, 5%, and 10% levels, respectively.