Disaster Risk Analysis of Highway Bridges from Vulnerability Perspective
Cheng-Hsien HSIEH
Senior Assistant Research Fellow
National Science and Technology Center for Disaster Reduction
9F, 200, Sec. 3, Beisin Rd., Hsindian City 23143, Taipei County, Taiwan (R.O.C.) Fax: +886-2-8912-7766
E-mail: [email protected]
Jau-Lang SU
Associate Research Fellow
National Science and Technology Center for Disaster Reduction
9F, 200, Sec. 3, Beisin Rd., Hsindian City 23143, Taipei County, Taiwan (R.O.C.) Fax: +886-2-8912-7766
E-mail: [email protected] Cheng-Min FENG
Professor
Institute of Traffic and Transportation National Chiao Tung University 4F, 118, Sec. 1, Chunghsiao W. Rd. 10012, Taipei City, Taiwan (R.O.C.) Fax: +886-2-2349-4965
E-mail: [email protected]
Abstract: The flood caused by typhoon Morakot in 2009 resulted in mass fatalities in Taiwan,
prompting demands for improving coping capacities in cases of extreme climate events. The capacity improvement must involve improving awareness as well as determining and relieving socioeconomic and environmental vulnerabilities. Along with resource allocation and pre-evacuation, transportation systems play a crucial role during the disaster response and recovery. In fact, highway bridges significantly impact the accessibility of transportation networks. However, previous literature has focused on the physical vulnerability of bridges from the engineering or disaster-loss assessment perspective. This study thus examines the disaster risk of bridge failure from the vulnerability perspective. Eleven vulnerable factors are generated by impact chain and evaluated via geographic information system. The results reveal that accessibility and redundancy significantly affect vulnerability and risk. The risk maps help decision-makers understand the vulnerability and adopt appropriate strategies for reducing disaster risk.
Key Words: disaster risk, vulnerability, impact chain, geographic information system
1. INTRODUCTION
Along with damage to property, disaster negatively impacts the quality of life, such as threats to life and health, interfering with the rhythm of social life, as well as creating barriers to economic development. Particularly, the interaction between climate and environment changes gradually enhances the magnitude, duration and danger of disasters. The absence of capacity for disaster prevention, mitigation, preparedness and relief results in heightened negative influences on social mechanisms, lives, property and economic development. The Yokohama Strategy from the World Conference on Natural Disaster Reduction held in May 1994 provided guidelines for appropriately shielding human, infrastructure, social operations and economic systems from natural disasters. In recent years, the disaster research has shifted from disaster science to the relationships among disaster, environmental, and socioeconomic systems. In 2004, the International Strategy for Disaster Reduction (UN/ISDR) defined a natural disaster as representing the effect and consequence of natural hazards on vulnerable socioeconomic systems in which vulnerability limits the capability for coping with the influence of the hazard. Additionally, the Hyogo Declaration of the World Conference on
Disaster Reduction, convened in January 2005, reveals the resolution to disaster reduction. Since 1990, numerous substantial natural disasters have occurred due to global climate change including seasonal floods, typhoons, drought, unpredictable earthquakes and environmental degradation. The typhoon Morakot in 2009 resulted in mass fatalities in Taiwan, prompting demands for improving coping capacities in cases of extreme climate events. Improving these capacities must involve awareness as well as the determining and relieving socioeconomic and environmental vulnerabilities. However, the vulnerability influenced by urban sprawl, economic growth and social structure alterations in Taiwan leads to more diverse and complex disasters. In addition to resource deployment and pre-evacuation at the stages of disaster prevention and preparedness, highway systems, especially highway bridges across river, significantly impact emergency relief logistics and network accessibility. For instance, 196 highway bridges failed in typhoon Morakot due to washout, displacement, deformation and inclination of the deck, scouring and debris flow. This causes delays in getting relief to people in isolated areas and remarkably raises the difficulty and costs of rescue.
In fact, the public paid more attention to the failures of provincial highway bridges, such as Hou-Fong Bridge and Shuang-Yuan Bridge with 28,000 annual average daily traffic in passenger car unit (AADT pcu) and 11,000 AADT pcu, respectively, than the failure of remote mountainous bridges. In addition to the structural intensity and scouring of river crossing bridges, disaster loss estimation consists of the number of fatalities and injuries, as well as the effect on life, water facilities and the transportation network. However, past studies have excluded social, economic and environmental factors from engineering disaster impact analyses. Accordingly, this study proposes a prototype model for assessing the disaster risk of highway bridges from the vulnerability perspective to assist planners in identifying the most critical infrastructures and to support decision making for disaster prevention, mitigation and preparedness. The next section defines vulnerability and illustrates vulnerable factors, after which the research approach is described in detail. Section 4 assesses the empirical bridge vulnerability and disaster risk of highway bridges, and Section 5 provides conclusions and future research directions.
2. VULNERABILITY
UN/ISDR (2004) defined vulnerability as the elements involved in making a system susceptible to the damaging impact of a hazard and divided vulnerability into various dimensions including physical, social, economic and environmental factors. Vulnerability thus refers to a negative indicator of system performance during disaster management. A system with higher vulnerability implies it possesses lower resistance to external influences. Besides, vulnerable factors of a system vary due to spatiotemporal and hazard characteristics. Vulnerability encompasses the human related environment possessing economic, social, cultural, educative, political and psychological parts. Birkmann (2007) proposed that the institutive vulnerability to hazards should be considered along with physical, social, economic and environmental factors. Chambers (2006) pointed out that vulnerability exists in systems that have inferior resistance and coping capacities to insecure conditions. In other words, a system is vulnerable when exposed to risks, impacts or pressures from disasters without contingency capability.
Furthermore, numerous researchers have concluded that vulnerability indicates the union of society, sensitivity and resilience (Klein and Nicholls, 1999; Smit and Pilifosova, 2001; Ford and Smit, 2004; O’Brien et al., 2004). Turner II et al (2003) believed global climate and environmental changes make vulnerable areas and vulnerable factors determinations into crucial issues. Not only the exposure and its various effects owing to different hazards, but also the sensitivity and resilience of a system should be considered as part of vulnerability. Adger (2006) defined vulnerability as the state of susceptibility to damage without adaptation because of exposure to negative influences caused by environmental and social change. Therefore, developing robust and reliable methods for measuring risk and vulnerability along with facilitating adaptation and resilience of governance mechanisms are the challenges for vulnerability research.
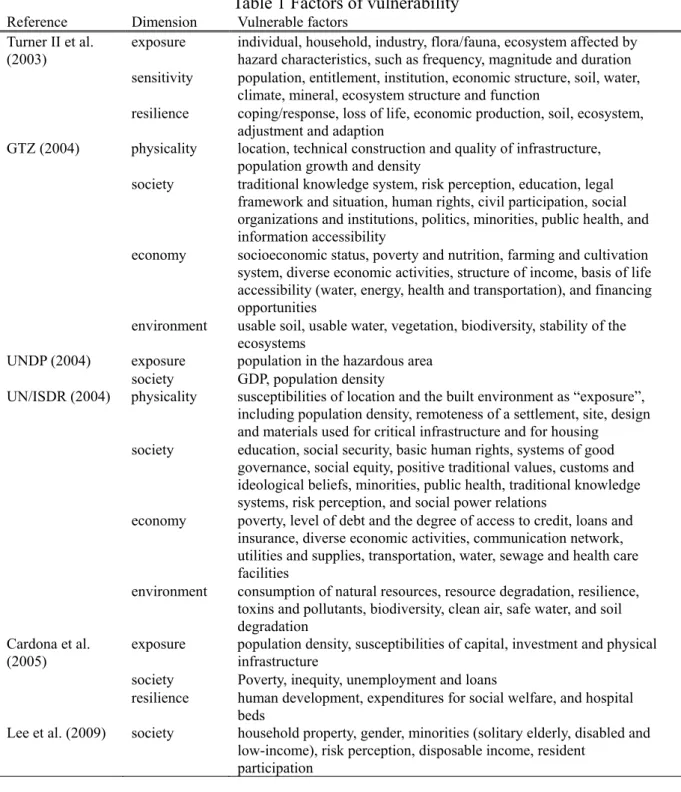
Wisner (2002) suggested that the vulnerability should be measured by individual susceptibility and coping capacity. However, a generalized universal methodology for measuring vulnerability is unavailable due to the complex vulnerable factors that depend on spatiotemporal attributes of hazards composed of social, economic, political and cultural constructs. The potential damage from a threat, including fatalities, health, destruction of assets and degradation of the natural environment, is usually used as an indicator for assessing vulnerability. This brings up the complicated causal relationships between vulnerable factors. Apostolakis and Lemon (2005) utilized interconnected digraphs to identify candidate vulnerable scenarios. To successfully analyze the vulnerability via examining the interdependency between vulnerable factors, Deutsche Gesellschaft für Technische Zusammenarbeit (GTZ, 2004) recommended employing the impact chain which identifies systematic interactions in specific spatiotemporal scopes based on a given hazard scenario. Accordingly, previous literatures applied a set of vulnerable factors to evaluate and illustrate vulnerability. Tobin and Montz (1997) selected age, gender, race and income as the elements of socioeconomic vulnerability. Sutherst et al. (2000) discussed vulnerability from the adaptively coping capacity perspective. In addition, numerous scholars explored the effects of vulnerability on individual, regional and national daily life. Individual vulnerability comprises poverty (Chambers, 2006), employment, individual health (Cutter, 1996; Morrow, 1999), perception of risk, willingness to prevent and mitigate disaster (Messner and Meyer, 2005; Kumpulainen, 2006), and psychological susceptibility (Mulilis and Duval, 1995). Regional vulnerability considers population density, health care systems and economic activities (Cutter et al., 2003). National vulnerability consists of the growth rate of population (Cutter et al., 2003), infrastructure (Schmidt-Thomé, 2005; Cutter et al., 2003), land management and development, and disaster mitigation plans (Schmidt-Thomé, 2005). Table 1 lists the summarized factors of vulnerability.
Table 1 Factors of vulnerability
Reference Dimension Vulnerable factors Turner II et al.
(2003)
exposure individual, household, industry, flora/fauna, ecosystem affected by hazard characteristics, such as frequency, magnitude and duration sensitivity population, entitlement, institution, economic structure, soil, water,
climate, mineral, ecosystem structure and function
resilience coping/response, loss of life, economic production, soil, ecosystem, adjustment and adaption
GTZ (2004) physicality location, technical construction and quality of infrastructure, population growth and density
society traditional knowledge system, risk perception, education, legal framework and situation, human rights, civil participation, social organizations and institutions, politics, minorities, public health, and information accessibility
economy socioeconomic status, poverty and nutrition, farming and cultivation system, diverse economic activities, structure of income, basis of life accessibility (water, energy, health and transportation), and financing opportunities
environment usable soil, usable water, vegetation, biodiversity, stability of the ecosystems
UNDP (2004) exposure population in the hazardous area society GDP, population density
UN/ISDR (2004) physicality susceptibilities of location and the built environment as “exposure”, including population density, remoteness of a settlement, site, design and materials used for critical infrastructure and for housing
society education, social security, basic human rights, systems of good governance, social equity, positive traditional values, customs and ideological beliefs, minorities, public health, traditional knowledge systems, risk perception, and social power relations
economy poverty, level of debt and the degree of access to credit, loans and insurance, diverse economic activities, communication network, utilities and supplies, transportation, water, sewage and health care facilities
environment consumption of natural resources, resource degradation, resilience, toxins and pollutants, biodiversity, clean air, safe water, and soil degradation
Cardona et al. (2005)
exposure population density, susceptibilities of capital, investment and physical infrastructure
society Poverty, inequity, unemployment and loans
resilience human development, expenditures for social welfare, and hospital beds
Lee et al. (2009) society household property, gender, minorities (solitary elderly, disabled and low-income), risk perception, disposable income, resident
participation
3. RESEARCH APPROACH
3.1 Vulnerable factors determination
The interactions among system elements are crucial for understanding and managing system behaviors (Simon, 1996). However, Lee et al. (2007) argued that effectively exploring and controlling system behavior is difficult and costly. To overcome the weakness of traditional techniques, including the inability to explain compounding effects and to handle uncertainty, feedback loops, as well as iterative processes (Nguyen and Ogunlana, 2005), system approaches have been introduced to simulate complex and uncertain behavior of systems via
determining the causal relationships between items (Alberts et al., 2004).
System approaches imply that decision-makers make sense of reality and decide what they should do to forecast a more preferable world in the future (Eden and Ackermann, 2004), to resolve conflicts, establish brainstorming, and assist negotiation (Pidd, 1996). Accordingly, the impact chain exploring disaster influence and causality implies a part of cognitive maps. The impact chain focuses on whether hazard affects vulnerable factors rather than determining the intensity of interconnection between items in the specific system. Remarkably, most system approaches construct affecting factors and a system after identifying the critical output variables, whereas the impact chain develops affected factors after deciding a given hazard scenario (Weidema, 2006).
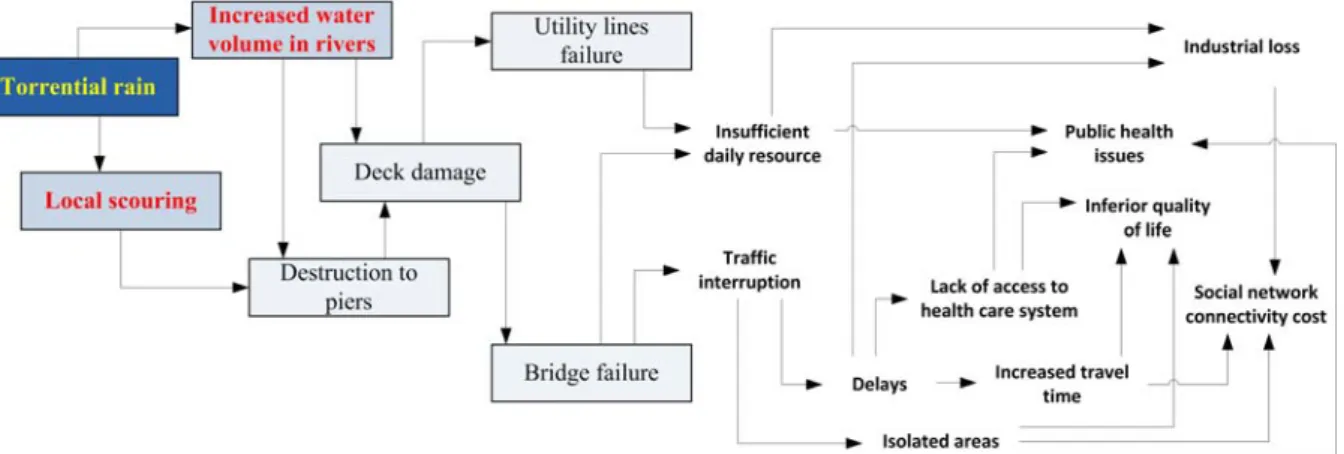
Figure 1 Impact chain for bridge failure
Figure 1 indicates the constructed impact chain for bridge failure via the workshop in which experts on socioeconomic systems, disaster management and transportation participated. Considering the torrential rain scenario, most bridge failures occurred at the peak flow according to practical experience. The increased water volume in rivers and local scouring thus refer to critical factors affecting bridge structure. The damage of a physically vulnerable deck causes bridge failure and leads to interacted impact on socioeconomic vulnerabilities illustrated in the right side of Fig. 1. Notably, the interactions between vulnerable factors may create feedback loops rather than a unidirectional chain. Disregarding feedback loop effects might underestimate system vulnerability.
Alewell and Manderscheid (1998) suggested that the factors for assessing vulnerability should be operable, symbolic and representative. Based on Figure 1, the effect of bridge failure refers to insufficient daily resource, traffic interruption and related issues. This study utilized the four constructs of vulnerability proposed by UN/ISDR (2004) to select vulnerable factors in highway bridge failure representing isolated areas, lack of access to health care system, etc. Following a literature review and an in-depth interview, respondents considered an insignificant correlation between bridge failure and vulnerability in environmental degradation. Previous studies divided vulnerable factors into physical, economic and social vulnerability and considered spatial condition, infrastructure and exposure from physical perspective (UNDP, 2004; UN/ISDR, 2004; GTZ, 2004). The number of residents is used as the exposure for bridge failure. The resident population perceives direct negative impact caused by bridge failure in daily life including increased travel time, lack of access to a health care system and inferior quality of life. More residents imply more potential affected individuals, and thus more vulnerability. Additionally, the failed highway bridges without
substitution limits area accessibility and causes isolated areas. Jenelius (2009) utilized delay and the difference between the new and the original shortest route, to evaluate the effect of link closure. Longer substitution distance and more derived temporal costs, indicates less accessibility and more vulnerability.
Social vulnerability denotes the resistance/coping capacity to hazards according to the social and population structure. The ratio of disadvantaged groups with limited self-protection capacity is positively proportional to vulnerability in which the criteria consist of age and disabled condition (Messener and Meyer, 2005). Recently, the population ageing and low fertility significantly influence population structure and increase the dependency ratio. The dependency ratio indicates the proportion of youth population under 15 and the elderly population over 65 to the working age population in which most of the dependent age population possess insufficient self-protection and response capacity. A higher dependency ratio representing higher loading of each working age population implies higher vulnerability. The elderly population possesses inferior health (Morrow, 1999) and significantly greater disaster fatality and post-disaster psychological symptoms than other age groups (Ngo, 2001). Therefore, the aging index defined as the number of people aged 65 and over per 100 youths under age 15 represents the ageing population as an important social vulnerable factor. Disabled residents are a social vulnerable group due to deficient self-protection and response ability (Rygel et al., 2006).
To assess regional response and health care function on hazards, the distance to an authorized hospital emergency room is used for analyzing the effect of bridge failure on access to health care systems. Inaccessibility heavily influences elderly and chronic patients. However, the losses derived from altered hospitalized practice are inestimable due to unavailable data. The redundancy of daily resources such as electricity generators, water storage facilities and life necessities influences the quality of life in isolated areas. Owing to unavailable electricity and water facilities, the amount of wholesaling and retailing becomes the only indicator for daily resource redundancy. The lower-income household could be classified in social or economic vulnerability based on the research purpose. Hsieh et al. (2010) suggested that the vulnerability classification assists decision makers in checking whether critical vulnerable factors are omitted. Lower-income households possess less disposable money and resources (Clark et al., 1998; Chambers, 2006) and thus are severely affected by additional costs of alternative routes or vehicles. Economic vulnerability consists of industrial loss, employment and household disposable income. Because of the relative small impact of bridge failure on primary and tertiary industries, the number of factories is adopted as the substitute for product value of secondary industry. Although wasted commuting time relates to employment, a higher employed population implies a more resilient industry. Higher household disposable income could mitigate impacts caused by hazards.
3.2 Classification and weight of factors
The basic data of vulnerable factors include published statistics, literatures and digitized data in the form of GIS maps. The residents, dependency ratio, aging index, ratio of disabled residents, lower-income households and number of factories in each township are sourced from a county annual statistics overview. Employment and the amount of wholesaling and retailing are sourced from national industry, commerce and service census. The average annual household consolidated income tax representing the household disposable income is sourced from Lu et al. (2010), while the distances to substitution and hospital emergency are measured from GIS maps.
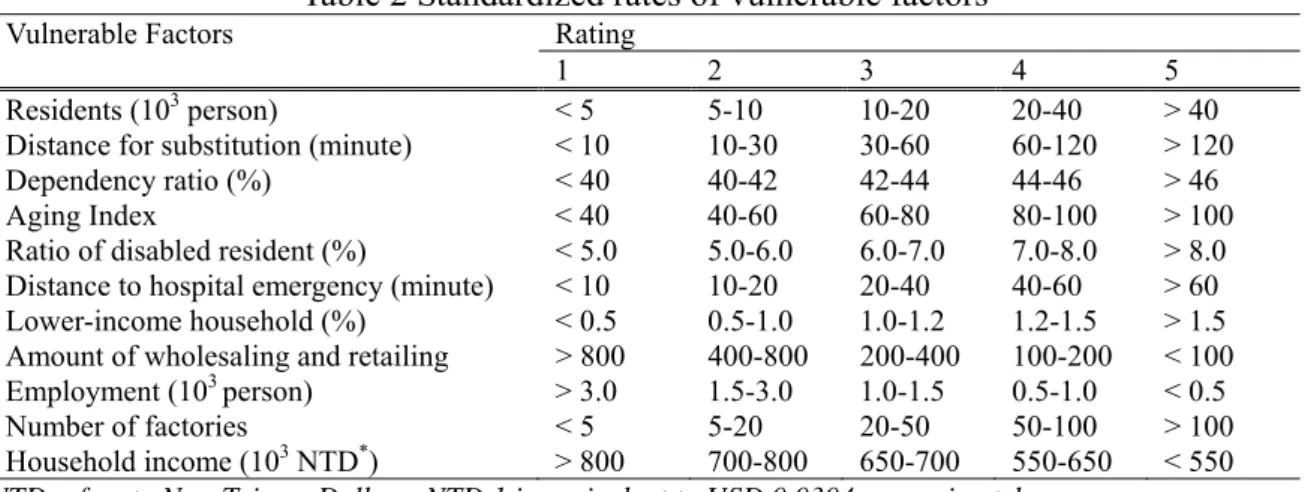
Owing to the inconsistent units of vulnerable factors, a preliminary step ensures a standardized measurement system for all considered factors in which a uniform rating scale between one and five is more appropriate (Dai et al., 2001). Wang et al. (2008) suggested that classifying factor values needs specific decision rules of thresholds. Instead of precise quantitative information, the rating scale assists stakeholders without professional knowledge in perceiving risk and communicating with authorities. Accordingly, experts possessing sufficient experience, information, statistics as well as acceptable risk level of stakeholders should determine the threshold values. The consultation of boundary values integrating literature, local experience, statistics and political commitment are generated via brainstorming and lessons learned to build a consensus. Open participatory meetings emphasize communication, cooperation, and compromise among different participants with the objective of building a consensus regarding system behavior. Table 2 lists the class thresholds and standardized measurements employed for each factor in a township scale.
Table 2 Standardized rates of vulnerable factors
Vulnerable Factors Rating
1 2 3 4 5 Residents (103 person) < 5 5-10 10-20 20-40 > 40 Distance for substitution (minute) < 10 10-30 30-60 60-120 > 120 Dependency ratio (%) < 40 40-42 42-44 44-46 > 46 Aging Index < 40 40-60 60-80 80-100 > 100 Ratio of disabled resident (%) < 5.0 5.0-6.0 6.0-7.0 7.0-8.0 > 8.0 Distance to hospital emergency (minute) < 10 10-20 20-40 40-60 > 60 Lower-income household (%) < 0.5 0.5-1.0 1.0-1.2 1.2-1.5 > 1.5 Amount of wholesaling and retailing > 800 400-800 200-400 100-200 < 100 Employment (103 person) > 3.0 1.5-3.0 1.0-1.5 0.5-1.0 < 0.5
Number of factories < 5 5-20 20-50 50-100 > 100 Household income (103 NTD*) > 800 700-800 650-700 550-650 < 550
* NTD refers to New Taiwan Dollars.NTD 1 is equivalent to USD 0.0304 approximately.
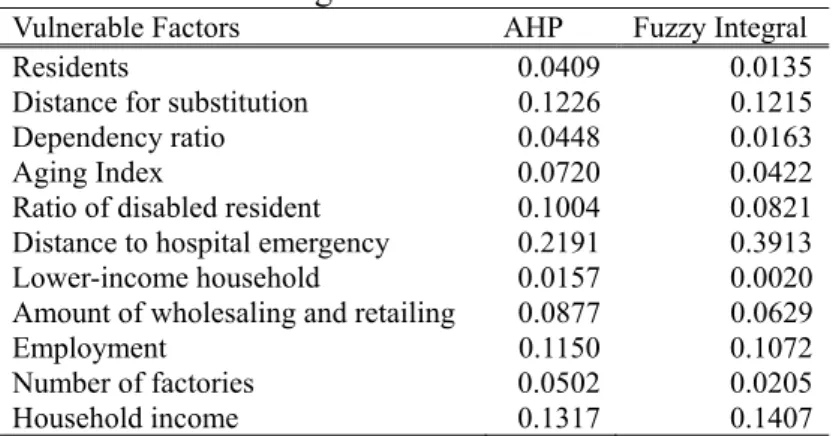
Moreover, participants were invited to weigh vulnerable factors in the consensus building meeting via the analytic hierarchy process (AHP). The 11 selected factors were compared with each other according to experts’ judgments. The pair-wise comparison illustrated that the eigenvector corresponding to the largest eigenvalue of the matrix provides a larger component than that of the other, thus obtaining the vector of weights reflecting the relative importance of various matrix factors of paired comparisons. A nine nominal scale was utilized to determine each pair-wise comparison. Eight experts fully understanding the information of impacts of highway bridge failure, including government, planners as well as scholars in the social, industrial, transportation and disaster management fields, were invited to complete the AHP questionnaire.
Since the complete pair-wise matrix contains multiple relative importance comparisons, the degree of consistency becomes a critical issue in developing the judgment. The consistency ratio (CR) in AHP is used to indicate the probability that the matrix judgment was randomly generated. The Delphi method was adopted to assist experts in revising their earlier answers in light of the replies of other members of their panel. After four rounds, the CR at 0.02 achieved the acceptable level (less than 0.1) suggested by Saaty (1977). Table 3 lists the independent weights of each vulnerable factor in the AHP column. Because the 11 vulnerable factors were identified through the developed impact chain, each factor would be dependent on some other factors. To resolve the conflict with the assumption of AHP, the fuzzy integral was employed to determine the interactions among 11 factors. This approach combined
classification scores from multiple information sources into a single composite score by applying a fuzzy integral with respect to a designated fuzzy measure, representing differential weighting of scores derived from a variety of information sources. The concept of fuzzy measure was originally introduced by Sugeno (1974) to extend the probability measure through relaxation of the additive properties. Because of the limitation imposed on the length of this manuscript, the details of fuzzy integral were omitted. Through the operation of fuzzy integral via LINGO software, the fuzzy measure of 11 vulnerable factors ( ) is equal to 0.013, and the weights of the factors considering relationships between factors are indicated in the Fuzzy Integral column of Table 3.
Table 3 Weights of vulnerable factors
Vulnerable Factors AHP Fuzzy Integral
Residents 0.0409 0.0135
Distance for substitution 0.1226 0.1215
Dependency ratio 0.0448 0.0163
Aging Index 0.0720 0.0422
Ratio of disabled resident 0.1004 0.0821 Distance to hospital emergency 0.2191 0.3913 Lower-income household 0.0157 0.0020 Amount of wholesaling and retailing 0.0877 0.0629
Employment 0.1150 0.1072
Number of factories 0.0502 0.0205
Household income 0.1317 0.1407
3.3 Risk map
Although the definitions of risk differ with the purposes of research, the common acceptable understanding of risk is the consequences associated the probability and severity of some particular hazards (Fedeski and Gwilliam, 2007). Risk analysis estimates the potential damage and consequence based on the scenarios involving various hazards with different probabilities and magnitudes. The risk map is a flexible tool for identifying the classification and level of risk and simplifying the complicated issues of risk. Chan et al. (2003) demonstrated that a risk map simplifies the probability prediction process of a heuristic risk model and illustrates risk zoning via the geographic information system (GIS) overlapping the sensitivity areas and socioeconomic distribution.
Moreover, disaster risk only exists in the intersection of hazard and vulnerability (UN/ISDR, 2004; GTZ, 2004). Disaster risk analysis thus combines vulnerability and hazard assessments simultaneously. Mapping is carried out separately for each type of element related to a specific hazard and then combined into a map of total risk by adding all maps of vulnerability and hazard. Remondo et al. (2008) developed a quantitative procedure for mapping landslide risk based on vulnerability representing the ratio of systematic loss to system value. Müller et al. (2006) focused on the German risk map, undertaken by the Center for Disaster Management and Risk Reduction Technology (CEDIM), to visualize hazard, vulnerability and risk.
The GIS advantages to visually spatial information help decision makers systematically determine what is where. The GIS integrates, analyzes and displays spatial information in planning for disaster prevention and mitigation. Furthermore, the analytical instruments based on the GIS-aided satellite/aerial images assist stakeholders in risk perception and communication because the instruments with a high degree of accuracy are easier to interpret
and useful in analyzing causal-impact relationships (GTZ, 2004). The GIS provides new information through combining multiple layers in a compatible spatial reference area to tackle the difficulties of integrating numerous spatial variables considered in vulnerability assessment (Wang, et al., 2008). This study thus employs the risk map generated via GIS to explore the risk of highway bridges from a vulnerability perspective.
4. EMPIRICAL STUDY
For empirical subjects, this study selected 28 highway bridges located in disaster-prone areas of typhoon Morakot and identified as a “prior monitoring bridge” by authorities based on the construction engineering. Structural vulnerability is thus excluded from the physical vulnerability assessment. The local vulnerability related to bridge failure (Hsieh et al., 2010) in surrounding townships is evaluated via the weighted linear combination of 11 vulnerable factors. Residents in these townships depended on the selected bridges when commuting. The highway bridge vulnerability index (BVI) is calculated as the summed local vulnerability of each township weighted by the reciprocal of squared distance from the bridge.
The BVI ranges from 1.48 to 4.57 with a mean value of 3.19 and a standard deviation of 0.81. Figure 2 reveals the five levels of highway bridge vulnerability, namely very low (BVI ≤ 2.20), low (2.20 < BVI ≤ 2.82), moderate (2.82 < BVI ≤ 3.11), high (3.11 < BVI ≤ 3.56), and very high (BVI > 3.56). Based on the results of AHP, the distance to an authorized hospital in case of an emergency is considered the most important factor for a bridge failure, followed by household disposable income, distance to substitution, employment and the amount of wholesaling and retailing. Accordingly, eight very highly vulnerable highway bridges are all located in mountainous areas, whereas very low level vulnerability bridges are concentrated in downstream areas. The failure of the eight bridges would limit elderly lower-income residents without sufficient daily resource redundancy to access the hospital in case of an emergency. For residents around five of the eight bridges, substitutive routes increase travel time by more than two hours. The Mingzhu Bridge located in central Taiwan has become the unique mountainous bridge with low vulnerability due to better employment and because residents could arrive at Puli Christian Hospital in 12 minutes.
Overlaying vulnerability map and hazard maps generated the risk map. The selected hazards for vulnerable highway bridges includes potential debris flows announced by the Soil and Water Conservation Bureau, the landslide potential areas indicated by the National Science and Technology Center for Disaster Reduction and the flood potential areas investigated by the Water Resource Agency. Based on experiential studies, the magnitudes of landslide and flood have a positive correlation to the volume of rainfall. Landslides thus potentially affect eighty percent of land in Taiwan when the cumulative precipitation reaches 200 millimeters (shown in Fig. 2). In fact, flood potential areas with 150 mm cumulative precipitation are more vulnerable than areas with 200 mm cumulative precipitation.
Except for the Yuemei Bridge, located in the relatively low landslide potential area in Kaohsiung County, very highly vulnerable highway bridges pose an extremely high disaster risk because they are located within potential debris flow areas and in landslide potential areas with 150 mm cumulative precipitation. Similarly, the highly vulnerable Shangchih Bridge and Liugui Bridge pose an extremely high disaster risk. Although the Mingzhu Bridge is situated in a very high hazard potential area where debris flows, landslides and flooding might occur simultaneously when the cumulative precipitation reaches 150 mm, it is
identified as a relatively low disaster risk because of lower bridge vulnerability.
Figure 2 Risk maps of highway bridges
The vulnerability map for highway bridge failure provides decision-makers with a different viewpoint out of structural engineering regarding the impact of bridge failure on transportation in daily life. Since global climate and environmental changes have increased
the sensitivity of human society, this study utilizes vulnerability analysis to help decision-makers understand the vulnerable systems and adopt appropriate strategies for disaster prevention and preparedness to reduce disaster risks. A greater number of vulnerable bridges implies more negative influences on the social network.
The areas around highway bridges with higher vulnerability, especially in the upstream areas, should be of primary concern to mitigate impact intensity. Highway bridges in mountainous areas are more vulnerable due to longer distance to an authorized hospital in case of an emergency, because of the detour routes required, and because more people are without sufficient self-protection capacity. However, along with costly rescues of disadvantaged residents, it is difficult to achieve the break-even point for constructing redundantly physical infrastructures, such as hospitals or bridges, due to low demand. Reducing and limiting the number of livestock depending on bridges to prevent further degradation from overutilization is critical in these vulnerable areas.
In addition to pre-evacuation to mitigate damage and reduce the costs of rescue, governments should limit the development of vulnerable areas via land-use regulation or transfer of development rights for reducing exposure and improving vulnerability. Authorities should develop the resistance of downstream bridges to decrease the probability of failure based on a cost benefit analysis, make redundant infrastructures for increasing the network resilience, and invest in hospital emergency rooms to maintain functioning emergent health care systems. The risk maps of highway bridges provide a basis for examining and approving the development of secondary industries. To avoid industrial losses and the economic impact caused by bridge failure, governments should prohibit secondary industries in areas around vulnerable bridges until accessibility has been improved.
5. CONCLUSION
A prototype model is introduced to assist decision-makers in obtaining a comprehensive understanding of disaster risk from the vulnerability perspective. Besides physical vulnerability, social, environmental and economic impacts are involved in assessing highway bridge vulnerability. Based on the results of literature review, workshops and expert interviews, this study constructs an impact chain of bridge failure consisting of 11 vulnerable factors for evaluating highway bridge vulnerability. The empirical study employs 28 prior monitoring bridges identified by authorities based on structural weakness. According to the results of AHP, the accessibility denoting the distances to the authorized hospital in case of an emergency and substitute routes as well as the resilience referring to employment and redundancy of daily resources remarkably influence highway bridge vulnerability. The analytical results show that bridge vulnerability closely correlates with altitude in which eight very highly vulnerable highway bridges are all located in mountainous areas, whereas the low level is concentrated in the downstream areas.
The risk analysis is utilized to help decision-makers understand vulnerable systems and thus adopt appropriate strategies of disaster prevention and preparedness for reducing disaster risks. The potential debris flows, flood and landslide are employed as hazards for assessing the disaster risk of each selected highway bridge. The case study verifies the usefulness and feasibility of the proposed approaches. Public sectors should formulate strategies for relatively vulnerable mountainous areas, i.e. the heavy and extreme heavy level, based on long-term consideration. For eliminating disaster risk, public sectors should develop
integrated homeland planning to reduce vulnerable factor exposures to hazards, and should implement the community-based disaster prevention to improve self-protection capacity for disadvantaged residents. However, the results of AHP may be dependent on the participants’ subjective opinions. In fact, the vulnerable factors and their related importance of a system vary due to spatiotemporal and hazard characteristics. It thus is difficult to validate this result of AHP with previous studies in the distinct location, duration and threat. Besides, some vulnerability analyses in Taiwan mentioned in Table 1 have employed equal weight z-value rather than paid sufficient attention to the priority to vulnerable factors.
Furthermore, the vulnerabilities of downstream bridges increase gradually due to urban sprawl, economic growth and social structure changes. The costs to improve vulnerability are unaffordable via land-use regulation and encouragement of mitigating negative effects from development. The governments should invest in the redundancy of transportation network and build highly accessible health care systems for surviving vulnerable highway bridges. The proposed approaches assist planners not only in comprehensively understanding the framework and instruments for vulnerability and disaster risk, but also in determining whether a highway bridge has been a critical infrastructure to identify the priorities of resource allocation. However, further research should consider the traffic flow of each highway bridge in terms of physical vulnerability, and develop the methodology to evidence the proposed AHP weights, validate the performance based on the AHP results with actual data or improve the weighting mechanism to reduce subjective of judgments.
REFERENCES
Adger, W. N. (2006) Vulnerability, Global Environmental Change, Vol. 16, No. 3, 268– 281.
Alberts H. C., Alberts R. M., Bloom, M. F., la Flamme, A. D. and Teerikangas, S. (2004) The three Gorges dam project from a systems viewpoint, System Research and Behavioral
Science, Vol. 21, No.6, 585–602.
Alewell, C. and Manderscheid, B. (1998) Use of objective criteria for the assessment of biogeochemical ecosystem models, Ecological Modelling, Vol. 107, No. 2–3, 213–224. Apostolakis G. E. and Lemon, D. M. (2005) A screening methodology for the identification
and ranking of infrastructure vulnerabilities due to terrorism, Risk Analysis, Vol. 25, No.
2, 361–376.
Birkmann, J. (2007) Risk and vulnerability indicators at different scales: Applicability, usefulness and policy implications, Environmental Hazards, Vol. 7, No. 1, 20–31.
Cardona, O. D., Hurtado, J. E., Duque, G., Moreno, A., Chardon, A. C., Velásquez, L. S. and Prieto, S. D. (2005) Indicators of disaster risk and risk management: Program for Latin America and the Caribbean – main technical report. IDB/IDEA Program of Indicators for Disaster Risk Management, National University of Colombia.
Chambers R. (2006) Vulnerability, coping and policy, IDS Bulletin, Vol. 37, No. 4, 33–40. Chan, S. L., Huang, S. L. and Wang, S. H. (2003) On the risk zoning of flood hazard in Taipei
areas, Journal of City and Planning, Vol. 30, No. 4, 263–280 (in Chinese).
Clark, G. E., Moser, S. C., Ratick, S. J., Dow, K., Meyer, W. B., Emani, S., Jin, W., Kasperson, J. X., Kasperson, R. E. and Schwarz, H. E. (1998) Assessing the vulnerability of coastal communities to extreme storms: The case of Revere, MA., USA, Mitigation
and Adaptation Strategies for Global Change, Vol. 3, No. 1, 59–82.
Geography, Vol. 20, No. 4, 529–539.
Cutter, S. L., Boruff, B. J. and Shirley, W. L. (2003) Social vulnerability to environmental hazards, Social Science Quarterly, Vol. 84, No. 2, 242–261.
Dai, F. C., Lee, C. F. and Zhang, X. H. (2001) GIS-based geo-environmental evaluation for urban land-use planning: A case study, Engineering Geology, Vol. 61, No. 4, 257–271. Deutsche Gesellschaft für Technische Zusammenarbeit (GTZ) (2004) Guidelines: Risk
Analysis – a Basis for Disaster Risk Management, GTZ, Eschborn.
Eden, C. and Ackermann, F. (2004) Cognitive mapping expert views for policy analysis in the public sector, European Journal of Operational Research, Vol. 152, No.3, 615–630. Fedeski, M. and Gwilliam, J. (2007) Urban sustainability in the presence of flood and
geological hazards: The development of a GIS-based vulnerability and risk assessment methodology, Landscape and Urban Planning, Vol. 83, No. 1, 50–61.
Ford, J. D. and Smit, B. (2004) A framework for assessing the vulnerability of communities in the Canadian Arctic to risks associated with climate change, Arctic, Vol. 57, No. 4, 389– 400.
Hsieh, C. H., Su, J. L. and Wu, C. (2010) Guideline – Disaster risk assessment basis. Report No. NCDR 98-T13, National Science and Technology Center for Disaster Reduction, Taiwan (in Chinese).
Jenelius, E. (2009) Network structure and travel patterns: explaining the geographical disparities of road network vulnerability, Journal of Transport Geography, Vol. 17, No.
3, 234–244.
Klein, R. J. T. and Nicholls, R. J. (1999) Assessment of coastal vulnerability to climate change, Ambio, Vol. 28, No. 2, 182–187.
Kumpulainen, S. (2006) Vulnerability concepts in hazard and risk assessment. In Schmidt-Thomé, P. (ed.), Special Paper 42: Natural and Technological Hazards and Risks
Affecting the Spatial Development of European Regions, Geological Survey of Finland,
Espoo.
Lee, Z. W., Ford, D. N. and Joglekar, N. (2007) Effects of resource allocation policies for reducing project durations: A systems modelling approach, Systems Research and
Behavioral Science, Vol. 24, No.6, 551–566.
Li, H. C., Yang, H. H., Liao, K. M. and Shaw, D. (2009) Constructing social vulnerability index of flood disaster, Journal of Architecture and Planning, Vol. 10, No. 3, 163–182 (in Chinese).
Lu, J. C., Chen, Y. M. Chang, C. H. and Kuo, Y. L. (2010) Evaluation of inundation risk under climate and environmental changes – An analytical framework for township level evaluation in Taiwan, Presented at the Annul Workshop on Research of Disaster Reduction Program for Enhancing Innovation and Implementation of Disaster Reduction, Taipei, May 2010 (in Chinese).
Messner, F. and Meyer, V. (2005) Flood damage, vulnerability and risk perception – Challenges for flood damage research. Report No. 13/2005, UFZ Discussion Paper.
Morrow, B. H. (1999) Identifying and mapping community vulnerability, Disasters, Vol. 23,
No. 1, 1–18.
Mulilis, J. P. and Duval, T. S. (1995) Negative threat appeals and earthquake preparedness: A Person-relative-to-event (PrE) model for coping with threat, Journal of Applied Social
Psychology, Vol. 25, No. 15, 1319–1339.
Müller, M., Vorogushyn, S., Maier, P., Thieken, A. H., Petrow, T., Kron, A., Büchele, B. and Wächter, J. (2006) CEDIM risk explorer – A map server solution in the project ‘Risk Map Germany’, Natural Hazards and Earth System Sciences, Vol. 6, No. 5, 711–720.
Natural Hazards Review, Vol. 2, No. 2, 80–88.
Nguyen, L. D. and Ogunlana, S. O. (2005) Modeling the dynamics of an infrastructure project, Computer-Aided Civil and Infrastructure Engineering, Vol. 20, No.4, 265– 279.
O’Brien, K. L., Leichenko, R., Kelkarc, U., Venemad, H., Aandahl, G., Tompkins, H., Javed, A., Bhadwal, S., Barg, S., Nygaard, L. and West, J. (2004) Mapping vulnerability to multiple stressors: climate change and globalization in India, Global Environmental
Change, Vol. 14, No. 4, 303–313.
Pidd, M. (1996) Tools for Thinking Modeling Management Science, John Wiley and Sons, Chicheste.
Remondo, J., Bonachea, J. and Cendrero, A. (2008) Quantitative landslide risk assessment and mapping on the basis of recent occurrences, Geomorphology, Vol. 94, No. 3–4, 496– 507.
Rygel, L., O’Sullivan, D. and Yarnal, B. (2006) A method for constructing a social vulnerability index: An application to hurricane storm surges in a developed country,
Mitigation and Adaptation Strategies for Global Change, Vol. 11, No. 3, 741–764.
Saaty, T. L. (1977) A scaling method for priorities in hierarchical structures, Journal of
Mathematical Psychology, Vol. 15, No. 3, 234–281.
Schmidt-Thomé, P., Greiving, S., Kallio, H., Fleischhauer, M. and Jarva, J. (2006) Economic risk maps of floods and earthquakes for European regions, Quaternary International,
Vol. 150, No. 1, 103–112.
Simon, H. (1996) The Sciences of the Artificial, MIT Press, Cambridge.
Smit, B. and Pilifosova, O. (2001) Adaptation to climate change in the context of sustainable development and equity. In: McCarthy, J. J., Canziani, O., Leary, N. A., Dokken, D. J. and White, K. S. (eds.), Climate Change 2001: Impacts, Adaptation and Vulnerability.
IPCC Working Group II, Cambridge University Press, Cambridge.
Sugeno, M. (1974) Theory of fuzzy integrals and its applications, Ph.D. Dissertation, Tokyo Institute of Technology.
Sutherst, R. W., Maywald, G. F. and Russell, B. L. (2000) Estimating vulnerability under global change: Modular modelling of pests, Agriculture Ecosystems & Environment,
Vol. 82, No. 1–3, 303–319.
Tobin G. A. and Montz, B. E. (1997) Natural Hazards: Explanation and Integration, The Guilford Press, New York.
Turner II, B. L., Kasperson, R. E., Matson, P. A., McCarthy, J. J., Corell, R. W., Christensen, L., Eckley, N., Kasperson, J. X., Luers, A., Martello, M. L., Polsky, C., Pulsipher, A. and Schiller, A. (2003) A framework for vulnerability analysis in sustainability science,
Proceedings of the National Academy of Sciences of the United States of America, Vol. 100, No. 14, 8074–8079.
United Nations Development Programme (UNDP) (2004) Reducing Disaster Risk: A
Challenge for Development, UNDP Publication, New York.
United Nations, International Strategy for Disaster Reduction (UN/ISDR) (2004) Living with
Risk: A Global Review of Disaster Reduction Initiatives, United Nations Publication,
Geneva.
Wang, X. D., Zhong, X. H., Liu, S. Z., Liu, J. G., Wang, Z. Y. and Li, M. H. (2008) Regional assessment of environmental vulnerability in the Tibetan Plateau: Development and application of a new method, Journal of Arid Environments, Vol. 72, No. 10, 1929– 1939.
Weidema, B. P. (2006) The integration of economic and social aspects in life cycle impact assessment, The International Journal of Life Cycle Assessment, Vol. 11, Supplement
Wisner, B. (2002) Who? What? Where? When? In an emergency: Notes on possible indicators of vulnerability and resilience by phase of the disaster management cycle and social actor. In: Plate, E. (ed.), Environment and Human Security, Contributions to a workshop in Bonn.