Highly-sensitive analysis of vitamin D
3metabolites by liquid chromatography/
electrochemistry/electrospray ionization-mass spectrometry
Hajime Mizuno
1, Yuta Kobayashi
1,2, Jun Zhe Min
1,3, Toshimasa Toyo’
oka
1, Kenichiro Todoroki
1*
1 Laboratory of Analytical and Bio-Analytical Chemistry, School of Pharmaceutical Sciences, University of Shizuoka,
52‒1 Yada, Suruga-ku, Shizuoka 422‒8526, Japan
2 Present address: Kyoto R&D center, Maruho Co., Ltd., 92 Chudoji Awatacho, Shimogyo-ku, Kyoto 600‒8815, Japan 3 Present address: Pharmaceutical Analysis, College of Pharmacy, Yanbian University, Yanji 133002, Jilin Province, China
Abstract A highly-sensitive analytical method using a liquid chromatography (LC)/electrochemistry (EC)/electrospray ionization (ESI)-mass spectrometry (MS) is developed to analyze vitamin D3 (VD3) and its active metabolites,
25-hy-droxyvitamin D3 (25(OH)D3) and 1,25-dihydroxyvitamin D3 (1,25(OH)2D3) in blood. LC/ESI-MS, which is used for the
general sensitive analysis of biological compounds, has a low ionization efficiency for low polarity molecules such as VD3
metabolites. The LC/EC/MS method, which connects the electrochemical detector (ECD) between the LC and ESI-MS, enables simultaneous and sensitive detection of VD3 and its metabolites. The sample separated by LC is oxidized by
an electrochemical cell, then the oxidant is ionized by ESI and detected by a mass spectrometer. Based on the results of an-alyzing VD3 metabolites, ion peaks of the oxidized products generated by EC are detected, and their peak intensities are 10
times or greater than the unoxidized metabolites. This proposed method for the VD3, 25(OH)D3, and 1,25(OH)2D3 analysis
achieves the low detection limit of 1 nmol/L, 1 nmol/L, and 20 nmol/L, respectively, a good linearity (r2>0.9903), and a good repeatability within<10% (n=5). Analysis of serum samples spiked with VD3 metabolites detect their oxidants peaks
with high sensitivity. This result indicates that this LC/EC/ESI-MS method is also useful for biological sample analysis and allows for quantification of trace amounts of endogenous fat-soluble metabolites other than vitamin D3 metabolites.
Key words: Vitamin D3, 25-hydroxyvitamin D3, 1,25-dihydroxyvitamin D3, electrochemistry, electrospray ionization, LC/EC/
MS
Introduction
Vitamin D2 (VD2) and vitamin D3 (VD3) are some of the
fat-soluble vitamins and essential nutrients. VD2 is
synthe-sized by plants, whereas VD3 is synthesized by exposure to
UV (sunlight) in the epidermis of animals. The active
metabolites, 25-hydroxyvitamin D3 (25(OH)D3) and
1,25-dihydroxyvitamin D3 (1,25(OH)2D3), are obtained by
the hydroxylation reaction from VD2 and VD3. These
metabolites play a significant role in the calcium homeosta-sis and are useful biomarkers for bone metabolic diseases1).
Furthermore, the metabolites deficiency has been linked to various diseases such as diabetes2), cancer3),
autoimmu-nity4), and cardiovascular5). In order to quantify the concen-trations of VD3 and its metabolites in the human blood
sam-ple, a highly-sensitive analytical method is required. However, liquid chromatography (LC)/electrospray (ESI)-mass spectrometry (MS), which is used for general sensitiv-ity analysis of biological compounds, has a low ionization efficiency for low polarity molecules such as VD3
metabo-lites. To increase the sensitivity, atmospheric pressure chemical ionization (APCI), which is a suitable ionization technique for nonpolar molecules, has been used for
ioniza-* Corresponding author Kenichiro Todoroki
Laboratory of Analytical and Bio-Analytical Chemistry, School of Pharmaceutical Sciences, University of Shizuoka, 52‒1 Yada, Suruga-ku, Shizuoka 422‒8526, Japan
Tel: +81‒54‒264‒5656, Fax: +81‒54‒264‒5654 E-mail: todoroki@u-shizuoka-ken.ac.jp
Received: January 15, 2020. Accepted: March 12, 2020. Epub April 16, 2020.
DOI: 10.24508/mms.2020.06.004
tion during the VD3 metabolites analysis5‒8). In addition,
Ogawa et al. reported that the ionization efficiency of ESI
was improved by labeling VD3 metabolites with a
func-tional cationic reagent (DAPTAD: 4-(4′
-dimethylamino-phenyl)-1,2,4-triazoline-3,5-dione) by a derivatization reac-tion9,10). However, APCI is limited to low polar (fat-soluble)
substances and the derivatization is limited to target sub-stances, and is not suitable for comprehensive molecular analyses.
On the other hand, an electrochemical detector (ECD) has been used as a detector for the LC analysis of vitamin D and its metabolites11). In this study, we developed an LC/
EC/ESI-MS method which enables the simultaneous and sensitive detection of VD3 and its metabolites by ESI-MS
analysis combined with electrochemical oxidation. Analyti-cal methods in which an ECD is connected to a mass spec-trometer have been reported before12,13), however, most of them focused on the analysis of drug metabolites by EC oxidation14,15) and the reduction of disulfide bonds in pro-teins and peptides16,17). This is the first study to improve the
mass spectrometric detection sensitivity of VD3 metabolites
using an EC oxidation reaction. To detect EC oxidized fat-soluble metabolites by ESI-MS, a coulometric cell capa-ble of oxidizing almost all molecules passing through the electrodes was used. Since porous graphite is used for the cell electrode, a highly reproducible oxidation reaction is possible even at high flow rates during the sample analy-sis13). The sample separated by LC is oxidized by an
elec-trochemical cell, then the oxidant is ionized by ESI and detected by a mass spectrometer. This method not only enables the highly-sensitive analysis of fatty and low polar-ity molecules without any pretreatment such as derivatiza-tion, but also the simultaneous analysis of polar molecules as the normal ESI-MS is possible when the ECD voltage is turned off.
Materials and Methods
MaterialsL-Menthol and Vitamin D3 was purchased from the
Tokyo Chemical Institute (Tokyo, Japan). 25-Hydroxy vita-min D3(calcidiol) and 1,25-dihydroxyvitamin D3(calcitriol)
were purchased from Toronto Research Chemicals (North York, ON, Canada) and Cayman Chemical Company (Ann Arbor, MI, USA), respectively. LC/MS grade acetonitrile (MeCN; Optima LC/MS), formic acid (FA; Optima LC/ MS), and ammonium formate (Optima LC/MS) were
pur-chased from Fisher Scientific (Waltham, MA, USA). Meth-anol of LC/MS grade was purchased from the Kanto Kagaku Co. (Tokyo, Japan). All other reagents and solvents were of analytical reagent grade. Water (H2O) was purified
using a PURELAB flex ultrapure water purification system (ELGA LabWater, High Wycombe, UK).
Sample preparation
Standard solutions of VD3, 25(OH)D3, and 1,25(OH)2D3
were made by dissolving in acetonitrile to 1 μmol/L each. The serum samples were prepared by dissolving 5 pmol of
VD3, 25(OH)D3, and 1,25(OH)2D3 in 50 μL of human
pooled serum (L-Consera I EX, Nissui Pharmaceutical Co., Ltd., Tokyo, Japan). To remove proteins in the serum, 450 μL of acetonitrile was added, and centrifugation for 10 min (10,000 g, 5°C) was performed. The supernatant was evaporated using a centrifugal evaporator, and the residue was redissolved with 50 μL of acetonitrile to 1 μM of VD3,
25(OH)D3, and 1,25(OH)2D3 each. LC/EC/ESI-MS analysis
The LC/EC/ESI-MS analysis was performed by connec-tion to an EC detector (CoulArray Detector, Model 5600A, Dionex) between the LC and ESI-MS. The schematic image of this method is shown in Fig. 1. In order to separate the analytes, the LC conditions were described as follows: the column was an ACQUITY UPLC BEH C18 (particle size 1.7 μm, 2.1 mm I.D. × 100 mm, Waters, Milford, MA, USA) at the flow rate at 0.2 mL/min and column tempera-ture of 40°C. The LC was isocratic elution and the mobile phase used 100 mmol/L formic acid and 5 mmol/L ammo-nium formate in 90% acetonitrile. The eluted analytes from the column were oxidized by the EC. The applied voltage to the EC analytical cell was 1,300 mV. The autosampler temperature and injection volume were 10°C and 5 μL, respectively. To prevent a high voltage affect in the EC cell, the grounding wire was connected between the ESI ion source and EC cell. The oxidized analytes were ionized and detected by a high-resolution mass spectrometer (Q Exac-tive, Thermo Fisher Scientific, Waltham, MA, USA). The MS conditions were as follows: ESI positive ionization, spray voltage; 3.5 kV, sheath gas flow rate; 10 (arbitrary units (au)), auxiliary gas flow rate; 10 au, capillary tempera-ture; 350°C, heater temperatempera-ture; 300°C, s-lens RF level; 50%, resolution power; 70,000, and scan range; m/z 200‒ 3,000. Mass accuracy of detecting ion peaks was within
3 ppm. The MS/MS spectra (m/z 50‒500) were obtained by a data dependent acquisition program in the mass spectrom-eter. The normalized collision energy (NCE) and the resolu-tion power were 20% and 35,000, respectively. In order to preserve the mass accuracy, the mass spectrometer was cali-brated using a calibration solution containing n-butylamine, caffeine, MRFA, and Ultramark 1621 before the analysis.
Data analysis
Monitoring of the EC cell and control of the applied volt-age was performed using the Coul Array Data Station Pro-gram (version 3.06, Dionex) software. The obtained LC/ EC/ESI-MS data were evaluated using Xcalibur software (Thermo Fisher Scientific). The Xcalibur analyzed the
exact m/z values and the ion chromatograms of the VD3
metabolites and their oxidant ion peaks detected from the obtained data.
Results and Discussion
Optimization of EC oxidation conditions
In order to oxidize VD3, 25(OH)D3, and 1,25(OH)2D3 in
the EC analytical cell, the acetonitrile, formic acid, and ammonium formate concentrations of the mobile phase and the voltage applied to the EC cell were optimized. Since 25(OH)D3 and 1,25(OH)2D3 are both metabolites of VD3
and their basic chemical structures were almost the same,
this reaction optimization used only the VD3 standard. Fig.
1S shows a plot of the detected peak height of the proton-ated VD3 oxidant ion (m/z 383.3313) for each acetonitrile,
formic acid, ammonium formate concentration and applied the EC voltage conditions. For connection to a mass spec-trometer, volatile ammonium formate was used as the salt additive13). From the maximum peak intensity in each fig-ure, the optimal values for each concentration in the mobile phase were determined as follows: 90% acetonitrile, 5 mmol/L ammonium formate, and 100 mmol/L formic
acid. The oxidized VD3 ion peak at m/z 383.3313 showed
the maximum intensity values when 1,300 mV or higher was applied in the EC cell. Based on these results, the selected applied voltage of the EC cell was 1,300 mV in this study.
LC/EC/ESI-MS analysis for VD3, 25(OH)D3, and
1,25(OH)2D3
In order to confirm the improved sensitivity of the VD3
metabolites, each 1 μmol/L of VD3, 25(OH)D3, and
1,25(OH)2D3 was analyzed by the LC/EC/ESI-MS using
the optimized conditions. Figs. 2(a) and (b) show the extracted ion chromatograms of the protonated VD3 ion at m/z 385.3470 and VD3 oxidant ion at m/z 383.3313. When
no voltage was applied to the EC cell, only a peak at m/z 385.3470 was detected at 17.5 min. However, after a
volt-Fig. 1. The schematic image and photo of LC/EC/ESI-MS used in this study. An electrochemical reaction cell (EC cell) is connected between the LC and MS ion source.
Fig. 2. Extracted ion chromatograms of VD3 (m/z 385.34) and oxidized VD3 (m/z 383.33).
(a): No applied EC voltage, and (b): applied EC voltage (1,300 mV). The MS/MS fragment spectra of VD3 (c) and oxidized VD3
(d). Each precursor ion is m/z 385.34 (c) and m/z 383.33 (d), respectively.
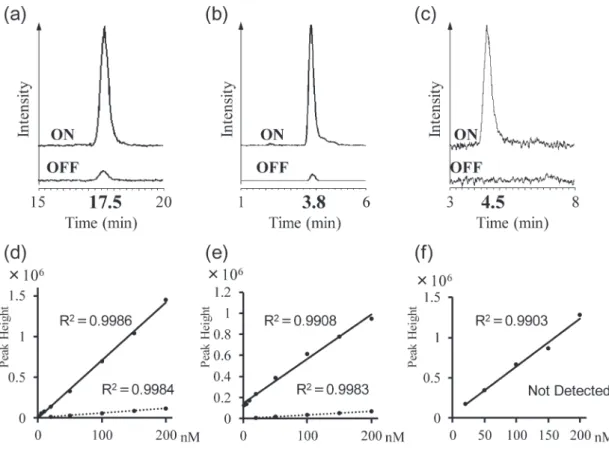
Fig. 3. Extracted ion chromatograms of VD3 (a), 25(OH)D3 (b), and 1,25(OH)2D3 (c).
Each upper chromatogram is no applied EC voltage and the lower chromatogram is the applied EC voltage (1,300 mV). Obtained calibration curves of VD3 (c), 25(OH)D3 (d), and 1,25(OH)2D3 (e). The solid lines show the calibration curves for the EC oxidants,
age (1,300 mV) was applied to the EC cell, the peak at m/z 385.3470 disappeared and a new ion peak at m/z 383.3313 appeared at 17.5 min. The mass difference between the two peaks was 2.0157 Da, which was the same as the m/z value of exactly two hydrogen atoms being removed from the ion at m/z 385.3470. Figs. 2(c) and (d) show the MS/MS frag-ment spectra of both of these ions. The ion at m/z 385.3470 had the same fragment pattern as VD3. A similar fragment
pattern was obtained for the ion at m/z 383.3313. Based on these results, it was found that the ion at m/z 383.3313 was an oxidized form of VD3.
Figs. 3(a)‒(c) show the ion chromatograms obtained by analyzing the VD3, 25(OH)D3 and 1,25(OH)2D3 standard
samples. When a voltage was applied to the EC cell, ion peaks of m/z 399.3262 and m/z 415.3211, which were the
oxidized forms of 25(OH)D3 and 1,25(OH)2D3, were
detected at 3.8 min and 4.5 min, respectively. Furthermore, 25(OH)D3 and 1,25(OH)2D3 were similarly oxidized by EC
to VD3 since almost no peaks at m/z 401.3405 and m/z
417.3362 were detected in the Fig. 3 chromatogram. Com-paring the native forms of the detected ion peak intensities with the oxidized forms, all the oxidative VD3, 25(OH)D3,
and 1,25(OH)2D3 ion peaks were detected at more than 10
times higher. These results suggested that the sensitivity of the ESI-MS detection was improved by improving the pro-ton affinity of VD3, and its metabolites were
dehydroge-nated by the EC13,18). Each calibration curve of VD
3,
25(OH)D3, and 1,25(OH)2D3 was obtained by analysis of
the calibration standard solutions (n=5) with concentrations ranging from 0.5 to 200 nmol/L (0.5, 1, 2, 5, 10, 150, and 200 pmol/L) which were prepared by diluting the stock solutions. Peak heights were used for making the calibra-tion curves. The relative standard deviacalibra-tions (RSD) of the peak heights at each concentration of VD3, 25(OH)D3, and
1,25(OH)2D3 were all 10% or less. The limit of detections
(LODs) were determined from the signal to noise ratio of 3 to 20. The calibration curves as shown in Figs. 3(d)‒(f)
showed that VD3 and its metabolite oxidants were good
with R2 values of 0.9986 (oxidized VD
3), 0.9908 (oxidized
25(OH)D3 and 0.9903 (oxidized 1,25(OH)2D3). Their
LODs were 1 nmol/L (oxidized VD3), 1 nmol/L (oxidized
25(OH)D3), and 20 nmol/L (oxidized 1,25(OH)2D3),
respec-tively. In the combination method of DAPTAD derivatiza-tion and SRM, the detecderivatiza-tion sensitivity of 25(OH)D3 and
1,25(OH)2D3 was about 30 times higher in this method9,10).
The derivatization method is suitable for highly sensitive analysis of VD3 and its metabolites, however cannot
ana-lyze other metabolites other than VD3 simultaneously. In
order to achieve comprehensive metabolite analysis, it is necessary to analyze intact metabolites with high sensitiv-ity. Table 1 shows a comparison of the LOD values of the VD3 metabolites obtained in this study with the general
method using the LC/APCI/tandem quadrupole MS and selected reaction monitoring (SRM)6‒8). It was clarified that the sensitivity was dramatically improved by oxidizing with the EC and ionizing with the ESI compared to the con-ventional method. Furthermore, it was close to the LODs in
Table 1. LOD values of VD3, 25(OH)D3, and 1,25(OH)2D3
by LC/EC/ESI-MS and other previous methods Ionization method LOD (nmol/L) VD3 25(OH)D3 1,25(OH)2D3 ESI 20 20 ND EC/ESI 1 1 20 APCI/tandem MSa 606) 2.87)‒3.88) 1.27)‒3.88)
a: APCI data were obtained by QQQ-SRM. LOD values of VD3,
25(OH)D3, and 1,25(OH)2D3 obtained by LC/EC/ESI-MS and
other previous methods6‒8).
Fig. 4. Extracted ion chromatograms of VD3, 25(OH)D3, and 1,25(OH)2D3 in the serum added samples.
the target analysis by SRM using APCI. This result
indi-cates that metabolites other than VD3 can be
simultane-ously detected with a detection sensitivity comparable to the QQQ using SRM mode because a full scan measure-ment is performed in this study. Furthermore, this method enables simultaneous detection of various metabolites other than the targeted VD3-related metabolites. The blood
vita-min D3 concentration is the range of 50 to 125 nmol/L for
25(OH)D3, and the clinical test reference value for vitamin
D deficiency is 30 nmol/L or less as serum concentration of 25(OH)D32). The method developed in this study has
suffi-cient sensitivity to detect these reference values, confirming that it is a very useful analytical method. However, this method is not sensitive enough for the clinical application of 1,25(OH)2D3 analysis, and further analytical
improve-ment such as SRM detection is needed.
Analysis of the serum samples with spiked VD3, 25(OH)
D3, and 1,25(OH)2D3 standards using this proposed method
revealed that these oxidized ion peaks were detected at a higher intensity than the native forms (Fig. 4). This result shows that this method can detect VD3 and its metabolites
with high sensitivity even in matrix components such as biological samples.
Conclusion
In this study, we developed a highly-sensitive analytical
method for VD3 metabolites by using the combination LC/
ESI-MS with electrochemical oxidation. Based on the results of analyzing the VD3 metabolites using this
pro-posed method, the ion peaks of the oxidized products gen-erated by EC were detected, and their peak intensities were 10 times or higher than the unoxidized metabolites. The
LODs of the VD3 metabolites in the LC/EC/ESI-MS were 1
nmol/L for VD3 and 25(OH)D3, and 20 nmol/L for
1,25(OH)2D3. Their R2 values were 0.9903 or greater
indi-cating good linearity. The serum samples analysis to which the VD3 metabolites were spiked was able to detect these
oxidized peaks with high sensitivity. This result indicates that this method is also useful for biological sample analy-sis.
Based on these results, it was possible for the sensitive
and rapid analysis of VD3 metabolites by this proposed
method. It is expected that this method not only enables the quantification of trace amounts of endogenous fat-soluble metabolites other than the VD3 metabolites, but can also be
applied to the comprehensive analysis of biological
compo-nents.
Acknowledgment
This work was supported by JSPS KAKENHI under grant number 16K21276 (to H.M.).
Conflict of Interest
The authors have no conflicts of interest directly relevant to the content of this article.
References
1) Prentice A, Goldberg GR, Schoenmakers I: Vitamin D across the lifecycle: Physiology and biomarkers. Am J
Clin Nutr 88(2): 500s‒506s, 2008.
2) Holick MF: Vitamin D deficiency. N Engl J Med 357(3): 266‒281, 2007.
3) Moukayed M, Grant WB: The roles of UVB and vitamin D in reducing risk of cancer incidence and mortality: A re-view of the epidemiology, clinical trials, and mechanisms.
Rev Endocr Metab Disord 18(2): 167‒182, 2017.
4) Illescas-Montes R, Melguizo-Rodriguez L, Ruiz C, Coste-la-Ruiz VJ: Vitamin D and autoimmune diseases. Life Sci 233: 116744, 2019.
5) Adela R, Borkar RM, Bhandi MM, Vishwakarma G, Red-dy PN, et al: Lower vitamin D metabolites levels were as-sociated with increased coronary artery diseases in Type 2 diabetes patients in India. Sci Rep 6: 37593, 2016. 6) Byrdwell WC: Quadruple parallel mass spectrometry for
analysis of vitamin D and triacylglycerols in a dietary supplement. J Chromatogr A 1320: 48‒65, 2013.
7) Fabregat-Cabello N, Farre-Segura J, Huyghebaert L, Peeters S, Le Goff C, et al: A fast and simple method for simultaneous measurements of 25(OH)D, 24,25(OH)2D and the Vitamin D Metabolite Ratio (VMR) in serum samples by LC-MS/MS. Clin Chim Acta 473: 116‒123, 2017.
8) Hagenhoff S, Hayen H: LC/MS analysis of vitamin D me-tabolites by dielectric barrier discharge ionization and a comparison with electrospray ionization and atmospheric pressure chemical ionization. Anal Bioanal Chem 410(20): 4905‒4911, 2018.
9) Ogawa S, Ooki S, Shinoda K, Higashi T: Analysis of uri-nary vitamin D(3) metabolites by liquid chromatography/ tandem mass spectrometry with ESI-enhancing and stable isotope-coded derivatization. Anal Bioanal Chem 406(26): 6647‒6654, 2014.
10) Ishige T, Satoh M, Ogawa S, Nishimura M, Matsushita K, et al: Improved sensitivity of serum/plasma 1alpha,25-di-hydroxyvitamin D quantification by DAPTAD derivatiza-tion. Clin Chim Acta 473: 173‒179, 2017.
11) Masuda S, Okano T, Kamao M, Kanedai Y, Kobayashi T: A novel high-performance liquid chromatographic assay for vitamin D metabolites using a coulometric electro-chemical detector. J Pharm Biomed Anal 15(9‒10): 1497‒ 1502, 1997.
12) Oberacher H, Pitterl F, Erb R, Plattner S: Mass spectro-metric methods for monitoring redox processes in electro-chemical cells. Mass Spectrom Rev 34(1): 64‒92, 2015. 13) Faber H, Vogel M, Karst U: Electrochemistry/mass
spec-trometry as a tool in metabolism studies-a review. Anal
Chim Acta 834: 9‒21, 2014.
14) Szultka-Mlynska M, Buszewski B: Electrochemistry-mass spectrometry for in-vitro determination of selected che-motherapeutics and their electrochemical products in comparison to in-vivo approach. Talanta 160: 694‒703,
2016.
15) Mielczarek P, Smoluch M, Kotlinska JH, Labuz K, Gotszalk T, et al: Electrochemical generation of selegiline metabolites coupled to mass spectrometry. J Chromatogr
A 1389: 96‒103, 2015.
16) Cramer CN, Haselmann KF, Olsen JV, Nielsen PK: Disul-fide linkage characterization of disulDisul-fide bond-containing proteins and peptides by reducing electrochemistry and mass spectrometry. Anal Chem 88(3): 1585‒1592, 2016. 17) Switzar L, Nicolardi S, Rutten JW, Oberstein SA,
Aarts-ma-Rus A, et al: In-depth characterization of protein disul-fide bonds by online liquid chromatography‒electrochem-istry‒mass Spectrometry. J Am Soc Mass Spectrom 27(1): 50‒58, 2016.
18) Simon H, Wehe CA, Pajaziti B, Heinrich L, Karst U: Si-multaneous electrochemical oxidation/ionization of a sele-noxanthene revealed by on-line electrospray-high resolu-tion mass spectrometry. Electrochimica Acta 111: 324‒331, 2013.