近畿大学学術情報リポジトリ
92
0
0
全文
(2) Doctoral Dissertation. Molecular Mechanisms of Anti-oxidative Systems Related to Ascorbate in Higher Plants. Yukinori Yabuta Graduate School, Kinki University Division of Agricultural Science (Major: Applied Bioscience).
(3) (英文題目) Molecular Mechanisms of Anti-oxidative Systems Related to Ascorbate in Higher Plants Yukinori Yabuta March, 2003 Graduate School, Kinki University Division of Agricultural Science Major: Applied Bioscience (Adviser: Prof. Shigeru Shigeoka). (和文題目) 高等植物におけるアスコルビン酸による 抗酸化系の分子機構. 近畿大学大学院 農学研究科 応用生命化学専攻 薮 田 行 哲 (指導:重岡 成 教授). Submitted to the Graduate School, Kinki University, to fulfill the requirement for the Doctorate Degree..
(4) ACKNOWLEDGEMENTS I wish to express my science graduate to Dr. Shigeru Shigeoka, Professor of Faculty of Agriculture, Kinki University, for his kind guidance, valuable advice, stimulation discussion, and critical review thought the work including the manuscript of this thesis. Thanks are due to Dr. Ryutaro Utsumi and Dr. Tetuo Murakami, Professor of Faculty of Agriculture, Kinki University, for reading the entire text in its original form. I am thankful to Dr. Takahiro Ishikawa, Faculty of Life and Environmental Science, Shimane University, and Dr. Kazuya Yoshimura, Faculty of Agriculture, Kinki University, for their valuable help, kind suggestion, and stimulating discussion throughout the work. I wish to thank Dr. Toru Takeda and Dr. Masahiro Tamoi, Faculty of Agriculture, Kinki University, for their valuable helps and valuable discussions throughout the work. Finally, special thanks are due to Ryouji Fukui and Takashi Motoki, for their many helpful collaborations. Thanks are also due to all the past and resent members of the laboratory of Nutrition Chemistry in the Faculty of Agriculture, Kinki University, for their kind cooperations..
(5) ABBREVATIONS ASA. reduced ascorbate. APX. ascorbate peroxidase. cAPX. cytosolic ascorbate peroxidase. chlAPXs. chloroprastic ascorbate peroxidase isoenzymes. mAPX. microbody-bound ascorbate peroxidase. sAPX. stromal ascorbate peroxidase. tAPX. thylakoid-bound ascorbate peroxidase. BSA. bovine serum albumin. CAT. catalase. Cyt c. cytochrome c. DAsA. dehydroascorbate. DHAR. dehydroadcorbate reductase. FBPase. fructose-1,6-bisphospatase. GAPDH. NAD+ glyceraldehydes 3-phospate dehdrogenase. GLDH. L-galactono--lactone dehydrogenase. GR. glutathione reductase. GSH. reduced glutathione. GSSG. oxidized glutation. H2O2. hydrogen peroxide. IPTG. isopropyl--D-thiogalactopyranoside. LB. Luria-Bertani broth. MDAR. monodehydroacorbate reductase. MDAsA. monodehydroascorbate. 1. singlet oxygen. O2. O2-. superoxide. OH•. hydroxyl radical. PAGE. polyacrylamide gel electrophoresis. PRK. phosphoribulokinase. PVDF. polyvinylidene dufkyirude. RACE. rapid amplification of cDNA ends. RT-PCR. reverse transcription-PCR.
(6) SOD. supreoxide dismutase.
(7) CONTENTS CAPTER I. Introduction. CAPTER II. Molecular characterization and physiological role of tobacco. 1. mitochondrial L-galactono--lactone dehydrogenase CAPTER III. Expression of spinach ascorbate peroxidase isoenzymes in response to oxidative stresses. CAPTER IV. 25. Thylakoid-membrane bound ascorbate peroxidase is a limiting factor of antioxidative systems under photo-oxidative stress. CAPTER V. 5. 39. Analysis of the signal transduction system involved in the induction of cytosolic ascorbate peroxidase. 57. REFERENCES. 66. PUBLICATIONS. 83.
(8) CHAPTER I Introduction The production of active oxygen species in higher plants Plants are aerobic organisms that require molecular oxygen for survival. However, oxygen is inherently dangerous to plants, because it can be readily reduced to active oxygen species (AOS) (Alscher et al. 1997, Asada 1994, Foyer et al. 1994). AOS, such as superoxide (O2-), hydrogen peroxide (H2O2), singlet oxygen (1O2), and hydroxyl radicals (OH•), inactivate enzymes and damage important cellular components. Chloroplasts, mitochondria, and microbodies (glyoxysomes and peroxisomes) are major sources of AOS in plant cells (Asada 1994, Bowler et al. 1992, van der Bosch et al. 1992).. In mitochondria, respiratory complexes I and II are considered to be major sites. -. Glyoxysomes and peroxisomes produce large. of O2 production (Møller 2001).. quantities of AOS, especially H2O2 (del Rio et al. 1996, Huang et al. 1983, Ogren 1984, Tolbert 1981). The primary function of glyoxysomes during postgerminative seedling growth is the conversion of reserve lipids to carbohydrates through fatty acid -oxidation and glyoxylate cycle in which H2O2 and NADH are generated.. Leaf. peroxisomes are involved in photorespiration, a protective process for C3 plants against photooxidation in which H2O2 is produced (Kozaki and Takeba 1996).. The. chloroplasts are potentially the most powerful source of AOS in plant tissues (Foyer and Harbinson 1993).. O2- is produced when oxygen accepts electrons from photosystem. (PS) I and from the peripheral ferredoxin (Foyer et al. 1994).. 1. O2, produced via. formation of triplet state chlorophyll, is highly destructive. On plasma membrane, NADPH oxidase produces O2- (Grant and Loake 2000). Furthermore, a wide range of environmental stresses such as drought, high salinity, and low temperature lead to enhanced production of AOS, and much of the injury to plants imposed by stress exposure is associated with oxidative damage at the cellular level (Alscher et al., 1997; Bowler et al., 1992; Foyer et al., 1994a; Shigeoka et al., 2002). The Antioxidant system against oxidative stress in higher plants To counteract the toxicity of AOS, a highly efficient antioxdative defense system, composed of both non-enzymatic (chemical) and enzymatic constituents, is.
(9) present in all plant cells. molecules.. The non-enzymatic antioxidants are generally small. Higher plants contain several antioxidants, such as ascorbate (AsA),. glutathione (GSH), and -tocopherol (-toc). Especially, ascorbate (AsA) is the most abundant antioxidant in plants; it is found in all subcellular compartments including the apoplast, leading to an average cellular concentration of 2-25 mM or more in the chloroplast stroma (Smirnoff 2000).. Current understanding of the roles of AsA in. photosynthesis can be summarized as follows. 1) H2O2 scavenging catalysed by AsA peroxidase (APX). 2) Direct scavenging of O2-, OH•, and 1O2. 3) Regeneration of -tocpheryl radicals produced when -toc reduces lipid peroxy radicals. 4) Electron donation to PS II by lumenal ascorbate. 5) Cofactor of violaxanthin de-epoxidase involved in zeaxanthin-dependent dissipation of excess excitation energy (a component of non-photochemical quenching). The enzymatic antioxidative components are a prerequisite for photosynthetic organisms.. They include superoxide dismutase (SOD; EC 1.15.1.1), catalase, and the. enzymes of the AsA-GSH cycle consisting of ascorbate peroxidase (APX; EC 1.11.1.11), monodehydroascorbate reductase (MDAR; EC 1.6.5.4), dehydroascorbate reductase (DHAR; EC 1.8.5.1), and glutathione reductase (GR; EC 1.6.4.2) (Alscher et al. 1997, Asada 1994, Foyer et al. 1994 Shigeoka et al. 2002) (Fig. I-1). However, catalase has a poor affinity for H2O2 and is also subject to inactivation in the light (Foyer 1993). An alternative mode of H2O2 destruction is peroxidase, which is found throughout the cell and has a much higher affinity for H2O2 than catalase (Asada 1999). Peroxidases, however, require a reductant when they reduce H2O2 to H2O. In animals, peroxidases that use reduced GSH are important in the H2O2 detoxification (Meister 1994).. By. contrast, the enzyme activity of catalyzing GSH-dependent reduction of H2O2 has not been detected in higher plants.. Recently, several plants genes have been isolated and. showed homology to mammalian phospholipid hydroperoxide GSH-dependent peroxidase (Criqui et al. 1992, Holland et al. 1993).. However, these genes carry a. codon for Cys residue at the putative catalytic site instead of the codon of TGA for selenocysteine of mammalian GPXs.. The selenium-independent GPX-like protein in. Citrus has the activity towards phospholipid hydroperoxides; however, the recombinant GPX-like protein shows an activity 500 times lower toward lipid hydroperoxide than.
(10) the pig heart phospholipid hydroperoxide GPX (Eshdat et al., 1997). O2-. O2. SOD O2 H2O2 H 2O. GSSG. CAT. AsA. NADPH. H 2O. NAD(P)+ GPX. GR. NADP+. H2O2. DHAR MDAR NAD(P)H MDAsA NADP+. DAsA. APX. H 2O. Fig. I-1. AOS scavenging system, AsA, ascorbate; MDAsA, monodehydoroascorbate; DAsA, dehydorascorbate; GSH, reduced glutathione; GSSG, oxidized glutathione; APX, ascorbate peroxidase; MDAR, monodehydoroascorbate reductase; DHA R, dehydoroascorbate reductase; GR, glutathione reductase; GPX, glutathione peroxidase; SOD, superoxide dismutase; CAT, catalase. The AsA-GSH cycle exists within the chloroplasts and in the cytosol. In this cycle, APX reduces H2O2 to form H2O and monodehydroascorbate (MDAsA). MDAsA spontaneously disproportionates to AsA to AsA and dehydroascorbate (DAsA). MDAsA is also directly reduced to AsA by action of NAD(P)H-dependent MDAR. DAR utilizes GSH to reduce the DAsA and thereby regenerate the AsA.. The oxidized. glutathione (GSSG) produced as a result is re-reduced through the action of GR.. Thus,. higher plants have the AOS scavenging system centering on AsA. In this study As described above, AOS cause oxidative damage at the cellular level. However, in recent years, it has become apparent that plants actively produce AOS as signaling molecules to control many metabolisms (Mittler. 2002).. The production of. AOS during these stresses results from electron transport system of the photosynthetic apparatus and mitochondrial respiration.. Based on the data reported so far, it is. suggested that cellular H2O2 level needs to be regulated strictly. Therefore, AsA and APX isoenzymes are considered to play the important role in the regulation of cellular.
(11) H2O2 level. In the present thesis, I studied the following to clarify the molecular mechanisms of anti-oxidative systems related to AsA as an antioxidant. (1). Molecular characterization and physiological role of tobacco mitochondrial Lgalactono--lactone dehydrogenase. (2). Expression of spinach ascorbate peroxidase isoenzymes in response to oxidative stresses. (3). Thylakoid-membrane bound ascorbate peroxidase is a limiting factor of antioxidative systems under photo-oxidative stress. (4). Analysis of the signal transduction system involved in the induction of cytosolic ascorbate peroxidase.
(12) CAPTER II Molecular characterization and physiological role of tobacco mitochondrial L-galactono--lactone dehydrogenase Introduction In animals, the biosynthetic pathway of AsA is clearly understood (Horowitz et al. 1952, Horowitz and King 1953, Nishikimi and Yagi 1996), while two different pathways have been proposed in plant cells (Mapson et al. 1954, Loewus 1963, 1980, 1987, Saito et al. 1990); one is the same process as that involved in the configurational inversion of the carbon chain in animals, and the other involves no inversion of the carbon chain.. Both pathways can use either D-glucose or D-galactose as a starting. material. Recently, a new biosynthetic pathway has been proposed: GDP-D-mannose, GDP-L-galactose, L-galactose, L-galactono--lactone (L-GL), and AsA (Wheeler et al. 1998).. In any event, the reaction through L-GL by L-GL dehydrogenase(GLDH; EC. 1.3.2.3) is the prominent step in AsA biosynthesis in its synthesizing organisms. GLDH catalyzes the conversion of L-GL to AsA, which is the last step in the biosynthetic pathway from sugars to AsA.. Recently, GLDH was characterized from. mitochondria in spinach leaves, sweet potato roots, cauliflower florets, and kidney beans (Mutsuda et al. 1995, Ôba et al. 1995, Østergaard et al. 1997, Imai et al. 1998, Siendones et al. 1999). Furthermore, cDNAs encoding GLDH have been isolated and characterized from cauliflower and sweet potato (Østergaard et al. 1997, Imai et al. 1998).. In this chapter, I cloned and characterized a cDNA encoding GLDH from. tobacco leaves.. The recombinant GLDH was expressed in Escherichia coli and its. properties were compared with those of the native enzyme. Materials and Methods Material Tobacco plants (Nicotiana tabacum cv. Xanthi) were cultured for 7 weeks in a growth chamber under a 12-h light/12-h dark regime, with a moderate light intensity (300 µmol m-2 s-1), 60% relative humidity, and a day/night temperature of 25/20°C. Commercial sources of materials were as follows: AsA, D-galacturonic acid,.
(13) D-glucuronic acid, D-gulono--lactone, D-galactono--lactone, L-gulono--lactone, and L-GL from Sigma, St. Louis, MO, USA; restriction enzymes and DNA-modifying. enzymes from Takara Shuzo, Kyoto, Japan; the bacterial expression vector pET-3a and E. coli. strain BL21(DE3)pLysS from Novagen, Madison, WI, USA.. All other. chemicals were of the highest grade of purity commercially available. Enzyme Assay GLDH was assayed spectrophotometrically by measuring the reduction of ferri-Cyt c at 550 nm by the modified procedure of Ôba et al. (1995).. The reaction. mixture (1 ml) contained 10 mM potassium phosphate (pH 8.0), 100 µM ferri-Cyt c from horse heart, 2 mM L-GL and the enzyme.. The mixture was preincubated for 1. min at 25°C, and the reaction was started by the addition of L-GL.. Oxidation of. alternate substrate was measured in the same assay mixture as that using L-GL, but L-GL was replaced with L-gulono--lactone, D-galactono--lactone, D-gulono--lactone, D-glucuronic acid or D-galacturonic acid.. Succinate dehydrogenase, a marker enzyme. +. of mitochondria, and NADP -dependent glyceraldehyde-3-phosphate dehydrogenase (NADP+-GAPDH), a marker enzyme of chloroplast, were assayed by the methods of Veeger et al. (1969) and Miyagawa et al. (2000), respectively.. Chlorophyll. (Lichtenthaler 1987) and protein (Bradford 1976) were determined by the methods described in the cited references. Isolation of intact mitochondria All fractionation steps were carried out at 4˚C according to Siendones et al. (1999).. Freshly harvested tobacco leaves (60 g fresh wt) were cut into 1-cm fragments. in 60 ml of 100 mM potassium phosphate (pH 7.4) containing 0.25 M sucrose, 0.35 M mannitol, and 10 mM 2-mercaptoethanol and immediately homogenized in a blender using four 5-s strokes at an interval of 30 s.. The homogenate was squeezed through. four layers of gauze and the filtrate was centrifuged at 1,000 x g for 5 min. supernatant was then centrifuged at 10,000 x g for 20 min.. The. The 1,000 x g-pellet and. 1,000-10,000 x g-pellet were suspended in 100 mM potassium phosphate (pH 7.4) containing 0.25 M sucrose, 0.35 M mannitol, and 5 mM GSH to give a protein concentration of 10 mg ml-1.. Furthermore, the crude mitochondrial fraction. (1,000-10,000 x g-pellet) was subjected to a 2-60% linear Percoll gradient in 30 mM.
(14) HEPES-HCl. (pH. 7.4). containing. 0.25. M. sucrose. and. 2. mM. ethylene. glycol-bis-(-aminoethylether)-N,N,N',N'-tetraacetic acid and centrifuged at 37,000 x g for 30 min by the method of Siendones et al. (1999). The intact mitochondrial fraction was collected from the gradient by aspiration. Subcellular location of tobacco GLDH In order to clarify the suborganellar distribution of GLDH, the intact mitochondrial fraction was centrifuged at 10,000 x g for 20 min and then disrupted osmotically by suspending in 100 mM potassium phosphate (pH 7.4) contained 5 mM GSH in the absence of 0.25 M sucrose and 0.35 M mannitol.. The disrupted. mitochondria were centrifuged at 100,000 x g for 30 min and the pellet was resuspended in 100 mM potassium phosphate (pH 7.4) containing 5 mM GSH. The suspension was sonicated (10 kHz, five 10-s strokes at an interval of 30 s) and centrifuged at 100,000 x g for 30 min to obtain the 100,000 x g-supernatant.. The pellet was resuspended in 100. mM potassium phosphate (pH 7.4) containing 5 mM GSH.. Each fraction obtained by. these procedures was used to assay the activities of GLDH and succinate dehydrogenase (SDH). RT-PCR-amplification and sequence analysis of cDNA for GLDH Based on the common regions of amino acid sequences of GLDH from cauliflower florets and sweet potato (Østergaard et al. 1997, Imai et al. 1998), oligonucleotide primers were designed and used for amplification of GLDH from tobacco.. Total RNA was prepared from tobacco leaves (2.0 g fresh wt) by the. procedure of Yoshimura et al. (1999).. First strand cDNA was synthesized using. ReverTra Ace (reverse transcriptase; Toyobo, Tokyo, Japan) with an oligo(dT) primer. The reaction was performed in a 20-µl mixture containing a standard enzyme buffer supplied by the manufacturer (Toyobo), 2 µg total RNA, 0.25 µM oligo(dT) primer, 1 mM dNTPs, and 100 units of the reverse transcriptase. The reaction mixture was incubated at 42˚C for 60 min and then 99˚C for 5 min. analysis as a template cDNA.. The mixture was used for PCR. PCR amplification was performed: 30 cycles of. denaturation at 94˚C for 60 s, annealing at 55˚C for 60 s, and elongation at 72˚C for 120 s, followed by 72˚C for 7 min.. The reaction mixture (100 µl) contained 1 µM sense. primer [5'-GAGAAGAAAG(A/C)A(G/C)A(A/G)GATCCG-3'] and 1 µM antisense.
(15) primer (5'-GTTGTATGCATCCACCGGGA-3'), 200 µM dNTPs, 1.5 units of ExTaq DNA polymerase (Takara Shuzo, Kyoto, Japan) and 10 µl of cDNA.. A 1.3 kbp. fragment was amplified then cloned into pT7 Blue T-vector (Novagen) and sequenced. Based on the nucleotide sequence obtained, 5'- or 3'-extension of the cDNA clone was performed by the rapid amplification of cDNA ends technique using a commercial kit (Gibco-BRL, Rockville, MD, USA).. Amplified fragments were cloned into pT7 Blue. T-vector and nucleotide sequences were determined for 5'- and 3'-extended fragments. A set of primers was designed from the sequences of the 5'- or 3'-noncoding regions to amplify. the. full. length. cDNAs. encoding. 5'-CCACTAAACCTCCTCAAAACCCACCA-3'; 5'-CTTCAAAGCAAATATTTTGCGGAGG-3'.. GLDH:. sense. antisense. primer, primer,. PCR was performed as described. above using cDNA from tobacco leaves as the template.. DNA sequencing was. performed by the dideoxy chain primer method using an automatic DNA sequencer (ABI PRISMTM 310, Applied Biosystems, Foster City, CA, USA). Southern blot analysis Total DNA was prepared from tobacco leaves (20 g fresh wt) by the procedure of Ishikawa et al. (1997).. The DNA (20 µg) was digested to completion with various. restriction enzymes, separated by agarose gel electrophoresis (1% gel), and transferred to a Hybond N+ membrane (Amersham Pharmacia Biotech, Uppsala, Sweden) using a Model 785 Vacuum Blotter according to the manufacturer's instructions (Bio-Rad, Richmond, CA, USA).. After transfer of the DNA to a membrane, the genomic DNA. fragments for GLDH were detected by probing with the. 32. P-random primed GAL. dehydrogenase cDNA using the Random Primed DNA Labeling Kit (Takara Shuzo, Kyoto, Japan).. Washing the membrane in 1 X standard saline citrate (SSC), 0.1% SDS. at 55°C was referred to as low stringency and 0.1 X SSC, 0.1% SDS at 65°C as high stringency. The membrane was then exposed to an imaging-plate using Mac BAS 2000 (Fuji Photofilm, Tokyo, Japan).. Northern blot analysis Total RNAs were isolated from tobacco leaves, stems, and roots (1.0 g fresh wt each) using a commercial kit (RNAqueousTM; Ambion, Austin, TX, USA).. Total.
(16) RNAs (30 µg each) were subjected to electrophoresis on 1.2% agarose gel containing 2.2 M formaldehyde and transferred to a Hybond N+.. The membrane was. prehybridized at 55°C for 6 h in the buffer containing 5 X SSC, 5 X Denhard's solution, 1% SDS, and 100 µg ml-1 denatured salmon sperm DNA.. The blot was hybridized at. 55°C for 18 h in the presence of the 32P-random primed GLDH cDNA.. The membrane. was washed twice at room temperature in 2 X SSC, 0.1% SDS for 10 min each, and in 0.1 X SSC, 0.1% SDS at 60 C for 60 min. The membrane was then exposed to an imaging plate, and the relative expression ratio of each GLDH transcript was calculated with a Mac BAS 2000 and shown as the mean values from three individual experiments. Construction of GLDH expression plasmid For the construction of plasmid to express the GLDH, the DNA fragment encoding the mature form removing the putative mitochondrial targeting sequence was amplified by PCR.. A Met was added to the immediate upstream region of the mature. form by the ATG initiation codon located in the Nde I restriction site.. Two. oligonucleotide primers contained the Nde I restriction site with the ATG translation initiation. codon. and. the. Bam. HI. restriction. site. (bold. 5'-GTTACATATGTACGCTCCGTTACCCGATGA-3' 5'-CAAGGATCCAGTTACACAG CCTCAGATGAA-3'.. sequence), and. PCR amplification was. carried out in a 100-µl reaction mixture containing 10 µl of 10 x PCR buffer, 200 µM dNTPs, 2.5 units of ExTaq DNA polymerase, 1.0 µM each primer, and 5 ng of template cDNA.. PCR was performed as described above.. The DNA fragments generated by. PCR were purified by gel electrophoresis and ligated into the pT7 blue T-vector. Following transformation of E. coli strain DH5 cells, a clone of the candidate mutant was isolated and sequenced across the region of interest by the dideoxy chain-primer method in order to establish the fidelity of GLDH construction.. From this plasmid. digested with Nde I and Bam HI, a 1.5-kbp DNA fragment encoding the mature form of GLDH was isolated, integrated into the pET-3a expression vector treated with the same restriction enzymes, and then introduced into the E. coli strain DH5.. The plasmid. DNA was prepared from the ampicillin-resistant transformants and verified by digestion with the restriction enzymes Nde I and Bam HI.. The resulting construct, designated. pET/GLDH, was introduced into the E. coli strain BL21(DE3)pLysS to test the ability to direct the synthesis of the recombinant GLDH..
(17) Production of the recombinant enzyme in E. coli The E. coli. transformed pET/GLDH was grown in 50 ml LB medium. supplemented with ampicillin (50 µg ml-1) at 37°C overnight. The culture was then transferred to 1 liter LB medium.. When the culture reached an absorbance of 0.6 at. 600 nm, 0.4 mM isopropyl -D-thiogalactopyranoside (IPTG) was added, and the bacteria were grown for a further 6 h at 37°C.. The cells were harvested by. centrifugation at 6,000 x g for 10 min, and the pellets were kept frozen at -20°C.. The. recombinant GLDH accounted for nearly 3% of the total protein in the E. coli cells by SDS-PAGE. Partial purification of the recombinant GLDH from E. coli All purification steps were carried out at 4˚C. The recombinant E. coli cells (3.8 g wet wt) transformed with pET/GLDH were suspended in 20 ml of 100 mM potassium phosphate (pH 7.4) containing 20% glycerol and 5 mM GSH (buffer A) and disintegrated by passing them through a cooled French pressure cell at 15,000 psi (SLM Aminco, Inc, Urbana, IL, USA).. The homogenate was sonicated (10 kHz) using five. 10-s strokes at an interval of 30 s and was centrifuged at 15,000 x g for 20 min. GLDH was detected at a specific activity of 15.9 nmol min-1 mg protein -1 in the 15,000 x g-supernatant, but not in the pellet fraction, indicating that the enzyme is solubilized by sonication, like the enzyme from sweet potato (Ôba et al. 1995, Imai et al. 1998). The 15,000 x g-supernatant was subjected to ultracentrifugation at 100,000 x g for 30 min.. The supernatant was then loaded onto a DEAE-Sephacel column (1.6 x 12 cm). equilibrated with buffer A.. The column was washed with 50 ml of buffer A and eluted. with a 400-ml linear gradient of NaCl (0-0.3 M) at a flow rate of 1.0 ml min-1. activity of GLDH was eluted as a single peak at 0.04 M NaCl.. The. The active fractions. were subjected to ammonium sulfate [(NH4)2SO4] precipitation at 30% saturation. The precipitate was removed by centrifugation at 100,000 x g for 30 min, and the supernatant was loaded onto a HiLoad 16/10 Phenyl Sepharose column equilibrated with 30% saturated (NH4)2SO4 in buffer A.. The enzyme was eluted with a descending. gradient of (NH4)2SO4 from 30 to 0% saturation in 144 ml of buffer A at an elution rate of 0.8 ml min-1.. Active fractions were combined and stored at -20°C..
(18) Measurements of respiration Respiration experiments were carried out using intact mitochondria isolated from spinach leaves.. The reaction mixture (2 ml) contained 20 mM potassium phosphate. buffer pH7.4, 0.25 M sucrose, 0.01 M KCl, 2 mM MgCl2, 1 mM EDTA, and a substrate. Oxygen uptake was estimated with an oxygen electrode (Hansatech, King’s Lynn, UK) by the addition of L-GL in the presence of 30 µM antimycin A (an inhibitor of complex III) or 100 µM KCN (an inhibitor of complex IV). Other methods Optimum pH was determined at 25°C in 10 mM potassium phosphate (pH 7.0-8.3) and 100 mM Tris-HCl (pH 7.5-9.0). SDS-PAGE was done on 12.5% (w/v) polyacrylamide slab gel according to the method of Leammli (1970).. Proteins were. stained with Coomassie Brilliant Blue R-250 and destained in 7% acetic acid. Results Isolation and characterization of cDNA encoding GLDH The. DNA fragment. was. obtained. by. the. PCR. amplification. of. oligo(dT)-primed cDNA synthesized from the total RNA of tobacco leaves using a set of primers based on the peptide sequences of GLDH from sweet potato and cauliflower (Østergaard et al. 1997, Imai et al. 1998).. A 1.3 kbp fragment was amplified and. subcloned into pT7 Blue T-vector (Novagen).. The fragment encoded a 437-residue. polypeptide, which had significant homology to the internal amino acid sequence of GLDH from sweet potato and cauliflower florets. Based on the nucleotide sequence obtained, we applied the RACE technique in order to obtain the 5'- and 3'-flanking sequences of the 1.3-kbp fragment.. Amplified fragments were cloned into the pT7. Blue T-vector, and the nucleotide sequences were determined for approx. 500 bp and 300 bp for 5'- and 3'-extended fragments, respectively. Full length cDNA encoding GLDH was amplified using a set of primers designed from the sequences of the 5'- or 3'-untranslated regions. A 2.0 kb fragment was amplified, cloned into the pT7 Blue T-vector (Novagen), and sequenced. It was not possible to deduce unambiguously the translational start for a protein derived from the cDNA.. However, the cDNA sequence. exhibited a strongly biased codon usage as previously reported for those from.
(19) cauliflower florets and sweet potato (Østergaard et al. 1997, Imai et al. 1998).. This. was useful in confirming the ATG codon at position 79-81 as the initiator codon, because putative codons upstream of this residue did not conform to the known usage pattern for this organism (data not shown).. Furthermore, the Met residue in the. upstream of the position 79-81 was not detected. Accordingly, the complete sequence of GLDH cDNA revealed an open reading frame of 1,761 bp encoding 587 amino acids; the calculated molecular mass of the encoded protein was 66,755 Da (Fig. II-1)..
(20) Tobacco GLDH cauliflower GLDH sweet potato GLDH Rat GLO yeast GALO. 1:---------MLRSLTSKRSLQSLLHYHHHP--LLRPNPHPTPFNPRPFSSTPGPTTSES---ELRKYIGYTLLLLGCGAA:66 1:---------MLRSLLLRRSNARSLRPPFPPLRTLCTSGQTLTPAPPPPPPPPPPISSSASEKEFRKYAGYAALALFSGAA:71 1:MFRAHHFRRSLRSLLAHSHSHPHSNPHINP-RLLC----SLSSQPP---------SSDA---EVRKYIGYTVLVLGCAAA:63 1:-----------------------------------------------------------------MVHGYKGVQFQ----:11 1:--------------------------------------------------------------------------------:. ⇩ ••••••• 67: TYYSFPFPENAKHKKAQLFRYAPLPDDLHTVSNWSGTHEVQTRTFLQPEAIEELEGIVKTANEKKQRIRPVGSGLSPNGI:146 72: TYFSFPFPENAKHKKAQIFRYAPLPEDLHTVSNWSGTHEVQTRNFNQPETLADLEALVKEAHEKKNRIRPVGSGLSPNGI:151 64: TYYSFPFPADAKHKKAQLFRYAPLPDDLHTVTNWSGTHEVQTRTFLQPESLQELEAAVKDSNEKKQKIRPVGSGLSPNGI:143 12:-------------------------------NWAKTYGCSPEVYYQPTSVEEVREVLALAREQKKKVKVVGGGHSPSDI:59 1:-------------------MSTIPFRKNYVFKNWAGIYSAKPERYFQPSSIDEVVELVKSARLAEKSLVTVGSGHSPSNM:61 ** ** ** * ** 147: 152: 144:. GLTRAGMVNLALMDMVLYV----DEEKKTVTVQAGIRVQQLVDAIKEYGITLQNFASIREQQIGGIVQVGAHGTGAKLPP:222 GLSRSGMVNLALMDKVLEV----DKEKKRVRVQAGIRVQQLVDAIQEYGLTLQNFASIREQQIGGIIQVGAHGTGARLPP:227 GLTRAGMVNLGLMDKVLEV----DKEKKRVTAQAGIRVQQLVDSIKEYGLTLQNFASIREQQVGGIVQVGAHGTGARLPP:219 60:ACTDGFMIHMGKMNRVLQV----DKEKKQITVEAGILLADLHPQLDEHGLAMSNLGAVSDVTVAGVIGSGTHNTGIKHGI:135 62:CVTDEWLVNLDRLDKVQKFVEYPELHYADVTVDAGMRLYQLNEFLGAKGYSIQNLGSISEQSVAGIISTGSHGSSPYHGL:141 * ** * * * * * *. 223: 228: 220: 136:LAT 142:. IDEQVISMKLVTPAKGTIEISKEKDPELFYLARCGLGGLGVVAEVTLQCVERQELVEHTFLSNMKDIKKNHKKFLSDNKH:302 IDEQVIGMKLVTPAKGTIELSKDNDPELFHLARCGLGGLGVVAEVTLQCVERQELLEHTYVSTLEEIKKNHKKLLSTNKH:307 IDEQVISMKLVTPAKGTIEISKEKDPDLFYLARCGLGGLGVVAEVTLQCVERQELVEHTYISNMKDIKKNHKKLLSENKH:299 QVVALTLMTADGEVLECSESRNADVFQAARVHLGCLGIILTVTLQCVPQFQLQETSFPSTLKEVLDNLDSHLKRSEY:215 ISSQYVNLTIVNGKGELKFLDAENDPEVFKAALLSVGKIGIIVSATIRVVPGFNIKSTQEVITFENLLKQWDTLWTSSEF:221 * * * * * * *. 303: VKYLHIPYTDAVVVVTCNPISKSRGPPKHKPKYTTEEALQHVRVLYRESLKKYRGQVADS-----GSPEPEIDELSFTEL:377 308: VKYLYIPYTDTVVVVTCNPVSKWSGAPKDKPKYTTEEALKHVRDLYRESIVKYRVQ--DSSKKTPDSREPDINELSFTEL:385 300: VKYLHIPYTDAVVVVTCNPISKWKGPPKYKPKYSPEEAVGHVQDLYRESLKKYRSTEN----------ESEINELSFTEL:369 216:FRF LWFPHTENVSIIYQDHTNK---APSSASNWFWDYAIGFYL-------------------------------LEFL-L:260 222:IRVWWY PYTRKCVLWRGNKTTDAQNGPAKSWWGTKLGRFFYETLLWISTKIYAPLT-PFVEKFVFNRQYGKLEKSSTGDV:300 * * * 378: RDKLLALDPLNKVHVIEINKAEVEFWRKSEGYRVGWSDEILGFDCGGHQWVSETCFPAGTLSKPSMKDLEYIEELMQLIE:457 386: RDKLIALDPLNDVHVGKVNQAEAEFWKKSEGYRVGWSDEILGFDCGGQQWVSETCFPAGTLAKPSMKDLEYIEQLKELIQ:465 370: RDKLLALDPLNTDHVKKTNQAEAEFWRKSEGYRVGWSDEILGFDCGGHQWVSETCFPAGTLSKPSMKDLEFIEQLMQLIE:449 261:WTSTYLPCL-VGWINRFF-FWMLFNCKKESSNL--SHKIFTYECRFKQHVQDWAIPREK-TKEAL--LE-LKAMLEAHP:331 301:NVTDSISGFNMDCLFSQFVDEWGCPMDNGLEVLRSLDHS IAQAAINKEFYVHVPMEVRCSNTTLPSEPLDTSKRTNTSPG:380 * * * 458: KESVPAPAPIEQRWTACSKSRMSPAYSSADDDIFSWVGIIMYLPTMDARQRRQITEEFFHYRHMTQAQLWDHYSAFEHWA:537 466: KEAIPAPSPIEQRWTGRSKSPMSPAFSTAEEDIFSWVGIIMYLPTADPRQRKDITDEFFHYRHLTQAKLWDQYSAYEHWA:545 450: KESIPAPAPIEQRWTACSKSLMSPAYSSVDDDIFSWVGIIMYLPTMDARERKHITEEFFHYRHLTQAHLWDHYSAYEHWA:529 332: K--VVAHYPVEVRFTRGDDILLSPCFQR--DSCY--MNIIMYRPY-----GKDVPR--LDYW-LAYETIMKKFGGRPHWA:397 381:PVYGNVCR PFLDNTPSHC-RFAPLENVTNSQL-TL-YINPTIYR-PFGCNTPIHKWFTLFENTMMVAGGKPHWAKNFLGS:456 * 538: KIEVPKDKEELAALQERLKKKFPVDAYNQARKELDPNRILSNNMLEKLFI 546: KIEIPKDKEELEALQERLRKRFPVDAYNKARRELDPNRILSNNMVEKLFPVSKTA 530: KIEVPKDKEELQALQARLRKKLPVDAYNRARQELDPNRILSNNMLEKLFPSS 398: KAHNCTQK-DFEEMYPTFHK------FCDIREKLDPTGMFLNSYLEKVFY 457:TTLAAGPVKKDTDYDDFEMRGMALKVEEWYGED LKKFRKIRKEQDPDNVFLANKQWAIINGIIDPSELSD *. :587 :600 :581 :440 :526. Fig. II-1 Comparison of the deduced amino acid sequences of GLDH from tobacco, cauliflower, and sweet potato, GLO from rat (Koshizaka et al. 1988), and L-GL oxidase (GALO) from yeast (Nishikimi et al. EMBL accession no. AB009401). targeting peptide.. The arrow indicates the putative cleavage site of the mitochondrial. Residues found at the same position as tobacco GLDH are shown as white letters on. black. The gaps are introduced to optimize the alignment. acid residues in the five enzymes.. The asterisks show the consensus amino. The dots show a stretch of sequence, which is thought to be a. FAD-binding region.. Southern blot analysis To confirm the occurrence of a DNA encoding GLDH, I examined the genomic organization of the gene for the enzyme in tobacco leaves by Southern blot analysis..
(21) When the DNA prepared from tobacco leaves was digested with several restriction endonucleases and the fragments of GLDH were probed with. 32. P labeled-tobacco. GLDH cDNA, one to three hybridization signals were detected, depending on the restriction enzymes (Fig. II-2).. When the membrane was washed under low stringency. conditions, the result showed the same hybrid pattern as that under high stringency conditions (data not shown).. These observations indicated that there is one copy of the. gene for GLDH in the genome of tobacco leaves, which is in agreement with that of sweet potato (Imai et al. 1998). Bam HI. Bam HI Eco RI. 5'. 200bp 3'. 1. 2. 3. kbp 23.13 9.42 6.56 4.36 2.32 2.02. 1.Apa I 2.Bam HI 3.Eco RI. 0.56. Fig. II-2. Southern blot analysis of GLDH gene. The physical map of the tobacco GLDH cDNA is shown at the top.. The positions of sites recognized by the restriction enzymes used in the Southern blot. are shown by vertical bars in the schematic.. Total DNA (20 µg) obtained from tobacco leaves was. digested to completion with various restriction enzymes, separated on agarose gel electrophoresis (1% gels), and transferred to a membrane.. The genomic DNA fragments for GLDH were detected by. probing with the radiolabeled full length of the cDNA.. Experimental conditions are described in. Materials and Methods.. Detection of GLDH mRNA The total mRNAs from the leaves, stems, and roots of 7-weeks old tobacco plants were subjected to Northern blotting using hybridization probe.. 32. P-labeled GLDH cDNA as a. The mRNAs with a length of 2.0 kb of GLDH were expressed in. each tissue at almost the same level (Fig. II-3)..
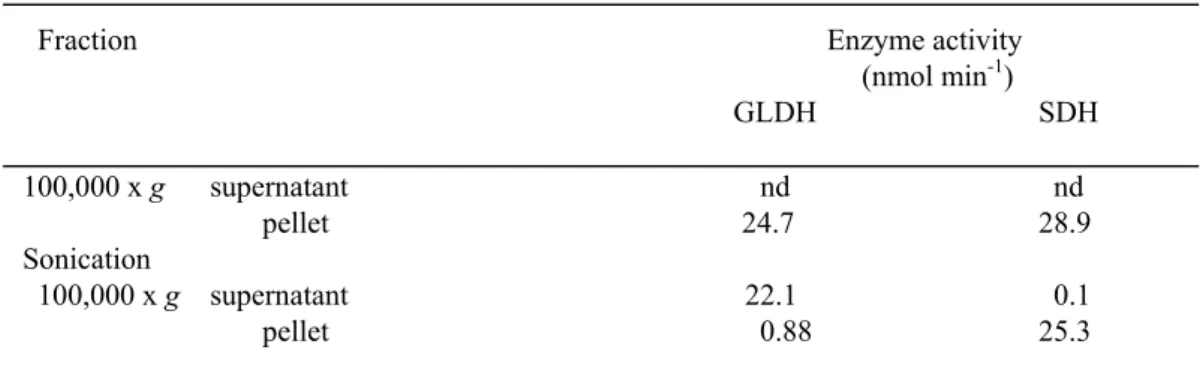
(22) 1. 2. 3. 1. Leaf 2. Stem 3. Root. Fig. II-3. Northern blot analysis of GLDH mRNA.. Total RNAs (30 µg) were isolated from tobacco. leaves, stems, and roots, subjected to electrophoresis on 1.2% agarose gel containing 2.2 M formaldehyde, and transferred to a membrane. The GLDH mRNA was detected by probing with the radiolabeled full length of the cDNA.. The arrow indicates GLDH mRNA.. Experimental conditions. are described in Materials and Methods.. Subcellular localization of GLDH The homogenate prepared from tobacco leaves was subjected to differential centrifugation for the subcellular fractionation. The activities of both GLDH and the mitochondrial marker enzyme succinate dehydrogenase, were detected in the 1,000-10,000 x g-pellet (crude mitochondrial fraction), but not in the 1,000 x g-pellet and the 10,000 x g-supernatant. At this point, approx. 30% of the chloroplast marker enzyme NADP+-GAPDH was recovered in the 1,000 x g-pellet (data not shown). These results suggest the localization of GLDH in mitochondria, but not in chloroplasts which was confirmed by the following experiments. The crude mitochondrial fraction was subjected to a 2-60% linear Percoll gradient centrifugation.. The activity profile of GLDH was parallel to that of succinate. dehydrogenase activity; both activities were not detected in the chloroplastic fraction containing chlorophyll (Fig. II-4). In addition, the activities of GLDH and succinate dehydrogenase were detected in the 100,000 x g-pellet prepared from mitochondria disrupted osmotically (Table II-1).. These data indicated that GLDH exists as a. mitochondrial membrane-bound form in tobacco leaves.. The 100,000 x g-pellet was.
(23) A. B top. Chlorophyll (µg ml-1) 0 20 40 60 80 100120 35. 25 20 15. Fraction number. 30. 10 5 bottom. 0 1 2 3 4 5 6 GLDH an d SDH activities (nmol min-1 ml -1). 0. Fig. II-4. Subcellular distribution of GLDH. (A) Photograph of the separation of mitochondria by linear Percoll gradient centrifugation. (B) Localization of GLDH, SDH and chlorophyll in the separated fractions (1 ml) obteined by linear Percoll gradient centrifugation. Detailed procedures are described in Materials and Methods.. , GLDH;. , SDH;. , chlorophyll.. sonicated and then centrifuged at 100,000 x g for 30 min.. The activity of GLDH was. detected in the 100,000 x g-supernatant fraction, while that of succinate dehydrogenase was detected in the pellet fraction (Table II-1). Thus, tobacco GLDH was solubilized from the mitochondrial membrane by sonication like that of sweet potato (Ôba et al. 1995, Imai et al. 1998).. The 100,000 x g-supernatant solubilized from the intact. mitochondria showed the specific activity of 30.9 nmol min-1 mg protein-1 and was used to study the enzymological properties of the native GLDH..
(24) Table II-1 Suborganellar distribution in mitochondria and solubilization of GLDH and SDH Enzyme activity (nmol min-1). Fraction. 100,000 x g Sonication 100,000 x g. GLDH. SDH. supernatant pellet. nd 24.7. nd 28.9. supernatant pellet. 22.1 0.88. 0.1 25.3. The intact mitochondrial fraction obtained by a 2-60% linear Percoll gradient was centrifuged at 10,000 x g and resuspended in 100 mM potassium phosphate (pH 7.4) containing 5 mM GSH followed by disrupting mitochondria osmotically. 100,000 x g for 30 min.. The homogenate was then centrifuged at. The obtained pellet was resuspended in 100 mM potassium phosphate. (pH 7.4) containing 5 mM GSH, sonicated and centrifuged at 100,000 x g. The pellet was resuspended in the same buffer. Detailed procedures are described in Materials and Methods. nd; not detected.. Expression of the recombinant GLDH in E. coli To express the recombinant GLDH, the DNA fragment encoding the mature form was amplified by PCR.. I examined the optimum conditions for the expression of. GLDH that was subcloned into the pET-3a expression vector (Fig. II-5).. A. B Bam HI. kDa. t. Ampr. GLDH. pET/GLDH 6.14 kb. 94 67. 10s10. Nde I. 43. ori. 30. 56 kDa 1. Marker 2. pET-3a 3. pET/GLDH. Fig. II-5. Expression of GLDH in E. coli cells. (A) Construction of pET/GLDH for the expression of tobacco GLDH. (B) SDS-PAGE analysis of GLDH. Protein samples (corresponding to 50 µg of total protein) were subjected to 12.5% SDS-PAGE and stained by Coomassie Brilliant Blue. Experimental conditions are described in Materials and Methods..
(25) After induction with IPTG, the recombinant tobacco GLDH was expressed at a high level in E. coli cells.. The recombinant enzyme accounted for nearly 3% of the total. protein in the E. coli cells and was solubilized by sonication. The solubilized enzyme showed an activity of 15.9 nmol min-1 mg protein-1.. When E.coli was grown in the LB. medium containing 1 mM FAD, the solubilized enzyme showed an activity of 34.2 nmol min-1 mg protein-1 (Table II-2). Table II-2 Effect of the flavin compoundes on the activities of recombinant GLDH (nmol min-1 protein-1). Fold. None. 15.9. 1.00. 1 mM FAD. 34.2. 2.15. activity. 1 mM FMN. 16.2. 1.02. However, the addition of FAD did not effect in the expressed protein level of GLDH (data not shown).. did not effect in the expressed protein level of GLDH. The. addition of 1 mM FMN to medium failed to increase in the activity of GLDH.. The. homogenate made from untransformed E. coli showed no enzyme activity. Purification of the recombinant GLDH The recombinant GLDH was partially purified as described in Materials and Methods. The purification procedure yielded a GLDH preparation purified approx. 98-fold over the crude enzyme with a yield of 26.2%.. The specific activity of the. partially purified recombinant GLDH was 1.56 µmol min-1 mg protein-1.. This. purification was repeated three times with similar results. Silver-stained SDS-PAGE of the partially purified enzyme showed a main band of 57 kDa corresponding to the molecular mass calculated from the predicted amino acid sequence of the mature form (data not shown). Properties and kinetic parameters of the native and recombinant enzymes Table II-3 shows comparisons of properties of the tobacco native and recombinant GLDH with those of enzymes from spinach, cauliflower, and sweet potato (Mutsuda et al. 1995, Ôba et al. 1995, Østergaard et al. 1997, Imai et al. 1998).. The properties of.
(26) Table II-3 Comparison of enzymatic properties of tobacco native and recombinant GLDH with those of native enzymes from other plants Sweet potatob. Tobacco recombinant Molecular mass (kDa). Cauliflowerc. Spinachd. native. 56. 56. 56. Substrate specificity (%)a L-GL. 100. 100. 100. 100. 100. -Gulono- -lactone. 7. 0. 1. 0. 0. D-Galactono--lactone. 0. 0. 0. 0. 0. D. -Gulono- -lactone. 0. 0. 0. 0. 0. D. -Glucuronic acid. 0. 0. 0. 0. D. -Galacturonic acid. 0. 0. L-GL (mM). 0.08. 0.06. Cyt c. 3.6. 3.7. 8.0. 8.0. L. 0. Km value. (µM). Optimum pH aRelative activity.. 0.12. 3.3. 0.15 18.0. 7.9. 8.0-8.5. 8.0. bÔba et al. (1995) and Imai et al. (1998). cØstergaard et al. (1997). dMutsuda et. al. (1994).. the recombinant enzyme were indistinguishable from those of the native enzyme in intact mitochondrial fractions with respect to the substrate specificity, Km values, and optimum pH.. The recombinant enzyme utilized only L-GL as an effective substrate,. which is in agreement with those of cauliflower and sweet potato. L-gulono--lactone, which was the established substrate of L-gulono--lactone oxidase (GLO) (Nishikimi et al. 1976), was used only 7.0% as effectively as L-GL. D-forms. of. the. compounds,. D-galactono--lactone,. D-galacturonic acid were not detected.. However, the activities for D-glucuronic. acid,. and. The Km values for L-GL and Cyt c were. determined using Lineweaver-Burk plots with substrate concentrations of 0.01-2 mM for L-GL and 0.25-100 µM for Cyt c.. The Km values for L-GL of native and. recombinant enzymes were 0.08 mM and 0.06 mM, respectively, when the concentration of Cyt c was 100 µM, while the values for Cyt c of these enzymes were 3.6 µM and 3.7 µM, respectively, when the concentration of L-GL was 2 mM.. The.
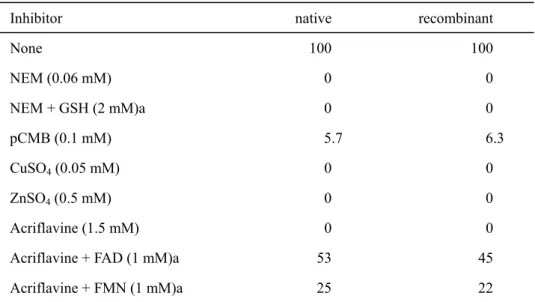
(27) tobacco native and recombinant GLDH were extremely inhibited by the incubation with N-ethylmaleimide, p-chloromercuribenzoate, and divalent cations such as Cu2+ and Zn2+ (Table II-4).. These data indicated that a sulfhydryl group in the enzyme protein. participates in the reaction.. A similar inhibition has been reported for cauliflower and. sweet potato GLDH (Mutsuda et al. 1995, Ôba et al. 1995, Østergaard et al. 1997, Imai et al. 1998).. Imai et al. (1998) demonstrated that, in the inhibition by. N-ethylmaleimide, the activity was partially restored by incubation with GSH. However, the activity of the tobacco enzyme was not restored by GSH. The activities of recombinant and native enzymes were completely inhibited by 1.5 mM acriflavine as a flavoenzyme inhibitor.. This inhibition was diminished by the addition of FAD or. FMN (Table II-4), which was in agreement with the result of sweet potato enzyme (Ôba et al. 1995). These data suggest that a flavin group of the tobacco GLDH is involved in the reaction. Table II-4 Effect of inhibitors on the activities of tobacco native and recombinant GLDH Relative activity (%) native. recombinant. 100. 100. NEM (0.06 mM). 0. 0. NEM + GSH (2 mM)a. 0. 0. pCMB (0.1 mM). 5.7. 6.3. CuSO4 (0.05 mM). 0. 0. ZnSO4 (0.5 mM). 0. 0. Acriflavine (1.5 mM). 0. 0. Acriflavine + FAD (1 mM)a. 53. 45. Acriflavine + FMN (1 mM)a. 25. 22. Inhibitor None. The tobacco native and recombinant GLDH showed the specific activities of 1.56 µmol min-1 mg protein-1 and 30.9 nmol min-1 mg protein-1, respectively.. Each enzyme activity. was assayed after 5-min treatment with each inhibitor. a GSH, FAD, or FMN was added after. 5-min. treatment. p-chloromercuribenzoate.. with. inhibitors.. NEM;. N-ethylmaleimide.. pCMB;.
(28) GLDH activity in mitochondria is linked to the respiratory chain The localization of GLDH in the mitochondrial inner membrane space (Fig. II-4, Table II-1) and its specificity for Cyt c suggest that the activity of GLDH is associated with the mitochondrial respiratory chain.. To explore this possibility, I. measured the oxygen uptake of intact mitochondria isolated from spinach leave by the addition of a respiratory substrate.. The oxygen uptake of intact mitochondria. increased by addition of 3 mM succinate; this increase was inhibited by the addition of antimycin A or KCN (Fig. II-6).. Interestingly, the addition of 4.2 mM L-GL caused the. increase of oxygen uptake, which was not inhibited by KCN.. However, the antimycin. A failed to the inhibition of the increase in oxygen uptake by L-GL.. These data. suggest that the GLDH activity is linked to the mitochondrial respiratory chain.. 3 m M su ccinate. 100 µM KCN. 4.2 mM GAL. 100 µM O2. 100 µM KCN. 3 m M su ccinate. 30 µM antimycin A. 4.2 mM GAL. 30 µM antimycin A. 100 µM KCN 2 m in. Fig. II-6. Effect of L-GL and mitochondrial respiratory chain inhibitor on O2 up take by isolated intact mitochondria from spinach leaves.
(29) Discussion Here I cloned and characterized a cDNA encoding GLDH from tobacco leaves. In cauliflower GLDH, its mature form (56 kDa) was generated by removing the mitochondrial targeting sequence of 91-amino acids from pre-mature form (68 kDa) (Østergaard et al. 1997).. A similar result has also been obtained in the enzyme of. sweet potato (Imai et al. 1998).. The N-terminal sequence of tobacco GLDH encoded a. putative mitochondrial targeting sequence.. This targeting sequence contained a. relatively high number of Ala, Leu, Arg, and Ser (4, 13, 6, and 9, respectively) residues and relatively few Asp, Glu, Ile, and Val (0, 3, 1, and 0, respectively) which was characteristic for a mitochondrial targeting sequence (von Heijne 1986).. In fact,. GLDH was localized in the mitochondria of tobacco cells (Fig. 4). In addition, a putative cleavage site (FR/YA) of the targeting sequence of tobacco GLDH was identical to those of cauliflower and sweet potato GLDH (Østergaard et al. 1997, Imai et al. 1998). Accordingly, the mature form of GLDH consisting of 501 amino acids with a predicted molecular mass of 56,926 Da might be generated by processing the N-terminal 86-amino acid-prepeptide with a predicted molecular mass of 9,847 Da from the pre-mature form.. A comparison of the deduced amino acid sequence of the GLDH. cDNA from tobacco leaves with the sequences of other GLDH from plant sources, GLO from rat (Koshizaka et al. 1988), and L-GL oxidase from yeast (Nishikimi et al. EMBL accession no. AB009401) is shown in Figure 1. The deduced amino acid sequence of tobacco GLDH showed homology with those of GLDH from cauliflower florets (76.7%) and sweet potato (82.3%), GLO (12.3%), and L-GL oxidase (10.7%). Judging from the inhibition by acriflavin, a flavoenzyme inhibitor, and the absorption spectra of GLDH purified from sweet potato, Imai et al. (1998) suggested that the enzyme is a flavoprotein like GLO from animals and L-GL oxidase from yeast (Nishikimi et al. 1976, 1980).. The addition of FAD to the culture of E.coli containing. pET/GLDH led to the increase in the specific activity of GLDH (Table II-2). The tobacco GLDH was also inhibited by acriflavin (Table II-4). These findings suggest that the tobacco GLDH is a flavoprotein.. On the other hand, Østergaard et al. (1997). could not obtain the absorption spectrum for the typical flavoprotein from the purified cauliflower enzyme or observe any inhibition of the activity by riboflavin, a flavoprotein inhibitor.. A stretch of the sequence. 137. VGSGLSP143 of sweet potato.
(30) GLDH was well conserved among flavoproteins including GLO and L-GL oxidase (Nishikimi et al. 1976, 1980, Imai et al. 1998).. However, GLO and L-GL oxidase. contained a His residue corresponding to the Leu residue, which is thought to be a covalently FAD-binding site.. The difference in the amino acid residue at this position. suggested that the flavin prosthetic group was noncovalently bound to sweet potato GLDH (Imai et al. 1998).. The similar situation seems to be also true in the tobacco. GLDH. Considering the physiological importance of AsA in higher plants, understanding of the production site of AsA by GLDH and the transportation of synthesized AsA is required.. GLO from animals and L-GL oxidase from yeast were. located in the microsomes and in the mitochondria, respectively (Nishikimi et al. 1976, 1978, Kiuchi et al. 1982).. As shown in Table II-1, the tobacco GLDH was localized in. the mitochondrial membrane, which was in agreement with the occurrence of those from spinach, cauliflower, and sweet potato (Mutsuda et al. 1995, Ôba et al. 1995, Østergaard et al. 1997, Imai et al., 1998).. Recently, it has been reported that GLDH. from kidney bean is an intrinsic protein linked to the inner membrane of mitochondria (Siendones et al. 1999). Based on the data accumulated so far, it is expedient that Cyt c serves as the sole physiological electron acceptor for the GLDH (Mutsuda et al. 1995, Ôba et al. 1995, Østergaard et al. 1997, Imai et al., 1998).. Cyt c is located in the external side of the. inner membrane of plant mitochondria (Mackenzie and Mclntosh 1999). Accordingly, the active site of the bound GLDH may predict to be faced to the intermembrane space side of the inner membrane of mitochondria to effectively transfer electrons from L-GL to Cyt c.. In fact, the addition of L-GL to isolated mitochondria caused the oxygen. uptake to increase, which was inhibited by the addition of KCN (Fig. II-6). the addition of antimycin A did not inhibit the oxygen uptake.. However,. These data indicate that. electrons from Cyt c via GLDH are passed to molecular oxygen through Cyt oxidase complex in the respiratory chain, producing ATP by oxidative phosphorylation. The subcellular distribution of AsA in plants depends on the site of AsA synthesis, on its intracellular translocation, and on the site where it can be regenerated from its oxidized forms (Noctor and Foyer 1998).. AsA is synthesized in the. mitochondrial inner membrane and then translocates into the cytosol and other compartments including chloroplasts, vacuoles, and apoplasts.. The transport from the.
(31) cytosol into each compartment would follow a concentration gradient, because a carrier has not been found (Rautenkranz et al. 1994). Translocation of AsA into chloroplasts has been suggested to occur by facilitated diffusion (Anderson et al. 1983, Beck et al. 1983, Foyer and Lelandais, 1994). The regeneration of AsA from oxidized forms has been found to occur in the cytosol, chloroplast, and microbody (Asada 1999, Ishikawa et al. 1998, Noctor and Foyer 1998). An endogenous AsA seems to be essential to effectively maintain the antioxidant systems that protect cellular components of photosynthetic organisms from oxidative damage due to biotic and abiotic stresses. It is interesting to note that GLDH is expressed in almost equal quantities in all plant tissues (Fig. II-3), supporting the fact that AsA serves not only for the protection from oxidative stress but also for many other critical roles including a general reducing agent, the regeneration of membrane-bound quenchers such as toc and zeaxanthin, the detoxification of air pollutants in the apoplasts, and the control of plant cell elongation and proliferation (Noctor and Foyer 1998)..
(32) CAPTER III Expression of Spinach Ascorbate Peroxidase Isoenzymes in Response to Oxidative Stresses Introduction The cDNAs encoding the APX isoenzymes were isolated from various plant species and are well characterized by many research groups (Mittler and Zilinskas, 1991; Bunkelmann and Trelease, 1996; Kubo et al., 1992; Mano et al., 1997; Yamaguchi et al., 1996; Webb and Allen, 1995).. In our laboratory, the five kinds of. APX isoenzymes cDNAs from spinach leaves were isolated and characterized.. These. cDNAs encode tAPX, sAPX, mAPX, cAPX, and an unknown form (putative cytosol soluble isoenzyme; SAP1) (Ishikawa et al., 1995, 1996a, 1998).. As for the two. chloroplastic APX (chlAPX) isoenzymes, we clarified that both isoenzymes are encoded by only one gene (ApxII) and their mRNAs are regulated by the alternative splicing of its two 3'-terminal exons (Ishikawa et al., 1996a, 1997; Yoshimura et al., 1999).. A similar finding was also observed in pumpkin (Mano et al., 1997),. Mesembryanthemum crystalinum (accession no. AF069315, tAPX; AF069316, sAPX) and tobacco (accession no. AB022273, tAPX; AB022274, sAPX). Recent studies have focused on the changes in the cAPX expression level under environmental stresses such as ozone, UV-B radiation, low temperature, high-light intensity, salinity, water stress including drought, and pathogen infection (Tanaka et al., 1985; Schöner and Krause, 1990; Mishra et al., 1993; Hernández et al., 1995; Willekens et al., 1994; Mittler and Zilinskas, 1992, 1994; Kubo et al., 1995; Conklin and Last, 1995; Rao et al., 1996; Örvar et al., 1997; Mittler et al., 1998). Considering the specific distributions and roles of the APX isoenzymes and the potential for AOS production in each organelle of higher plants, it seems likely that the APX isoenzymes are expressed by distinct regulatory mechanisms. However, no studies have presently simultaneous analysis of the stress responses of all the APX isoenzymes. In fact, the lack of specific probes to detect the APX isoenzymes at the mRNA and protein levels has limited the understanding of the expression of the respective isoenzymes.. In this chaptor, I studied the responses of all the APX isoenzymes in. spinach leaves to high-light intensity, salinity, drought, and treatments of methyl.
(33) viologen (MV) and abscisic acid (ABA) by Northern blot analysis using each cDNA as a probe.. The steady-state mRNA expression of each APX isoenzyme revealed that. only the expression of cAPX isoenzyme responds to high-light intensity and MV treatment, while the other isoenzymes are constitutively expressed under normal and stressful conditions. Materials and Methods Materials Spinach seedlings (Spinacia oleracea), individually planted in pots, were grown in a climate chamber under the following normal conditions: an 8-h photoperiod, illumination of 300 µE m-2 s-1, 15 ± 2.5°C, and a relative humidity of 75 ± 5%.. The. cDNAs encoding the spinach APX isoenzymes were originally cloned into plasmid pBluescript SK(+) (Ishikawa et al., 1995, 1996a, 1998).. All other chemicals were of. the highest purity grade commercially available. Plant Stress Conditions Four-week-old plants were exposed to stresses of high-light intensity, salinity, and drought and treatments of ABA and MV. exposure to illumination at 1600 µE m-2 s-1.. High-light stress was accomplished. Recovery from the high-light stress was. assayed by the following: high-light exposed plants for 5 h were transferred to normal conditions under 300 µE m-2 s-1 illumination and sampled 2 and 48 h later. Salinity stress was done by transferring the plants to Hoagland's solution containing 300 mM NaCl and growing for 3 days under normal conditions. Chemical treatments were imposed by spraying with 1 mM ABA or 10 µM MV, each prepared in 0.05% (v/v) Tween 20 as described previously (Mittler and Zilinskas, 1992).. ABA-treated plants. were sampled following a 24 h-incubation under normal conditions.. MV-treated. plants were sampled following a 1 h incubation under illumination at 1,600 µE m-2 s-1. Drought stress was done by harvesting the whole plants, washing gently, and then subjecting them to dehydration on a paper towel for 1 h.. Control plants were. maintained under normal conditions and sampled at the same time as were the several stressed-plants.. In all the stressed-plants, visible injury, such as the degradation of. chlorophyll, was not observed.. The leaves were collected from approx. 30 plants per.
(34) treatment, divided into four portions, flash-frozen in liquid N2, and stored at -80°C for the northern blotting, the immunoblotting, and the activity assay for each APX isoenzyme and for the measurement of their biochemical parameters. RNA Extraction and Northern Blot Analysis The total RNA (30 µg each) was isolated from the spinach leaves (1 g, FW) as previously described (Yoshimura et al., 1999), subjected to electrophoresis on 1.2% agarose gel containing 2.2 M formaldehyde, and transferred to a Hybond N membrane (Amersham, Bucks., UK).. Prehybridization took place at 55°C for 6 h in buffer. containing 5 X SSC, 5 X Denhard's solution, 1% (w/v) SDS, and 100 µg ml-1 denatured salmon sperm DNA.. The membrane was hybridized at 55°C for 12 h in the presence. of the individual 32P-random primed spinach cDNA of the APX isoenzymes.. Ishikawa. et al. (1997) have previously described that the tAPX and sAPX isoenzymes arise from a common pre-mRNA, which generated from an identical gene (ApxII), by alternative splicing of the 3'-terminal exons.. As a result, four mRNA variants, one form of. thylakoid-bound APX (tAPX-I) and three forms of stromal APX (sAPX-I, sAPX-II, and sAPX-III) are generated (Yoshimura et al., 1999). sAPX-II and sAPX-III mRNAs contained a sequence derived from exon 13 including the coding sequence of the membrane anchoring segment of tAPX as a untranslated region.. Accordingly, the. respective transcript levels of sAPX and tAPX isoenzymes are difficult to determine by Northern blot analysis.. Therefore, in this experiment, we detected as the transcript. level of chlAPX added together with those of tAPX and sAPX using a tAPX cDNA as the probe. The membrane was washed twice in 2 X SSC and 0.1% (w/v) SDS for 10 min each at room temperature, and in 0.1 X SSC and 0.1% (w/v) SDS at 60°C for 60 min.. The membrane was then exposed to an imaging-plate and the relative expression. ratio of each APX transcript was calculated using Mac BAS 2000 (Fuji Photofilm, Tokyo, Japan). Enzyme Assays One of the specific properties of APX isoenzymes is rapid inactivation in an AsA-depleted medium.. This is especially true for chloroplastic APX isoforms, whose. half-inactivation time was only 15 s (Miyake and Asada, 1992; Yoshimura et al., 1998). Both cAPX and mAPX isoenzymes are less sensitive to depletion of AsA than.
(35) chloroplastic APX isoforms, so the half-inactivation times of cAPX and mAPX were approximately 60 min and over 24 h, respectively (Chen and Asada, 1989; Miyake and Asada, 1992; Ishikawa et al., 1998). On the basis of this characterization, the activities of the APX isoenzymes were separately assayed by the modified method reported by Amako et al. (1994).. Spinach leaves were ground to a fine powder in liquid N2 and. then homogenated in 10 mM potassium phosphate buffer (pH 7.0) containing 1 mM AsA, 20% (w/v) sorbitol, 1 mM EDTA, and 0.1% phenylmethanesulfonyl fluoride using pestle and mortar.. The homogenate was squeezed through four layers of. cheesecloth and then centrifuged at 100,000 x g for 30 min.. The obtained soluble. fraction contained activities of sAPX and cAPX isozymes; the supernatant (5 µl) was added to 2.0 ml of N2-bubbling 50 mM potassium phosphate buffer (pH 7.0) containing 10 µM H2O2.. At 1, 2, 3 and 5 min after the start of the incubation, the incubated. mixture (1.98 ml) was sampled and mixed with 10 µl of 100 mM AsA to terminate the inactivation. The residual oxidizing activity of AsA was then assayed by adding 10 µl of 20 mM H2O2. The oxidation of AsA was followed by a decrease in the absorbance at 290 nm (e=2.8 mM-1 cm-1).. The results are plotted on the graph. The ratio of. cAPX and sAPX activities was calculated from the inactivation curve of each isoenzyme. potassium. The 100,000 x g-membrane fraction was washed and suspended in 10 mM phosphate. buffer. (pH. 7.0). containing. 1. mM. AsA.. The. suspended-membrane fraction contained activities of tAPX and mAPX isozymes; they were separately assayed by the same method using each half-inactivation time as measurements of activities of sAPX and cAPX isoenzymes.. The protein was. quantified as described in chapter II. SDS-PAGE and Immunoblotting To measure the protein levels of the APX isoenzymes, the spinach leaves were homogenized with SDS-loading buffer [150 mM Tris-HCl, pH 6.8, 4% (w/v) SDS, and 10% 2-Mercaptoethanol].. The homogenates were boiled for 5 min and. centrifuged at 10,000 x g for 10 min.. The supernatants were quantified with respect to. protein contents and subjected to SDS-PAGE and immunoblotting. SDS-PAGE was performed in 12.5% slab gels according to the method of Leammli (1970). were stained with Coomassie Brilliant Blue R-250.. The gels. For immunoblotting, the gels were. transferred to PVDF membranes (Bio-Rad) using an electroblot apparatus (model.
(36) 200/2.0, Bio-Rad) at 15 V for 1 h. The membranes were treated with the Euglena cAPX monoclonal antibody (EAP1; Ishikawa et al., 1996b) to detect cAPX and mAPX or the spinach sAPX monoclonal antibody (mAb-I; Yoshimura et al. 2001) to detect sAPX. and. tAPX.. The. membranes. were. visualized. with. alkaline. phosphatase-conjugated goat anti-mouse IgG (Bio-Rad). Assay of Photosynthesis The CO2 fixation was measured with the portable LI-6400 photosynthesis system (Li-Cor, Lincoln, NE).. Net CO2 assimilation rates were measured using fully. expanded leaves under the following conditions: 300 µE m-2 s-1, 1,000 ppm CO2, 15°C,and 75% relative humidity.. The change in chlorophyll fluorescence was. measured at 15°C with a Mini PAM Chlorophyll Fluorometer (Waltz, Efeltrich, Germany).. The minimum fluorescence yield (F0) was determined after a 30-min dark. adaptation followed by illuminating the sample with a low-irradiance measuring light (approx. 0.12 µE m-2 s-1). A saturating pulse of white light (0.8 s, 10,000 µE m-2 s-1) was applied to determine the maximal fluorescence yield (Fm).. The maximal quantum. yield of PS II (Fv/Fm) was determined from the following equation: Fv/Fm = Fm-F0/Fm. Determination of H2O2 Leaves (1 g, FW) frozen in liquid N2 were ground using a pestle and mortar with 1 ml of 3% (v/v) HClO4 containing 2.5 mM EDTA. centrifuged at 12,000 x g for 5 min at 4°C.. The homogenate was. The supernatant was neutralized with 2.5. M KOH to pH 7.5 and then centrifuged at 12,000g for 5 min at 4°C. The supernatant obtained was filtered through a DISMIC-25HP filter (Advantec Toyo, Tokyo, Japan) and then passed through an anion-exchange column (Okuda et al., 1991).. The elute. was used for the determination of H2O2 by the homovanillic acid method with some modifications (Guilbault et al., 1968). Determination of AsA and DAsA AsA and DAsA were measured as described by Wise and Naylor (1987). Leaves (0.5 g, wet weight) frozen in liquid N2 were ground using a pestle and mortar with 5 mL of 6% HClO2 and centrifuged at 10,000g for 10 min at 4°C. A 100 µL-aliquot of the obtained leaf extract was added directly to 900 µL of a 200 mM.
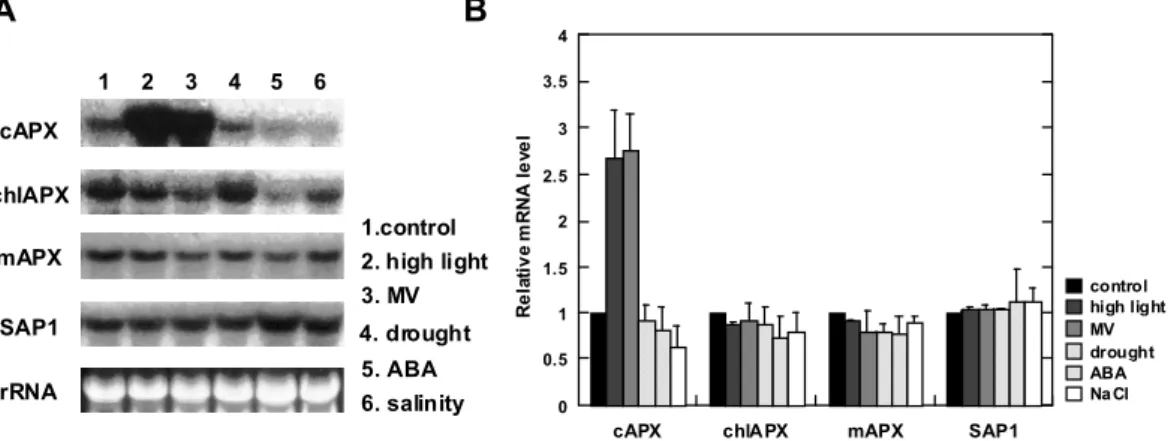
(37) succinate buffer (pH 12.7, adjusted with NaOH) in the spectrophotometer. The final pH was very near 6.0. The absorbance at 265 nm was immediately recorded and again 5 min after the addition of 5 units of AsA oxidase (from Cucurbita sp.; Wako, Osaka, Japan).. For determination of total AsA, the leaf extract was adjusted to pH 6.0 with. 1.25 M K2CO3 and centrifuged at 10,000 x g for 5 min.. The supernatant was. incubated with 10 mM dithiothreitol in HEPES-KOH buffer (pH 7.5) for 10 min at 25°C.. A 100-µl aliquot of the solution was directly added to 900 µl of 200 mM. succinate buffer (pH 6.0) in the spectrophotometer. as described above.. The resultant solution was assayed. The difference between the total AsA and AsA contents was taken. to be the content of DAsA. Results Expression of APX Isoenzymes in Response to Abiotic and Biotic Stresses The transcripts of chlAPX, mAPX, cAPX, and SAP1 were detected at the respective predicted size in 4-week-old spinach leaves (Fig.III-1). A. B 2. 3. 4. 5. 4. 6. 3.5. cAPX chlAPX 1.control. mAPX. 2. high light 3. MV. SAP1. 4. drought 5. ABA. rRNA. 6. salinity. Relative mRNA level. 1. 3 2.5 2 1.5. control high light MV drought ABA Na Cl. 1 0.5 0. cAPX. chlAPX. mAPX. SAP1. Fig. III-1. The changes in the steady-state transcript levels of the APX isoenzymes in response to environmental and chemical stresses.. Four-week-old plants were exposed to stresses of high-light. intensity, salinity, and drought and treatments of ABA and PQ. A, Northern blot analysis of APX isoenzyme transcripts. Total RNAs were isolated from spinach leaves, separated by electrophoresis (30 オg each), blotted on a membrane, and hybridized with cAPX, tAPX, mAPX, and SAP1 cDNA probes. B, Relative mRNA levels.. The mRNA level of each sample was quantified by Mac BAS 2000,. normalized to the respective 18S ribosomal RNA, and represented the mean value ± S.D. of three individual experiments.. The value of the control plants was set equal to 1. Asterisks indicate that the.
(38) mean values are significantly different compared with those of the control plants (P<0.05).. The steady-state transcript level of cAPX in response to either high-light intensity or MV treatment for 1 h increased by approx. 2.7-fold compared with those of the control plants. Under stresses of salinity, drought, and ABA treatment, the transcript levels of cAPX were not altered.. The steady-state transcript levels of chlAPX, mAPX, and. SAP1 were also not changed in response to any of the stresses and treatments.. The. same results were obtained for the total RNAs prepared from 2- or 8-week-old plants (data not shown). Expression of APX Isoenzymes in Response to High-light Intensity and Following Its Recovery Changes in Photosynthetic Parameters Four-week-old plants were subjected to high-light intensity at 1,600 µE m-2 s-1 for 1, 3, and 5 h and compared to the control plants of the same developmental stage. Recovery from high-light stress was analyzed by reexposure to the illumination at 300 µE m-2 s-1 and sampling 2 and 48 h later.. CO2 fixation decreased by approx. 30% (Fig.. III-2A) and PS II activity (Fv/Fm) dropped after 1 h reaching a minimum after 5 h of. B. A. 0.8. 8 *. *. *. 6. *. 0.7. Fv/Fm. Rate of photosynthesis (µmol CO2 m-2 s-1). 10. 4. *. 0.6. 2. 0 0 0. 1. 2. 3. high light (h). 4. 5. 2. 48. recovery (h). 0. 1. 2. 3. 4. high light (h). 5. 2. 48. recovery (h). Fig. III-2. Photosynthetic parameters measured in spinach leaves exposed to high-light stress. Four-week-old plants were exposed to high-light intensity at 1600 E m-2 s-1. After 5 h, stressed-plants were reexposed to moderate light at 300 E m-2 s-1.. The CO2 fixation (A) and the chlorophyll. fluorescence (Fv/Fm) (B) were measured as described in the MATERIALS AND METHODS section. The data represented are the mean value ± S.D. of three individual experiments.. Filled circles, control. plants; open circles, stressed plants. Asterisks indicate that the mean values are significantly different.
(39) compared with those of the control plants (P<0.05).. high-light (Fig. III-2B). After 48 h of recovery, PS II activity and CO2 fixation reached almost the same values as those in the control plants.. The restoration of the. CO2 fixation and the PS II activity during the recovery period from stress indicated that the high-light intensity for 5 h causes mild-stress to the spinach leaves. Changes in Transcript and Protein Levels and Activity of APX Isoenzymes As shown in Fig.III-3, A and B, the transcript abundance of cAPX remarkably increased after 1 h, which was in agreement with the result in Fig. III-1 and reached a peak after 3 h of the high-light period. In addition, during the recovery period from stress, the transcript abundance gradually decreased and returned to nearly the control level after 48 h in the recovered-plants. However, in the high-light stressed- and recovered-plants, no significant changes in the transcript levels were detected in chlAPX, mAPX, and SAP1, confirming the data shown in Fig. III-1. The protein level of each APX isoenzyme was detected by immunoblotting using mAb-I raised against spinach sAPX (the preparation and characterization of this monoclonal antibody will be described elsewhere) and EAP1 raised against Euglena cAPX (Ishikawa et al., 1996b).. The mAb-I reacted with both the 33 and 38 kDa bands. of sAPX and tAPX, respectively, present in the crude homogenate from the spinach A. B cAPX. control 4. high light. chlAPX control. . cAPX. 3. . 2 Relative mRNA level. high light. mAPX control high light. SAP1 control. mAPX. . . 1 0 4. SAP1. chlAPX. 3 2. high light. 1. rRNA control. 0 0. high light 0 1 3 high light. 1. 2. 3. 4. high light (h) 5. 2 48 (h) recovery. 5. 2. 48. recovery (h). 0. 1. 2. 3. 4. high light (h). 5. 2. 48. recovery (h).
(40) Fig. III-3. (Continues on facing page.).
(41) C. D 4. control high light. Relative Protein level. control high light control high light control high light. cAPX. tA PX. sAPX. mAPX. 3. 0. 1. 3. 5. high light. 2. 48 (h). 2 1 0 4 3 2. recovery. 1 0 0. 1. 2. 3. 4. 5. 2. high light (h). 48. 0. recovery (h). 1. 2. 3. 4. 5. high light (h). 2. 48. recovery (h). E 0.7. cAPX . 0.6. tAPX. . . 0.5. APX activity (µmol min-1 mg-1 protein). 0.4 0.3. . 0.2. . . 0.1 0 0.7 0.6. mAPX. sAPX. 0.5 0.4 0.3. . 0.2. . . . 0.1 0 0. 1. 2. 3. 4. high light (h). 5. 2. 48. 0. 1. recovery (h). 2. 3. high light (h). 4. 5. 2. 48. recovery (h). Fig. III-3. The effect of high-light intensity and its recovery on transcript and protein levels and activities of APX isoenzymes.. (A) Northern blot analysis.. Each APX isoenzyme transcript was detected as. described in the legend of Fig.III-1. (B) Relative mRNA levels. The mRNA levels of each sample were quantified by Mac BAS 2000, normalized to the respective 18S ribosomal RNA, and represented the mean value ± S.D. of three individual experiments. Immunoblot analysis.. The value at time 0 was set to 1.. (C). The crude homogenates (50 g each) of spinach leaves were subjected to. SDS-PAGE and immunoblotting using mAb-I for sAPX and tAPX or EAP1 for cAPX and mAPX as described in the MATERIALS AND METHODS section. (D) Relative protein levels. The protein levels of each sample were densitometrically quantified and represent the mean value ± S.D. of three.
(42) individual experiments.. The value at time 0 was set to 1. (E) Activities. Detailed procedures are. described in the MATERIALS AND METHODS section. The data represented are the mean value ± S.D. of three individual experiments.. Filled circles, control plants; open circles, stressed plants.. Asterisks indicate that the mean values are significantly different compared with those of the control plants (P<0.05).. leaves (Fig. III-3, C and D).. EAP1 reacted with the 28 and 31 kDa bands of cAPX and. mAPX, respectively. With either antibodies used, no other cross-reactive bands were detected. An increase in cAPX protein was not detected during high-light stress or recovery. The protein levels of the other isoenzymes were also not changed. The cAPX activity increased approx. 1.7-fold during the high-light stress and returned to nearly the control level during recovery period (Fig. IV-3E). activity was not changed.. The mAPX. The decreases in both tAPX and sAPX activities were found. during the high-light stress.. After 5 h of high-light intensity, plants contained 46%. lower activities of both the tAPX and sAPX when compared to the control plants. During the recovery from the high-light stress, the activities of tAPX and sAPX returned to almost the same values as those in the control plants. Changes in H2O2 and AsA Levels In the control plants, the H2O2 level did not significantly change during the experimental period (Fig. IV-4). In contrast, a transient increase (119%) in the H2O2 level was observed at 1 h in the high-light stressed-plants.. Subsequently, the H2O2. level rapidly decreased and after 5 h, reached almost the same value as that in the Fig. III-4. The effect of high-light stress and. 1200. . its recovery on H2O2 level.. nmol g-1 FW. 1000. The data. represented are the mean value ± S.D. of. 800. 600. three individual experiments. Filled circles,. 400. control plants; open circles, stressed plants.. 200. Asterisks indicate that the mean values are significantly different compared with those. 0 0. 1. 2. 3. high light (h). 4. 5. 2. 48. recovery (h). of the control plants (P<0.05)..
(43) control plants.. In order to investigate the redox status of ascorbate in whole cells. during high-light stress, the AsA and DAsA levels were assayed.. The AsA level in the. high-light stressed-plants was not changed, whereas the DAsA level increased approx. 3.0-fold after 5 h of the high-light period (Fig. IV-5).. After 48 h in recovering plants,. the DAsA level reached almost the same value as in the control plants. As a result, the decrease in the redox status of ascorbate [AsA/(AsA + DAsA)] was observed.. µmol g-1 FW. 4. AsA. 3 2 1 0 1.2. 1. . 0.8. . 0.6 0.4. 0.8 0.7 0.6. 0.2 0. AsA / (AsA+DAsA). 0.9. Ratio. µmol g-1 FW. 1. . DAsA. 0 0. 1. 2. 3. 4. high light (h). 5. 2. 48. recovery (h). 0. 1. 2. 3. 4. high light (h). 5. 2. 48. recovery (h). Fig. III-5. The effect of high-light intensity and its recovery on the levels of AsA and DAsA and the redox status of ascorbate. The redox status of ascorbate [AsA/(AsA + DAsA)] was calculated. The data represented are the mean value ± S.D. of three individual experiments. Filled circles, control plants; open circles, stressed plants.. Asterisks indicate that the mean values are significantly different. compared with those of the control plants (P<0.05).. Discussion Only the cAPX transcript levels increased in the high-light stressed and MV treated-plants, that is known to cause photooxidative stress (Fig. III-1).. Similar. observations of cAPX induction by MV or high-light stress were reported in pea, maize, rice, and Arabidopsis (Pastori and Trippi, 1992; Mittler and Zilinskas, 1992; Donahue et.
(44) al., 1997; Morita et al., 1999; Karpinski et al., 1997; Storozhenko et al., 1998). It seems likely that the induction in the cAPX expression during an early stage of oxidative stress plays an important role in removing H2O2 and minimizing photooxidative damage.. Transgenic tobacco plants expressing antisense RNA for. cAPX show increased susceptibility to ozone (Örvar and Ellis, 1997). Furthermore, overexpression of cAPX in tobacco plants provides increased resistance against MV treatment (Allen et al., 1997). To confirm the early response of APX isoenzymes under high-light stress, I analyzed the changes in the transcript and protein levels and activities of each isoenzyme during the progression of high-light intensity and following its recovery (Fig. III-3, A-E).. The cAPX transcript level reached a maximum in 3 h; however, the level. of cAPX protein was hardly changed, while the cAPX activity increased in response to the high-light intensity.. Mittler and Zillinskas (1994) have reported that during. recovery from drought stress, a cAPX expression in pea leaves is regulated at the post-transcriptional levels, which is at least in part at the level of protein synthesis, protein stability and/or enzyme activation.. Furthermore, during pathogen-induced. programmed cell death in tobacco leaves, the cAPX expression was suppressed by inhibition of the protein synthesis in the polysome (Mittler et al., 1998). Based on our present data and the data reported so far, it is clear that protein level of cAPX does not directly correlate with the increase in transcript level and activity. Therefore, It is likely that the activation state of cAPX pool increases under high-light stress. The inconsistencies between the unchanged level of protein and increase in activity for cAPX will be clarified by further analysis, such as the effect of a mRNA or protein synthesis inhibitor. The level of H2O2 reached a peak at 1 h during the progression of high-light intensity followed by a rapid decrease and then returning to the initial level of the control plants at 5 h (Fig. III-4). It has been suggested that H2O2 functions as a second messenger in plant cells exposed to environmental stresses such as chilling (Prasad et al., 1994), heat (Dat et al., 1998), and pathogen defense (Levine et al., 1994).. The. response of the spinach cAPX to oxidative stress caused by high-light and MV, therefore, may be mediated by the transient accumulation of H2O2.. The subsequent. rapid decrease in H2O2 level may be caused by the increase in the cAPX activity (Figs. III-3, E and 4). The transient accumulation of H2O2 following cAPX expression has.
図


+7


関連したドキュメント
Keywords: continuous time random walk, Brownian motion, collision time, skew Young tableaux, tandem queue.. AMS 2000 Subject Classification: Primary:
Answering a question of de la Harpe and Bridson in the Kourovka Notebook, we build the explicit embeddings of the additive group of rational numbers Q in a finitely generated group
Proof.. One can choose Z such that is has contractible connected components. This simply follows from the general fact that under the assumption that the functor i : Gr // T is
In Section 13, we discuss flagged Schur polynomials, vexillary and dominant permutations, and give a simple formula for the polynomials D w , for 312-avoiding permutations.. In
Then it follows immediately from a suitable version of “Hensel’s Lemma” [cf., e.g., the argument of [4], Lemma 2.1] that S may be obtained, as the notation suggests, as the m A
In our previous paper [Ban1], we explicitly calculated the p-adic polylogarithm sheaf on the projective line minus three points, and calculated its specializa- tions to the d-th
Definition An embeddable tiled surface is a tiled surface which is actually achieved as the graph of singular leaves of some embedded orientable surface with closed braid
Abstract The classical abelian invariants of a knot are the Alexander module, which is the first homology group of the the unique infinite cyclic covering space of S 3 − K ,
