Shanghai's Attractiveness and Relational Power
within the Chinese Urban Network
著者
LI Xiande, KRATKE Stefan
journal or
publication title
The science reports of the Tohoku University.
7th series, Geography
volume
61
number
1
page range
1-22
year
2015-08
URL
http://hdl.handle.net/10097/60652
Shanghai’s Attractiveness and Relational Power
within the Chinese Urban Network
Xiande LI*1 and Stefan KRÄTKE*2
Abstract In the era of globalization and informatization, the urban network
repre-sents the main feature of the urban system’s spatial organization. A most important driving force of urban network formation is the spatial networking of firms. In this article, we present an analysis of Shanghai’s positioning within the Chinese urban net-work. We use the listed companies’ annual report data to set up a database on the firms’ network of headquarters and subsidiaries in order to evaluate the attractiveness and relational power of Shanghai within the Chinese urban network in 2005 and 2010. This research leads to three main conclusions : (1) Shanghai and other cities along the coast and the Yangtze River are characterized by a high degree of connectivity in terms of intensive economic ties. Among the cities in East China, North China and South China, Shanghai has strengthened its attractiveness from 2005 to 2010. Based on the power of central government owned enterprises, Shanghai, Beijing and Shenzhen (the three financial centers of China) reveal the strongest economic ties. Thus the Chinese urban system shows a clear hierarchy in terms of network centrality. (2) Shanghai strengthened its connectivity with cities in East China, North China, South China and the Shandong region from 2005 to 2010. The main investment destinations for listed companies of Shanghai were cities located in proximity to Shanghai. However, Shang-hai also increased its outward impact (radiation) in terms of connectivity to other eco-nomic centres of China such as Beijing. (3) Our regression analysis revealed that the city’s GDP had a positive effect on Shanghai’s economic interaction with other Chinese cities, where as administrative hierarchy, population size and labor cost did not pass the significance test. In 2005, land cost had a significant effect on Shanghai’s connectivity, yet in 2010 this variable did not prove to have a significant impact.
Key words : urban network, listed companies, attractiveness, relational power,
Shang-hai
*1Department of Geography, Shanghai Normal University, Shanghai, China
E-mail : [email protected]
*2 Department of Economic and Social Geography, European University Viadrina, Frankfurt (Oder),
Ger-many
E-mail : [email protected]
1. Introduction
Taylor (2004) pointed out that cities could not be understood as isolated entities. He emphasized that processes of networking are a key factor of the development of cities. The
rapid development of transport and communication technologies has fostered a strong expan-sion of interaction between cities (Taylor et al., 2007). Castells (2010) emphasized the impor-tance of the “space of flows” and indicated that networking has been a fundamental driving force of urban development. Taylor (2010) argued that the ongoing development of interurban connections has led to the formation of a complex urban network. According to diverse empir-ical studies, company headquarters and the firms’ network of branch establishments are func-tioning as a backbone of urban network formation (Derudder, 2006 ; Wall, 2009 ; Krätke, 2014). With regard to the gravitational force of cities, Zhou (1998) distinguished between the cit-ies’ attractiveness and their outward impact (radiation). Alderson and Beckfield (2004) used social network analysis in order to analyze the functioning of gravitational forces within the world city network. In detail, they used the measures of a city’s in-degree and out-degree as representing the attractiveness and outward impact (radiation) of a city within the urban net-work. Alderson and Beckfield (2004) also introduced sociological concepts such as the reputa-tion and power of cities in their analysis, arguing that high attractiveness signifies a city’s high reputation where as a city’s outward impact (radiation) signifies its relational power. Accord-ing to Wall et al. (2011), a city’s economic control and command capacities are most important with regard to hierarchical relations within the urban system.
Shanghai represents China’s largest economic center and plays an outstanding role in Chi-na’s urban network (Wang and Ning, 2004 ; Wu and Ning, 2012). Due to the limited availabil-ity of relational data on interurban connections, previous studies used attribute data and gravita-tion models for analyzing the interacgravita-tion of cities (Liu, 2010 ; Li, 2012). By contrast, our empirical study starts from the listed companies’ annual reports in order to set up a database on the firms’ headquarter-subsidiaries network. This represents a relational database which enables to reveal the real economic interaction between cities (Li, 2015).
This analysis consists of three parts : The first part describes the data source and the research area. The second part analyzes the relational positioning of Shanghai in the Chinese urban network from the perspective of listed companies’ network ties. We use the number of subsidiaries and amount of investments that are linking other cities to Shanghai as indicators of Shanghai’s attractiveness. Shanghai’s outward ties in terms of the number of subsidiaries and amount of investments that are linking Shanghai to other cities are used as indicators of the city’s radiation or relational power. In the third part, we present an analysis of the factors of network formation (regression analyses).
2. Research data and research area 2.1 Research data source
In 1990, China has set up the Shanghai Stock Exchange and the Shenzhen Stock Exchange. In the year of foundation, only 9 listed companies were registered. On December 31, 2010, the number had increased to 2,038 listed companies. These listed companies have become
the main actors of China’s economy (Li, 2015).
Listed stocks in mainland China can be divided into A-shares and B-shares. A-shares stocks are issued within the territory of China for domestic institutions, organizations and indi-viduals (excluding Hong Kong, Macao and Taiwan). They are traded with Renminbi. B-shares stocks are also issued by domestic companies for investors from Hong Kong, Macao, Taiwan and foreign countries. They are subscribed and traded with foreign currencies. Because all B-share companies have set up A-shares, we only need to check the A-share listed companies’ annual reports for our analysis of network relations. From the website of Shanghai Stock Exchange and Shenzhen Stock Exchange (Li, 2015), we received 1,356 annual reports of 2005 and 2,038 annual reports of 2010.
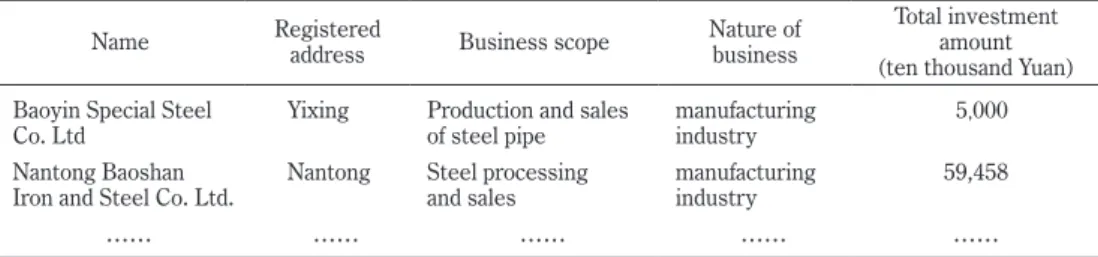
In 1995, the Chinese Ministry of Finance issued the “Interim provisions of consolidated financial statements” which represents the authoritative normative document for the compa-nies’ financial statements. This provision states : “When the parent company prepares the consolidated financial statements, it must list all of domestic and overseas subsidiaries under its control in the consolidated financial statements.” The term ‘control’ means that the parent company must have a share of more than 50% or a ‘substantial’ control of subsidiaries (although the share amounts to less than 50%). The annual report’s consolidated financial statements includes information such as the subsidiary’s name, registered address, business scope, nature of business, and total investment amount. Table 1 shows the consolidated financial statements of the Baosteel Group. The annual reports of listed companies are open to the public and under supervision of the whole society. Our analysis uses the report’s information on subsid-iaries in order to perform a network analysis of inter-urban economic linkages.
This study focuses on subsidiaries located outside their headquarters’ city in order to ana-lyze the cities’ interconnections. The basic spatial units of data processing are the prefectural level city, the sub-provincial city and the municipality. In the particular case of the Hainan province, which only has two prefectural level cities (Haikou and Sanya), we have to use the county or county-level city as the basic spatial unit. According to Table 1, Baosteel Group, whose headquarter is located in Shanghai, has a subsidiary in Yixing, which is a county-level city that belongs to the prefectural level city, namely Wuxi City. Accordingly, we find in the
Table 1 Subsidiaries information in Baosteel Group’s annual report
Name Registered address Business scope Nature of business Total investment amount (ten thousand Yuan) Baoyin Special Steel
Co. Ltd Yixing Production and salesof steel pipe manufacturing industry 5,000 Nantong Baoshan
Iron and Steel Co. Ltd. Nantong Steel processing and sales manufacturing industry 59,458
…… …… …… …… ……
head quar ter-subsidiaries network database one record indicating that Shanghai has an eco-nomic-organizational link to a subsidiary firm in Wuxi City, and the amount of investment is 50,000,000 Yuan (Table 1). The complete network data base includes all recorded links of the companies included.
2.2 Research area definition
Zhou and Zhang (2003) used foreign freight flow, railway passenger flow, and population movements in order to delimit the urban economic regions of China (Figure 1). First, they analyzed the centrality of Chinese cities by means of identifying central cities and their hinter-land in accordance with the main direction of economic interactions. Finally, they proposed their scheme of Chinese urban economic regions : North China (Beijing, Tianjin, Hebei, Shanxi, Inner Mongolia except of Hulun Buir City, Xing’an League, Tongliao City, Chifeng City, Alxa League, Henan except of Nanyang Xinyang City, Zhumadian) ; East China (Shanghai, Jiangsu, Zhejiang, Anhui, Jiangxi except of Ji’an and Ganzhou) ; South China (Guangdong, Hunan, Guangxi, Hunan, Jiangxi, Ji’an, Ganzhou) ; Northeast China (Liaoning, Jilin, Heilongjiang, Hulun Buir City, Xing’an League, Tongliao City, Chifeng City of Inner Mongolia), Southwest China (Chongqing, Sichuan, Yunnan, Guizhou) ; Northwest China (Shaanxi, Gansu, Qinghai, Ningxia, Alxa League of Inner Mongolia, Xinjiang), Tibet, Shandong, Fujian, Hubei (Hubei
prov-Figure 1 Chinese urban economic regions Source : Zhou and Zhang (2003)
ince, Nanyang City, Xinyang City, Zhumadian City of Henan province).
This scheme forms a basis of our study about the interaction between Shanghai and other city-regions. In order to reveal the spatial structure of the Yangtze River Delta in more detail, our research additionally divided East China into Jiangsu, Zhejiang, Anhu and North Jiangxi (Jiangxi except of Ji’an and Ganzhou).
3. Analysis of gravitation effects of Shanghai in the Chinese urban network 3.1 Analysis of attractiveness
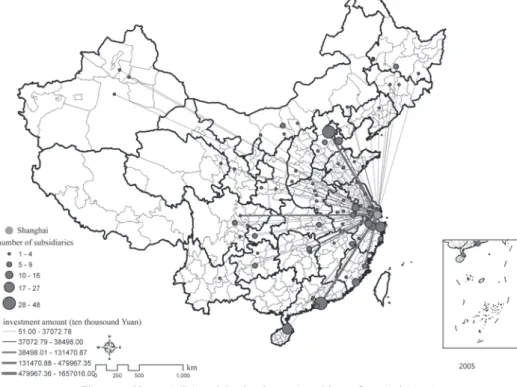
From 2005 to 2010, Shanghai significantly increased its attractiveness within the Chinese urban network. In 2010, listed companies from 107 cities established in total 683 subsidiaries in Shanghai. The total investment amount was 110.99 billion Yuan. Compared with the situ-ation in 2005, the number of cities whose companies had subsidiaries in Shanghai increased by 25, and the number of subsidiaries (in Shanghai) increased by 50.31% ; the amount of invest-ment increased 6.01 times. Cities represent the basic anchoring points of firm networks (Abe, 1984, 1995 ; Hino, 1984). Subsidiaries from other cities’ listed companies are important ele-ments in the firm network, functioning as a platform for gathering capital, technology,
informa-Figure 2 Network links originating from other cities to Shanghai (2005) Source : listed companies headquarter-subsidiary network database
tion and other factors. These subsidiaries link other cities to Shanghai, and thus contribute to urban network formation (Figure 2 and Figure 3).
3.1.1 Shanghai’s increased attractiveness to East China, South China and North China
From 2005 to 2010, subsidiaries in Shanghai originating from Northwest China decreased. The Tibet region did not have any subsidiaries in Shanghai. Yet the number of subsidiaries originating from other regions increased considerably (Figure 4). Listed companies from East China, South China and North China set up 199, 182, 169 subsidiaries in Shanghai respectively. The respective shares amounted to 28.76%, 26.30% and 24.42%, the total share of these regions reached 79.48% in 2010 as compared to 74.10% in 2005. These data clearly indicate Shanghai’s increasing locational attractiveness with regard to the above-mentioned regions’ companies. Indeed, these three regions are forming China’s economic heartland, similar to the North East Megalopolis of the United States (Gottmann, 1987) and the Tokaido Megalopolis of Japan (Murayama, 2000).
Subsidiaries from North China, South China and East China invested 59.81, 19.74 and 10.35 billion Yuan respectively in Shanghai, the share of which was 60.50%, 19.97% and 10.47%.
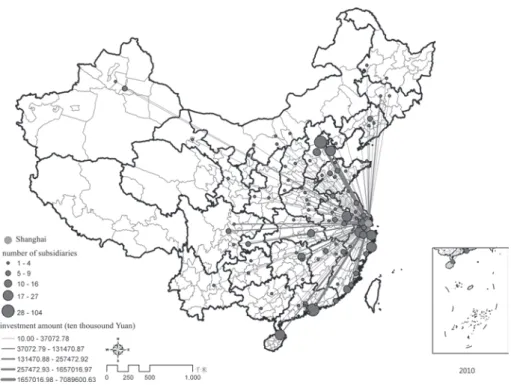
Figure 3 Network links originating from other cities to Shanghai (2010) Source : listed companies headquarter-subsidiary network database
The total share of these three urban regions amounted to 90.95% in 2010 as compared to 75.86% in 2005. The sharp rise of North China’s regional share is clearly visible (Figure 5). Of the North China’s investment to Shanghai, a share of 94.52% originated from Beijing. The rise of Beijing in the Chinese urban network is mainly due to the agglomeration of central gov-ernment owned enterprises’ headquarters (Pan et al., 2013).
Inside the region of East China, companies located in Jiangsu and Zhejiang set up 162 sub-sidiaries in Shanghai in 2010, accounting for 81.41% of East China’s share and 23.41% of total China. Anhui and North Jiangxi set up 37 subsidiaries in Shanghai, which amounts to 18.59% of East China’s share and to only 5.34% of total China. Thus Jiangsu and Zhejiang appear as the most important hinterland of Shanghai, whereas Anhui and North Jiangxi show compara-tively weak economic interlinks with Shanghai.
3.1.2 Shanghai’s increased attractiveness to cities located along the Yangtze River and eastern coast
Shanghai, which functions as a most important intersection point of the Chinese T-shaped development axis (Zhang and Lu, 2010), has also increased its attractiveness to the firms located in cities along the Yangtze River and eastern coast. 17 cities that are situated along
Figure 4 Number of subsidiaries in Shanghai originating from Chinese urban economic regions (2005 and 2010)
the Yangtze River set up 172 subsidiaries in Shanghai, with a total amount of investment of 11.76 billion Yuan in 2010. 67 coastal cities set up 578 subsidiaries in Shanghai, and the total investment amounted to 205.49 billion Yuan. The total share of the number of subsidiaries and the amount of investments originating from cities along the Yangtze River and Eastern coast were 80.47% and 89.94% respectively. Compared to 2005, the number of subsidiaries and the amount of investments increased by 13.25% and 23.61% respectively. In conclusion, Shanghai and the cities along the Yangtze River and eastern coast are characterized by a strong increase of economic interaction.
Furthermore, Shanghai’s attractiveness to cities along the Yangtze River and coastal area shows the characteristics of a hierarchical diffusion. Companies located in metropolis such as Shenzhen, Beijing, Haikou, Hangzhou, Tianjin, Ningbo, Taizhou, Nanjing, Suzhou, Xiamen set up 392 subsidiaries in Shanghai, including an investment of 96.72 billion Yuan. The respective shares were 56.65% and 87.21% in 2010. Compared to 2005, these shares increased by 21.7% and 47.28% respectively.
Figure 5 Subsidiaries investment amount in Shanghai originating from Chinese urban economic regions (2005 and 2010)
3.1.3 The role of central government owned enterprises in the formation of economic interlinks between Shanghai, Beijing and Shenzhen
Shanghai, Beijing and Shenzhen are functioning as financial centers of China’s economy. The power of central government owned enterprises has led to a strong increase of Shanghai’s attractiveness to Shenzhen and Beijing. Central government owned enterprises’ consolidated their dominant position in the Chinese urban network (Li, 2015).
Companies located in Shenzhen have set up 112 subsidiaries and invested 17.47 billion Yuan in Shanghai, accounting for a share of 16.18% and 17.67% of China respectively. Com-pared with 2005, the increase in the share of the number of subsidiaries and sum of investment amounted to 2.96% and 0.77% respectively. This finding indicated that from 2005 to 2010 Shenzhen further strengthened its economic ties with Shanghai.
Shenzhen’s listed companies of the economic branches of real estate, machinery and equip-ment, transportation, financial services and information services represented the main actors investing in Shanghai. Real estate companies from Shenzhen became the most important sec-tor for investments in Shanghai, since 11 real estate companies of Shenzhen set up 53 subsid-iaries and invested 10.66 billion Yuan in Shanghai, the shares of which were 46.42% and 61.03% respectively. Among the Shenzhen firms investing in Shanghai, the subsector of financial ser-vices appears on the second rank. Financial enterprises such as China Ping An, China Mer-chants Bank, CITIC Securities set up 7 subsidiaries in Shanghai. The amount of investments has reached 4.55 billion Yuan, accounting for a share of 26.03% of investments from Shenzhen.
Table 2 shows a listing of some central government owned enterprises from Shenzhen which have made investments in Shanghai (see Table 2). In 2005, two central government owned enterprises, namely China Merchants Property and China International Marine Contain-ers (CIMC) set up 13 subsidiaries in Shanghai, the total amount of investments was 5.65 billion Yuan. The proportion of Shenzhen was 22.92% and 18.90% respectively. In 2010, the central government owned enterprises considerably increased their investment in Shanghai. In 2010, the central government owned enterprises from Shenzhen set up 26 subsidiaries and invested 16.93 billion Yuan in Shanghai, accounting for 96.94% of Shenzhen’s total investment and 17.13% of total national investment in Shanghai. Central government owned enterprises from Shenzhen became a main force of investment in Shanghai. In 2010, these central government owned enterprises were based in the economic branches of real estate development, financial services and manufacturing of shipping containers. It was noteworthy that the shipping con-tainer manufacturing firm CIMC also engaged in real estate business activity in Shanghai, which represented the most important real estate market of the Chinese economy.
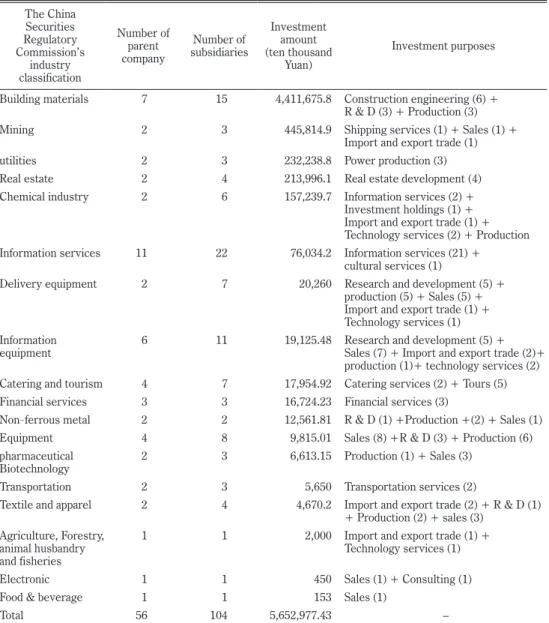
In 2010, companies located in Beijing set up 104 subsidiaries and invested 56.53 billion Yuan in Shanghai. This represents a share of 15.25% with regard to the number of subsidiar-ies and 57.19% of the total amount of investments. Compared to 2005, the shares increased by 4.51% and 26.86% respectively. These data reveal that Beijing further strengthened its economic ties with Shanghai.
Beijing’s listed companies’ investment in Shanghai was mainly concentrated in the sectors of information services, information equipment, and building materials industries. The num-ber of subsidiaries belonging to these three industries was 22, 15, and 11 respectively. The subsidiaries of the information services industry provided software, information services and cultural services, whereas subsidiaries of the information equipment industry firms concen-trated on sales and R&D. The building materials industry’s subsidiaries in Shanghai were pri-marily active inconstruction projects. The total amount of investment of this capital-intensive industry was up to 441.17 billion Yuan, accounting for 78.04% of Beijing’s investment to Shang-hai.
Furthermore, Beijing’s central government owned enterprises invested a lot in Shanghai (Table 3). In 2005, five central government owned enterprises based in Beijing set up subsid-iaries in Shanghai (accounting for 1.93% of the subsidsubsid-iaries and 2.82% of the amount of
invest-Table 2 Shenzhen’s central government owned enterprises’ investments in Shanghai (2010)
Parent company The China Securities Regulatory Commission’s industry classification Number of subsidiaries Investment amount (ten thousand Yuan) Share of total investment amount in China Investment purposes China Merchants Property
Real estate 9 51,488 0.52% Real estate (8)+
Property management (1)
OCT Real estate 6 319,219.3 3.23% Real estate (5)+
Investment holdings ChinaPing
An Financial services 5 452,621.2 4.58% Insurance services (2)+Financial services (1)+ investment holdings (1)+ E-commerce (1)
COFCO
Property Real estate 2 20,427 0.21% Real estate (2)
CITIC
Securities Financial services 1 9.93 0.00% Advisory
China Merchants Bank
Financial services 1 2,000 0.02% Financial services
CATIC Real
Estate Real estate 1 780 0.01% Hotel service
CIMC Equipment 1 846,545.4 8.56% Production (5)+Sales (4)+
Logistics warehousing( 3)+ Consulting (3)+
Real estate (1)
Total 26 1,693,090.81 17.13%
Source : listed companies headquarter-subsidiaries network database
Note : Since a company may have more than one investment purpose, the total number of statistical categories of investment purposes may exceed the number of subsidiaries.
ments). Huaneng Power International represented the enterprise with the largest investment in Shanghai. Its Shanghai subsidiary engaged in electricity production with an investment of 380 million Yuan.
Table 3 Sectoral distribution of Beijing’s listed companies investing in Shanghai (2010) The China Securities Regulatory Commission’s industry classification Number of parent company Number of subsidiaries Investment amount (ten thousand Yuan) Investment purposes
Building materials 7 15 4,411,675.8 Construction engineering (6) + R & D (3) + Production (3)
Mining 2 3 445,814.9 Shipping services (1) + Sales (1) +
Import and export trade (1)
utilities 2 3 232,238.8 Power production (3)
Real estate 2 4 213,996.1 Real estate development (4)
Chemical industry 2 6 157,239.7 Information services (2) +
Investment holdings (1) + Import and export trade (1) + Technology services (2) + Production Information services 11 22 76,034.2 Information services (21) +
cultural services (1)
Delivery equipment 2 7 20,260 Research and development (5) +
production (5) + Sales (5) + Import and export trade (1) + Technology services (1) Information
equipment 6 11 19,125.48 Research and development (5) + Sales (7) + Import and export trade (2)+ production (1)+ technology services (2) Catering and tourism 4 7 17,954.92 Catering services (2) + Tours (5)
Financial services 3 3 16,724.23 Financial services (3)
Non-ferrous metal 2 2 12,561.81 R & D (1) +Production +(2) + Sales (1)
Equipment 4 8 9,815.01 Sales (8) +R & D (3) + Production (6)
pharmaceutical
Biotechnology 2 3 6,613.15 Production (1) + Sales (3)
Transportation 2 3 5,650 Transportation services (2)
Textile and apparel 2 4 4,670.2 Import and export trade (2) + R & D (1) + Production (2) + sales (3)
Agriculture, Forestry, animal husbandry and fisheries
1 1 2,000 Import and export trade (1) +
Technology services (1)
Electronic 1 1 450 Sales (1) + Consulting (1)
Food & beverage 1 1 153 Sales (1)
Total 56 104 5,652,977.43 –
Source : listed companies headquarter-subsidiaries network database
Note : Since a company may have more than one investment purpose, the total number of statistical categories for investment purposes may exceed the number of subsidiaries.
In 2010, 15 central government owned enterprises from Beijing set up 35 subsidiaries in Shanghai, with a total investment amount of 51.07 billion Yuan. These data represent a share of 33.65% and 90.34% respectively of Beijing’s enterprises’ activity. The amount of these investments reached a share of 52.15% of Beijing’s enterprises’ activity in China. Compared to 2005, the central government owned enterprises’ investment in Shanghai showed a strong increase. The flow of the listed companies’ capital from Beijing to Shanghai originated for the most part from these central government owned enterprises. For example, the share of investments of China Metallurgical, China Construction, China Railway Construction’s projects in Shanghai reached 45.5% of the total investment in China (Table 4). Thus Beijing’s central government owned enterprises exert a quite strong influence on Shanghai’s economy. On this background, the Shanghai Municipal Commission of Economy and Informatization set up the Service for Central Government Owned Enterprises Department in 2009 in order to attract more branches of central government owned enterprises. Yet the agglomeration of subsidiar-ies in Shanghai, which can be interpreted as a manifestation of the city’s attractiveness and rep-utation, does not lead to a strengthening of Shanghai’s relational power within the Chinese urban network (see also Alderson and Beckfield, 2004). In a similar way, Hino (1996) argued that the city of Sendai is functioning as a Shiten Toshi (Branch Agglomeration City), whose economy is still under the control of Tokyo’s powerful headquarter economy. For Shanghai, it
Table 4 Beijing’s central government owned enterprises’ investment in Shanghai
Parent company
The China Securities Regulatory Commission’s industry classification Number of subsidiaries Investment amount (ten thousand Yuan) Share of China
China Metallurgical Building materials 4 3,931,744 40.14%
China Railway Construction Building materials 2 159,624.8 1.63%
Coal Energy Extractive industries 2 365,814.9 3.73%
Chinese Architecture Building materials 2 288,338.3 2.94%
GD Utilities 1 133,759.8 1.37%
Huaneng Power International Utilities 2 98,479 1.01%
ChinaShenhua Extractive industries 1 80,000 0.82%
China Heavy Industries Delivery equipment 6 19,910 0.20%
China Petrochemical Chemical industry 1 7,250 0.07%
ChinaInternational Travel Service Catering and tourism 4 6,109.92 0.06% Sinotrans Air Transportation
Development Transportation 2 5,450 0.06%
Aerospace Information Information services 3 5,303.6 0.05%
China Chemical Building materials 1 3,606.8 0.04%
Datang Telecom Information equipment 3 1,506 0.02%
Air China Transportation 1 200 0.00%
is facing huge challenge to develop a strong headquarter economy containing command and control capacities rather than a branch economy that rests under control of other cities’ firm headquarters.
3.2 Shanghai’s relational power within the Chinese urban network
In 2010, Shanghai’s listed companies set up 931 subsidiaries in 148 other cities. The investment amounted to 105.16 billion Yuan. Compared to 2005, the number of cities with subsidiaries of Shanghai enterprises and the related amount of investments increased by 33.33% and 23.39% respectively. This finding proves that Shanghai has considerably strength-ened its outward impact (radiation) within the Chinese urban network (Figure 6 and Figure 7).
3.2.1 Shanghai’s outward impact on East China, North China and South China
First, our research detects a spatial imbalance of Shanghai’s outward impact on other regions of China. The city’s relational power is to a large extent concentrated on the regions of East China, North China and South China. Enterprises located in Shanghai set up 400, 114 and 108 subsidiaries in East China, North China and South China respectively. The respective
Figure 6 Network links originating from Shanghai to other cities (2005) Source : listed companies headquarter-subsidiaries network database
shares amounted to 42.92%, 12.23% and 11.59%, accounting for 66.74% of China. In particu-lar, an outstanding position of East China has been detected (Figure 8).
Anhui and the North Jiangxi region contained only 41 subsidiaries of Shanghai’s listed com-panies in 2005 and 48 subsidiaries in 2010. In East China, these regions’ share amounted to 12% and 15.59% respectively. Indeed, the role of Anhui and North Jiangxi, which form a part of the Pan-Yangtze River Delta, is rather marginal with regard to Shanghai’s outward economic links. These regions’network links with Shanghai —similar to the Tohoku region’s relation-ship with Tokyo— still need to be strengthened in order to integrate with Shanghai’s economy.
As regards the amount of investments, Shanghai based firms invested much more in East China than in North China. In 2010, Shanghai based firms invested 41.88 billion Yuan in East China, 15.28 billion Yuan in North China, 10.75 billion Yuan in Shandong, and 6.85 billion Yuan in South China, accounting for 84.40% of the total sum of investments in China (Figure 8).
In 2010, Shanghai’s listed companies for the first time set up one subsidiary in Lhasa. Due to the alpine geographical environment and comparatively weak economic development in Tibet, the economic links between Shanghai and Tibet remain very limited.
Second, Shanghai’s outward linkages display the characteristics of a neighbourly diffusion.
Figure 7 Network links originating from Shanghai to other cities (2010) Source : listed companies headquarter-subsidiaries network database
In 2005 and 2010, Shanghai’s listed companies set up 229 and 352 subsidiaries respectively in the provinces of Jiangsu and Zhejiang, which are situated in relatively close proximity to Shang-hai. The shares of these provinces amounted to 37.77% and 38.42% respectively. In 2005 as well as in 2010, Nanjing and Suzhou were the cities that contained the largest number of sub-sidiaries originating from Shanghai. Thus geographical proximity appears to remain an impor-tant locational factor of Shanghai’s listed companies’ investment activity. Primate cities in the Yangtze River Delta represent a prime destination of Shanghai’s listed companies’ investments.
3.2.2 Shanghai’s outward links to central cities such as Beijing
Shanghai’s investment in cities outside the Yangtze River Delta was characterized by a shape of hierarchical diffusion. Except for Jiangsu and Zhejiang, Shanghai’s investment is con-centrated on a small number of economically central cities. In 2010, Shanghai’s companies had set up more than 20 subsidiaries in Beijing, Chongqing, Chengdu, Shenzhen, Tianjin, Wuhan, Shenyang, Dalian and Qingdao respectively, which amounted to a total number of 264 subsidiar-ies, accounting for 28.33% of subsidiaries originating from Shanghai in China as a whole. This finding indicates that for Shanghai’s listed companies, the size of urban economies represents an important locational factor for outward investments.
It is noteworthy that Shanghai’s outward links to Beijing show a significant increase, and that the largest part of investments from Shanghai to North China was concentrated in
Bei-Figure 8 Number of Shanghai enterprises’ subsidiaries in Chinese urban economic regions (2005 and 2010)
jing. In 2010, Shanghai set up 49 subsidiaries in Beijing, and the sum of investments amounted to 9.40 billion Yuan. Compared to 2005, the number of subsidiaries increased by 11. Accord-ing to the urban network theory presented by Alderson and Beckfield (2004), a city with strong relational power (outward links) will also achieve a greater attractiveness or better reputation because of its powerful positioning within the urban network. Beijing does have a strong rela-tional power within the Chinese urban network and at the same time increased its reputation.
We also checked the industry classification and ownership structure of Shanghai’s listed companies investing in Beijing. In 2010, five central government owned enterprises based in Shanghai set up 12 subsidiaries in Beijing, investing 5.44 billion Yuan which accounted for 58.09% of the total sum of Shanghai’s investmentsto Beijing. The largest amount of invest-ment came from China Unicom, a Shanghai based central governinvest-ment owned enterprise. China Unicom invested 5.28 billion Yuan in Beijing, accounting for 56.19% of the total sum of investments from Shanghai to Beijing (Table 5). The rise of central government owned enter-prises in the Chinese economic system is changing the country’s urban network (Ning and Wu, 2011).
4. Influential factors of Shanghai’s positioning within the Chinese urban network 4.1 Theoretical assumptions
4.1.1 Administrative hierarchy effect
Ning (1998) noted that under the socialist market economy system local government has become an important variable of economic development. Liu (2006) termed this phenomenon as representing an “Administrative Economy.” Hino (1996) found that the geographic struc-ture of firm networks has been affected by administrative divisions. He termed this
phenome-Table 5 Investments of Shanghai based central government owned enterprises in Beijing
Parent company CSRC’s Industry Classification Number of subsidiaries Investment amount (ten thousand Yuan) Proportion of investments
in Beijing Business Scope
China
Unicom Information services 9 5,284 56.19% Operations headquarters (1)+Information services (6) + Sales (2)
Shanghai
Putian Information equipment 1 350 0.37% Production + Sales
Sinotex Chemical
industry 1 8,000 0.85% R & D + Sales
Sinochem
International Commercial trade 1 2,350 0.25% Warehousing
Visual media Information
services 1 4,000 0.43% Television service
non as “territoriality” (Hino, 1999). His study detected that prefectural capitals such as Sen-dai, Sapporo, Hiroshima and Fukuoka had significant advantages for functioning as anchoring points of a branch network. Pan et al. (2013) found out that higher administrative level cities offered the information flow and policy advantages that enables to attract corporate headquar-ters and branch offices more easily than other cities.
Accordingly, we propose the first theoretical assumption : (1) Higher administration level cities are both main investment destinations and source of listed companies.
In the quantitative analysis, we set up a dummy variable that accounts for administrative hierarchy. If a city is the national capital, the provincial capital or a city specifically designated in the State Council of China’s plan, this variable gets a value of 1, otherwise the variable is zero. We expect the regression coefficient of this variable and the number of subsidiaries orig-inating from Shanghai as well as the number of subsidiaries directed from outward cities to Shanghai to be positive.
4.1.2 Proximity effect
According to the “center-periphery” concept of the new economic geography, urban eco-nomic activity shows the feature of decay in relation to distance (Lu, 2013). Thus geographic proximity and cultural proximity can lead to increasing regional economic linkages (Lu, 2013). The research literature emphasizes that the Yangtze River Delta represents the most important hinterland of Shanghai (Tang and Zhao, 2010 ; Luo et al., 2011).
Accordingly, we propose the second theoretical assumption : (2) Cities located in the Yang-tze River Delta are both main investment destinations and source of listed companies investing in Shanghai.
We set up a dummy variable for including the proximity effect. If the city is located inthe Yangtze River Delta, this variable gets a value of 1, otherwise this variable is zero. The regression coefficient of this variable and the number of subsidiaries originating from Shanghai as well as the number of subsidiaries directed from outward cities to Shanghai is expected to be positive.
4.1.3 Urban size effect
Research literature on urban economics has emphasized that city size represents one of the key variables of the urban economy (Lu, 2013). In this study, we use GDP and population number (permanent residents number) to represent urban economic size and urban population size respectively.
Thus the third theoretical assumption of our empirical test is : (3) Cities of larger size are both main investment destinations and source of Shanghai’s listed companies.
We expect the regression coefficient of GDP or permanent resident population number and the number of subsidiaries originating from Shanghai as well as the number of subsidiaries directed from outward cities to Shanghai to be positive.
4.1.4 Cost effect
The enterprises’ locational choices need to consider the cost of business, particularly labor cost and land cost (Massey, 1984). Economic geography research shows that firm headquar-ters tend to agglomerate in central cities in order to get easy access to key information, key business partners and the decision-making layer of government (Abe, 1991). Yet the firms’ productive branches are oriented towards lowering cost, so that these functions tend to locate in areas that offer lower labor cost and land cost (Massey, 1984).
In this study, we use annual average land auction prices and annual average wage of work-ers to represent the cost of land and labor respectively.
Accordingly, we propose a forth theoretical assumption : (4) Cities with comparatively low labor cost or land cost are both main investment destinations and source of Shanghai’s listed companies.
The regression coefficient of labor cost or land cost and the number of subsidiaries origi-nating from Shanghai as well as the number of subsidiaries directed from outward cities to Shanghai is expected to be negative.
4.2 Empirical analysis
The empirical analysis is based on data on permanent resident population number, GDP, annual average land auction prices and the annual average wage of workers, which have been extracted from the “China Statistical Year Book for Regional Economic” and the “China City Statistical Yearbook” (2006, 2011).
We used SPSS.17.0 software to normalize the related indicators except for dummy vari-ables. We also performed a multi-collinearity test. In statistical terms, there is a serious problem of multi-collinearity if VIF exceeds a value of 10 (Lu, 2005). In our study, the VIF of all independent variables amounted to less than 6. Therefore we can conclude that multi- col-linearity of independent variables is not seriously interfere with our statistical test.
As a first step of analysis, we used Shanghai’s investment in other cities, i.e. the number of subsidiaries originating from Shanghai as the dependent variable in order to perform an OLS regression analysis for 2005 and 2010. The resulting regression coefficients are shown in Table 6.
As a second step of analysis, we used other cities’ investments in Shanghai in terms of the number of subsidiaries set up by other cities’ firms in Shanghai as the dependent variable in our OLS regression analysis. The resulting regression coefficients are shown in Table 7.
Our regression analysis (see Table 6 and 7) leads to the following conclusions :
(1) The administrative hierarchy effect is not statistically significant, as the regression coefficients of the administrative hierarchy dummy variable did not pass the test of significance.
(2) Shanghai’s relational power (outward impact) within the Chinese urban network is shaped by the proximity effect. The Yangtze River Delta was a major investment destination of Shanghai’s listed companies. Yet Shanghai’s attractiveness for investments originating from
other cities is not determined by a proximity effect. Some enterprises from Yangtze River Delta cities may tend to set up subsidiaries in provincial capital cities such as Nanjing or Hang-zhou rather than in Shanghai.
(3) Shanghai’s attractiveness and relational power within the Chinese urban network is subject to an urban economic size effect. Yet the effect of urban population size did not pass the test of significance. In all our statistical tests, the regression coefficients of GDP were positive and passed the significance test.
(4) The labor cost effect did not prove to be statistically significant. In 2005, land cost was a factor that significantly affected Shanghai’s investment in other cities. Yet in 2010, we could not detect a statistically significant effect of land cost. In 2005, some firms might have chosen high price land to set up their branch network in order to benefit from other locational advantages. However, since 2005 land prices have been subject to a considerable increase, so that under the pressure of high land prices some firms may be expected to set up subsidiaries at locations that offer cheaper land prices.
5. Conclusion
The enterprise network of headquarters and subsidiaries can be regarded as an essential factor of urban network formation (Alderson and Beckfield, 2004). In this study, we used the
Table 6 Influencing factors of Shanghai’s investment to other cities
Independent variable 2005 2010
GDP .754** .793**
annual average land auction prices .225** −.002
Yangtze River Delta cities (dummy variable) .254** .316**
higher administration status city (dummy variable) .085 .144
permanent resident population number −.080 −.039
annual average wage of workers −.197 −.111
Note : (1) ** indicates statistical significance at 1% level.
(2) R-squared of regression in 2005 is 0.613 ; R-squared of regression in 2010 is 0.737.
Table 7 Influencing factors of other cities’ investment to Shanghai
Independent variable 2005 2010
GDP .792** .714**
Yangtze River Delta cities (dummy variable) −.025 −.019
higher administration status city (dummy variable) .042 −.200
permanent resident population number −.1930 .093
Note : (1) ** indicates statistical significance at 1% level.
data of Chinese listed companies to analyze Shanghai’s gravitational force (attractiveness and outward impact) in the Chinese urban network. This research leads to different conclusions : First, Shanghai’s connectivity to the Chinese urban network is characterized by significant regional differences. East China, North China and South China have the comparatively closest links with Shanghai. The Yangtze River Delta is functioning as the most important hinterland of Shanghai. Yet Anhui and North Jiangxi, which form a part of the Pan-Yangtze River Delta, still need to strengthen their ties with Shanghai.
Second, both the attractiveness and relational power (outward impact) of Shanghai in the Chinese urban network are clearly shaped by an urban economic size effect, because interaction and the setting up of network links primarily develops between economically central cities (Yu, 1988). On the other hand, the administrative hierarchy effect, urban population size effect and labor costs effect did not pass the significant test.
Third, we could detect a significant proximity effect concerning Shanghai’s relational power within the Chinese urban network. In 2005, the land cost had a significant effect on Shanghai’s outward investments, yet in 2010 this variable did not prove to be statistically significant.
According to Taylor (2007) we can distinguish two main directions of urban development in the realm of inter-urban networking : If a city only attracts capital from outside and does not export capital (by investment in other cities), it will only be shaped by a “Town-ness” process, rather than attaining “City-ness”, which is associated with a city’s outward impact and its growth towards a modern international metropolis. In order to improve its positioning within the Chinese urban network and to counter major challenges that are related to the strong com-petitive position of Beijing, Shanghai needs to improve its control and command functions and focus on developing a headquarter economy rather than a branch economy.
Acknowledgments
Xiande Li thanks the National Natural Science Foundation of China’s funding (No : 41301168, 41171145) and Professor Masateru Hino of Tohoku university, Japan, Professor Yumin Ning of East China Normal University, China and Professor Yong Jiang of Aichi University, Japan for their great help.
References (*in Chinese, **in Japanese)
Abe, K. (1984) : Head and branch offices of big private enterprises in major cities of Japan. Geographical
Review of Japan (Ser. B), 57, 43-67.
Abe, K. (1991) : Urban System Research of Japan**. Kyoto, Chijin Shobo.
Abe, K. (1995) : The Japanese urban system from the standpoint of large Private firms’ head offices and
branch office. Geographical Review of Japan (Ser. B), 73, 62-84.
Alderson, A.S. and Beckfiled, J. (2004) : Power and position in the world city system. American
Jour-nal of Sociology, 109, 811-851.
Information Age. Urban Studies, 47, 2737-2745.
Derudder, B. (2006) : On conceptual confusion in empirical analyses of a transnational urban network.
Urban Studies, 43, 2027-2046.
Gottmann, J. (1987) : Megalopolis Revisited. College Park, MD : Institute for Urban Studies, University
of Maryland.
Hino, M. (1984) : The location of head and branch offices of large enterprises in Japan. The Science
Reports of Tohoku University, 7th Series (Geography), 34, 41-60.
Hino, M. (1999) : The territoriality of domestic branch offices of Japanese firms as a noneconomic principle
influencing the choice of branch office location. The Science Reports of Tohoku University, 7th Series (Geography), 49, 1-22.
Hino, M. (1996) : Urban Development and Branch Office Location**. Tokyo, Kokon Shoin.
Krätke, S. (2014) : Global pharmaceutical and biotechnology firms’ linkages in the world city
net-work. Urban Studies, 51, 1196-1213.
Li, X. (2011) : Research on the Yangtze River Delta urban agglomeration network structure based on social
network analysis. Urban Studies*, 18, 80-85.
Li, X.D. (2015) : Structure and Evolution of Urban Network*. Beijing, Science Press.
Liu, J.D. (2006) : Perspective of the “administrative region economy” phenomenon in China’s transitional
period : An introduction of human-economic geography with Chinese characteristics*. Economic
Geography, 26, 897-901.
Liu, Z.B. (2010) : Regional Economic Integration in Yangtze River Delta. Beijing, Renmin University of
China Press.
Lu, W.D. (2005) : SPSS for Windows Statistical Analysis (second edition)*. Beijing, Electronic Industry
Press.
Lu, M. (2013) : Power of Space : Geography and Politics and Urban Development*. Shanghai, Gezhi Press,
Shanghai People’s Press.
Luo, Z.D., He, H.M. and Geng, L. (2011) : Analysis of Polycentric Structure of Yangtze River Delta
Based on Passenger Traffic Flow*. Urban Planning Forum, 2, 16-23.
Murayama, Y. (2000) : Japanese Urban System. Dordrecht, Kluwer Academic Publishers. Massey, D. (1984) : Spatial Divisions of Labor. London, Macmillan.
Ning, Y.M. (1998) : New process of urbanization-dynamic and features of urbanization in China since
1990s*. Acta Geographica Sinica, 53, 470-477.
Ning, Y.M. and Wu, Q.B. (2011) : Spatial Organization of Firm and City-region Development. Beijing,
Science Press.
Pan, F.H., Xia, Y.B. and Liu, Z.L. (2013) : The relocation of headquarters of public listed firms in
China : a regional perspective study*. Acta Geographica Sinica, 68, 449-463.
Tang, Z.L. and Zhao, M.X. (2010) : Evolution of cities system in the Yangtze River Delta region system
under economic globalization : analysis of the relationship between network and the value chain segment*. Urban Planning Forum, 1, 29-34.
Taylor, P.J. (2004) : World City Network : A Global Urban Analysis. London and New York, Routledge. Taylor, P.J. ed. (2007) : Cities in Globalization. London and New York, Routledge.
Wall, R.S., Burger, M.J. and Knapp, V.D. Bert. (2011) : The geography of global corporate networks :
the poor, the rich, and the happy few countries. Environment and Planning A, 43, 904-927.
Wall, R.S. (2009) : Netscape : Cities and Global Corporation Networks. Rotterdam, ERIM and Haveka
Publishers.
Wang, M.F. and Ning, Y.M. (2004) : The internet and the rise of information network Cities in China*.
Acta Geographica Sinica, 59, 446-454.
Wu, Q.B. and Ning, Y.M. (2012) : China’s urban network based on spatial organization of electronic
infor-mation enterprises*. Geographical Research, 31, 207-219.
Geographica Sinica, 43, 141-148.
Zhang, L. and Lu, Y.Q. (2010) : Point-Axis System spatial analysis method : a case study of the Yangtze
River Delta Area*. Acta Geographica Sinica, 65, 1534-1547.
Zhou, Y.X. and Zhang, L. (2003) : China’s urban economic region in the open context. Acta Geographica
Sinica, 58, 271-284.