The mechanism of the conversion of
alpha-eleostearic acid into conjugated
linoleic acid
著者
Wu Qiming
学位授与機関
Tohoku University
学位授与番号
11301
The mechanism of the conversion of alpha-eleostearic
acid into conjugated linoleic acid
(α-エレオステアリン酸から共役リノール酸への代謝機構
の解明に関する研究)
Qiming Wu
Contents
Abbreviations: ... II
1. General introduction and background ... - 1 -
2. Materials and Methods ... - 7 -
3. Results ... - 10 -
3.1 Fatty acids composition of oils ... - 10 -
3.2 The conversion of α-ESA into CLA in vivo ... - 19 -
3.3 Characterization of α-ESA saturase in vitro ... - 22 -
3.4 Confirmation of α-ESA saturase ... - 29 -
3.5 Coenzyme NADH in electron transport chain ... - 48 -
3.6 Solubilization and Purification of α-ESA saturase ... - 51 -
4. Discussion and Conclusion ... - 66 -
References ... - 75 -
Abbreviations:
CLA, conjugated linoleic acid; CLnA, conjugated linolenic acid; α-ESA, α-eleostearic acid,; PA, punicic acid;
JA, jacaric acid;
GC, gas chromatography; NEFA, non-esterified fatty acids; TG, triacylglycerol;
FAMEs, fatty acid methyl esters;
NADP+, nicotinamide adenine dinucleotide phosphate;
NAD+, nicotinamide adenine dinucleotide;
TMSN2CH3, trimethylsilyldiazomethane;
Tris-actate, trimethylolaminomethane acetate; DTT, dithiothreitol;
PMSF, phenylmethylsulfonyl fluoride; EDTA, ethylenediaminetetraacetic acid; CYP, cytochrome P450;
CPR, cytochrome P450 reductase; ER, endoplasmic reticulum; COX, Cyclooxygenase;
17-ODYA, 17-octadecynoic acid;
qRT-PCR, real-time quantitative reverse transcriptase polymerase chain reaction; PGA1, prostaglandin A1;
PGE2, prostaglandin E;
LTB4 12-HD/PGR, leukotriene B4 12-hydroxydehydrogenase/15-ketoprostaglandin Delta
13-reductase;
LTB4, leukotriene B4;
LXA4, lipoxin A4;
eWAT, epididymal white adipose tissue; BAT, brown adipose tissue;
1. General introduction and background
Conjugated fatty acids are geometric and positional isomers with several conjugated double bonds. Among conjugated fatty acids, conjugated linoleic acid (CLA; C18:2) is a collective term linoleic acid (cis9,cis12-18:2) with two conjugated double bonds (Fig. 1). More than 28 isoforms of CLA were found due to the various arrangement of positional and geometric variations1). CLA-rich foods are considered as functional foods, because several of them, like
cis-9,trans-11 (c9,t11)- and t10,c12-CLA were reported to have various beneficial effects on physiological functions, such as anti-obesity and anticarcinogenic activities, immune enhancement, bone formation improvement, and lipid metabolism regulation in in vivo and in
vitro studies1,2). And the main sources of CLA for humans are commonly found in dairy
products and ruminant meat. Dairy products are the principal source of CLA in human diets, however, the CLA intake from dietary sources is far from the intended effective dosage due to the low content of CLA in nature3), as the CLA are naturally present in very small amounts in
these foodstuffs which typically contain fat in the range from 2.9 to 8.9 mg/g 4). Accordingly, it
is necessary to supplement the human diet with CLA supplements to reach the intended effective dosage.
However, it is important to note that the balance of the different CLA isoforms is heavily distorted in supplements because the CLA in supplements is not derived from natural foods but prepared by chemically altering the linoleic acid found in vegetable oils, which would lead to generate types of CLA isoforms that are never found in large amounts in nature. Specifically,
the most of the commercially available CLA supplements contain almost equal amounts of the two major isomers c9,t11-CLA (40.85-41.1 %) and t10,c12-CLA (43.5-44.9%), and significant levels of other CLA isomers (4.6%-10%)5). While the c9,t11-CLA is believed to be the most
common natural form of CLA comprising 80 to 90% of the total CLA in food products from ruminants, whereas t10,c12-CLA is present at a level of 3-5%, and other isomers are present in very small amounts 6,7). For these reasons, CLA supplements do not provide the same health
effects as CLA from natural foods. What is more, it has been reported that mice fed the highly purified t10, c12-CLA isomer had adverse side effects such as insulin resistance, robust hyperinsulinemia, and massive liver steatosis 8-10). Furthermore, insulin resistance has also been
detected in obese men treated with purified t10,c12-CLA11), which raises concerns about the
safety of dietary supplements containing the t10,c12-CLA isomer. On the other hand, c9,t11-CLA, which was found to improve the increased insulin resistance caused by t10,c12-CLA9,12),
is considered safer due to fewer reported side effects.
The content of conjugated linolenic acid (CLnA; C18:3) with three conjugated double bonds in seed oil from certain plants can comprise up more than 80% of the total lipid content, which is in contrast to the generally low content of CLA in nature. We are particularly interested in these CLnA-rich seed oils, because CLnA is the only conjugated fatty acid that can be prepared from natural sources in bulk13). For example, α-eleostearic acid (α-ESA; c9,t11,t13-CLnA)
comprises up to 60% (wt/wt) of the total lipid content of bitter gourd seed oil and 76% of the total lipid content of tung seed oil, whereas punicic acid (PA; c9,t11,c13-CLnA) comprises up to 74.5% of the total lipid content of pomegranate seed oil, and jacaric acid (JA;
c8,t10,c12-CLnA) is found at a concentration of 15.9% in jacaranda seed oil. In addition, α-ESA has been reported to have a new confirmed strong antiangiogenic effect 14-17). We first reported that
α-ESA was converted into c9,t11-CLA in 1% α-α-ESA-fed rats18). Moreover, similar conversions
of CLnA into CLA in PA- and JA-fed rats, where PA was converted into c9,t11-CLA and JA was converted into c8,t10-CLA, were also observed in rats13,19). These conversions were also
confirmed in mice and humans by other reporters20-22).
Endogenous CLA synthesis from vaccenic acid (t11-18:1), a major intermediate produced during the ruminal biohydrogenation, is dependent on Δ9-desaturase6,23). And this synthetic
pathway has also been found in rodents24,25), pigs26), and other species27). Another pathway for
endogenous CLA synthesis is formed as an intermediate during the bio-hydrogenation of linoleic acid to stearic acid (18:0) by B.fibrisolvens and other rumen bacteria28). Although the
major source of CLA in humans comes from dietary intake, endogenous synthesis of CLA from vaccenic acid was also been reported in humans29,30) and other non-ruminants25,31,32).
Accordingly, the conversion of CLnA into CLA could be a novel pathway for endogenous CLA synthesis. As CLnA can be prepared more easily than CLA, once the mechanism of this conversion is elucidated, it is expected that CLnA, especially α-ESA will be a new source for CLA synthesis or supplant CLA as a dietary supplement.
Although, we have proved that some specific CLnAs can be converted into their corresponding CLAs, still very little is known of this underlying mechanism (Fig. 2). Our ultimate goal is to elucidate the conversional mechanism of CLnA into CLA by using
multidisciplinary approaches. For this purpose, we focused on the conversion of α-ESA into c9,t11-CLA, which is a representative conversion of CLnA into CLA, and we found that this conversion is a NADPH-dependent enzymatic reaction occurring mostly in the rat liver18,33).
For further research on this conversion, in this dissertation, firstly we aimed to elucidate conversional mechanism of α-ESA into c9,t11-CLA, especially identify the key enzyme α-ESA saturase responsible for this conversion. Secondly, we aimed to solubilize and purify of α-ESA saturase from liver, and this would enable us to study the properties and characteristics of α-ESA saturase. In addition, this dissertation might provide some inspirations for elucidating the conversion of other CLnA, such as PA and JA, into CLA. And it will also help fill the critical knowledge gap of the mechanism of CLnA convert into CLA.
2. Materials and Methods
2.1 Chemicals
Amicon Ultra-15 centrifugal ultrafiltration units (molecular weight cutoff 10 KDa was bought from Millipore (Billerica, MA) and HiPrep Sephacryl S-300 HR column was from GE Healthcare (Tokyo, Japan). Tung oil and standard CLA oil were obtained from the Nisshin OilliO Group, Ltd. Coenzymes (NADPH, NADP+, NADH, and NAD+) were purchased from
Oriental Yeast Co., Ltd. (Tokyo, Japan). Methanol, acetyl chloride, NaOCH3/MeOH,
trimethylsilyldiazomethane (TMSN2CH3), trimethylolaminomethane acetate (tris-actate),
HCl/MeOH, and inhibitors (fluvoxamine, ticlopidine, montelukast, fluconazole, chlormethiazole, and ketoconazole) were purchased from Tokyo Chemical Industry (Tokyo, Japan). Indomethacin, niflumic acid, 2-chloroethyl ethyl sulfide (CEES), 17-octadecynoic acid (17-ODYA), and HET0016 were purchased from Sigma-Aldrich (St. Louis, MO). CYP substrates (Lauric acid, palmitic acid, stearic acid, oleic acid, linoleic acid, linolenic acid, arachidonic acid, and prostaglandin A1), sulfaphenazole, and quinidine were obtained from
Cayman Chemical Company (Ann Arbor, MI). All other chemicals were purchased from Wako Pure Chemical Industries, Ltd.
2.2 Methods
2.2.1 Lipid extraction
For lipid extraction, methanol, chloroform and water were added to the samples in a two-step extraction and, after phase separation, lipids were quantified in the chloroform phase
were added to 0.4 ml aqueous samples (chloroform: methanol: water = 2:1:0.8 in volume) and thoroughly mixed on a vortex shaker. Following this, 0.5 ml of chloroform and 0.5 ml of water were added to this mixture (chloroform: methanol: water = 1:1:0.9 in volume) and shaken for 2 min before centrifugation at 600 × g, at 4°C for 2 min to achieve phase separation. The chloroform phase was collected and dried by solvent evaporation under vacuum.
2.2.2 Gas chromatography analysis of fatty acid
The fatty acid methyl esters (FAMEs) derivatives were analyzed by GC (GC-4000 Plus, GL Science Inc., Tokyo, Japan) equipped with a Supelcowax-10 fused silica capillary column (60 m × 0.32 mm × 0.25 μm film thickness, Supelco, Bellefonte, PA) and a flame ionization detector
19). Helium was used as a carrier gas at a constant pressure of 400 kPa. The temperatures of the
injector and detector were 200°C and 250°C13), respectively, and the oven temperature program
was as follows: an initial temperature of 50°C was ramped to 220°C at a rate of 20°C/min and held for 30 min, then ramped to 250°C at a rate of 20°C/min and held for 20 min. Each peak was annotated by comparing the retention times with CLA FAMEs standards and GLC reference standards of FAMEs (Nu-Chek-Prep, Elysian, MN, USA).
2.2.3 Enzymatic activity assay
To unify the enzymatic reaction time, the experiments were performed in a crushed-ice bath. A total of 450 μl of enzymatic preparations (10% w/v) was mixed with 10 μl of α-ESA substrate (5 mM in DMSO) and 40 μl of coenzyme NADPH (0.1 M in 0.9% NaCl), followed by incubation at 37°C for 30 min. The reaction was stopped by placing the sample in a
crushed-ice bath and a known amount of the internal standard heptadecanoic acid (C17:0) was added in order to quantify the fatty acids. The lipids in the reaction mixture were extracted with chloroform-methanol-water (1:1:0.9 in volume) according the Blight & Dyer method. Then, the free fatty acids in the lipid extract were catalyzed into methyl ester derivatives by the TMSN2CH3 method35) and dissolved in 400 μl of hexane for gas chromatography (GC) analysis
to determine the CLA concentration. The protein concentration was determined by the Pierce BCA protein assay kit (Thermo Scientific, Houston, TX, USA). The specific activity of the conversion of α-ESA into CLA was obtained after normalizing to the total protein using the following formula: specific activity (nmol/min/g protein) = CLA amounts (nmol)/ time taken (min)/ protein (g).
2.3 Statistical analysis
Data are presented as means ± standard deviation (SD) and were analyzed with one-way ANOVA, followed by Tukey-Kramer test for comparisons among more than two groups. A p value of < 0.05 was considered statistically significant.
3. Results
3.1 Fatty acids composition of oils
Fatty acids are widely spread through the whole human organism, and they can be found under different forms: 1) non-esterified form fatty acids or free fatty acid; 2) esterified forms including triacylglycerol (or triglycerides, TG) when esterified with glycerol, phospholipids when esterified with phosphoric acid and glycolipids when combined with glucose or other saccharides36). It is note that fatty acids are rarely found in the non-esterified form in nature,
commonly they exist in the esterified form of TG.
Gas chromatography is the most widely used analysis techniques for analyzing the fatty acids composition of oils. However, in generally the fatty acids, especially the long chain fatty acids, cannot be directly determined by GC, and they need to be pre-converted into their corresponding FAMEs which become sufficiently volatile to be eluted at reasonable temperatures without thermal decomposition37). A kinds of FAMEs preparation methods are
applied for different forms of fatty acids, so it is necessary to explore the suitable method for the specific fatty acids. In this study, three different catalytic methods were tested to obtain optimal FAMEs and the retention times of standard fatty acids were also identified.
3.1.1 Procedures
Methyl esterification of fatty acids
naturally occurring fatty acid species, was added simultaneously to the lipid in order to quantify the fatty acids. It should be noted, however, the non-esterified fatty acid C17:0 was used at 5% HCl/MeOH acid-catalyzed method and 0.1% trimethylsilyldiazomethane (TMSN2CH3)
catalyzed method, while C17:0 methyl ester was used at 1M NaOCH3/MeOH base-catalyzed
method.
5% HCl/MeOH acid-catalyzed method
5% HCl/MeOH reagent was prepare by adding 0.5 ml of acetyl chloride to 9.5 ml methanol in a crushed-ice bath, then the 2 ml of 5% HCl/MeOH was added to the lipid in a 15 ml test tube, covered the caps and reacted for 30 min at 60°C. After the reaction, 2 ml of 2% KHCO3
was added to stop the reaction, and after cooling to room temperature, 3 ml of hexane was added to the lipid. Then the mixture was shaken vigorously for 2 min and centrifuged at 1000 × g, at 4°C for 5 min. The upper layer was transferred to another 15 ml test tube, added with 3 ml of distilled water, shaken for 2 min, and centrifuged at 600 × g, at 4 °C for 5 min. The upper layer was transferred to another 15 ml test tube, and the organic solvent contained was removed by evaporation under vacuum. Finally, the remaining fatty acid methyl esters (FAMEs) were dissolved in 400 μl of hexane and stored at -80°C.
1M NaOCH
3/MeOH base-catalyzed method
2 ml of 1M NaOCH3 / MeOH was added to the lipid in a 15 ml test tube, and the mixture
was shaken and reacted at room temperature for 5 min. After the reaction, 5 ml of saturated saline and 3 ml of hexane were added, shaken vigorously for 2 min, and then centrifuged at
1000 × g, 4°C for 5 min. The upper layer was transferred to another 15 ml test tube, added with 3 ml of distilled water, shaken vigorously for 2 min, and centrifuged at 1000 × g, 4°C for 5 min. Then the new upper layer was transferred to another 15 ml test tube, and the organic solvent was removed by evaporation under vacuum. Finally, the remaining FAMEs were dissolved in 400 μl of hexane and stored at -80°C.
0.1% trimethylsilyldiazomethane (TMSN
2CH
3) catalyzed method
200 μl of methanol, 480 μl of benzene and 100 μl of 0.1% TMSN2CH3 were added to the
lipid, and the mixture was thoroughly mixed. After the reacting at room temperature for 30 min, the organic solvent was removed by evaporation under vacuum and the remaining FAMEs were dissolved in 400 μl of hexane and stored at -80°C.
3.1.2 Results
Methyl esters preparation methods for free fatty acid CLA
The standard oil of CLA was a mixture of non-esterified fatty acids (NEFA) containing almost equal amounts of c9,t11-CLA and t10,c12-CLA. However, only a tiny part of CLA isomers were detected using the 1M NaOCH3/MeOH base-catalyzed method, which indicating
the NEFA CLA was not converted into their corresponding methyl esters. In contrast, a large amount of CLA was detected using 5% HCl/MeOH acid-catalyzed method. However, under this condition a few kinds of artificial CLA isomers were generated, while these artificial CLA isomers were not observed using base-catalyzed method (Fig. 3). All these results suggested that the neither the 1M NaOCH3/MeOH method nor the 5% HCl/MeOH method was suitable
for methyl esters preparation of the NEFA CLA.
In contrast, the GC chromatograms of NEFA CLA methyl ester derivatives prepared by 0.1% TMSN2CH3 showed pretty high and pure peaks in the peak area of CLA methyl esters,
indicating the free fatty acids CLA were converted into methyl esters without isomerization under this condition (Fig. 4). Therefore, this method was also applied for the fatty acid analysis of the enzymatic activity assay of CLA formation in the in vitro reconstitution system.
Methyl esters preparation methods for esterified oil
The α-ESA fatty acid in tung oil is esterified with glycerol as an esterified form of fatty acid (also called TG), which is different from the NEFA CLA. According to this experimental results, a large amounts of α-ESA in tung oil was detected using 1M NaOCH3/MeOH base-catalyzed
method, and most importantly, little artificial isomer of CLnA was detected using this method. On the other hand, the α-ESA fatty acid was also detected using 5% HCl/MeOH acid-catalyzed method, however, a numerous of artificial isomers of CLnA was observed,simultaneously. And none of CLA or isomers were detected in the GC chromatograms of tung oil using base- or acid-catalyze method, indicating CLA was not present in tung oil (Fig. 5). Therefore, the 1M NaOCH3/MeOH base-catalyzed method is applied for methyl esterification of the esterified
fatty acids containing conjugated acids.
Since all of the fatty acids in soybean oil are esterified forms without conjugated acids, so there was no obvious difference between base-catalyzed and acid-catalyzed method for methyl
esterification of soybean oil fatty acids. Besides, neither of CLA isomers nor α-ESA isomers was observed in soybean oil using base-catalyzed and acid-catalyzed method, which confirmed that CLA and α-ESA were not present in soybean oil (Fig.6).
According these results, we determined the fatty acids composition of these standard fatty acids and the retention times of their corresponding methyl esters in GC, which can be used to identify unknown fatty acids by comparing their retention times with these of standard fatty acid methyl esters.
Fig.3 GC chromatograms of CLA oil fatty acid methyl esters prepared by 1M NaOCH3/MeOH
Fig.5 GC chromatograms of tung oil fatty acid methyl esters prepared by 1M NaOCH3/MeOH
Fig.6 GC chromatograms of soybean oil fatty acid methyl esters prepared by 1M
3.2 The conversion of α-ESA into CLA in vivo
We have reported for the first time that c9,t11-CLA was detected in the liver and plasma of rats fed with 1% α-ESA diet for 4 weeks, which indicated the α-ESA was converted into c9,t11-CLA, because c9,t11-CLA was not detected in 1% α-ESA diet and normal rats18,33). The
structure of c9,t11-CLA was determined using gas chromatography-electron impact/mass spectrometry (GC-EI-MS) and 13C-NMR 18,33). Next, we also observed the similar conversions
of other CLnA into CLA in rats, specifically by using the thoracic duct cannulation, we examined the absorption and metabolism of fatty acids in rats after administration of JA-rich (c8,t10,c12-CLnA) jacaranda seed oil or PA-rich (c9,t11,c13-CLnA) pomegranate seed oil. And in the lymph collected from the thoracic duct, JA and c8,t10-CLA were detected in jacaranda seed administrated rats, while PA and c9,t11-CLA were detected in pomegranate seed oil-administrated rats13,19). These results suggested that the majority of CLnA administered to rats
was absorbed as CLnA, but some CLnA are converted to their corresponding CLA in the small intestine. Theses conversions were also confirmed in mice and humans after a long term ingestion of CLnA diet in other reports20-22). In this study, we aimed to explore the conversion
of α-ESA into c9,t11-CLA in liver and serum of mice after intragastric administration of tung oil which is rich in α-ESA for a short time (several hour).
3.2.1 Procedures
Animals and Treatments
All animal experiments were conducted in accordance with the Regulations for Animal Experiments and Related Activities at Tohoku University (2018AgA-015)38). Institute of
Cancer Research (ICR) mice, 7 weeks old, were obtained from CLEA Japan Inc. and were allowed to acclimate to the facility for 1 week with standard chow diet (CE-2, CLEA Japan) before the initiation of the experiments. At 8 weeks of age, the mice were administered 0.3 ml of tung oil or soybean oil via a stomach tube after an overnight fast for 12 h. The mice were sacrificed by decapitation before and 3 h after administration of tung oil or soybean oil, and bloods and livers were collected. Serums were prepared from the bloods by centrifugation at 1000 × g, at 4°C for 15 min and the livers and serums were stored at −80°C until use.
3.2.2 Results
Since esterified form triacylglycerols represent the major form of storage and transport of fatty acids in vivo, 1M NaOCH3/MeOH base-catalyzed method was used for the methyl
esterification of fatty acids from mice liver and serum. And it was confirmed that c9,t11-CLA or α-ESA was not detected in liver or serum before administration, indicating in this feeding conditions c9,t11-CLA or α-ESA was not present in normal mice in vivo. Comparing with the GC chromatographs of standard CLA and tung oil methyl esters the presence of c9,t11-CLA and α-ESA fatty acids were confirmed in liver and serum after 3 h administration of tung oil, which contains large amounts of ESA but no c9,t11-CLA. On the contrary, c9,t11-CLA or α-ESA was not detected in liver and serum after 3 h administration of soybean oil, which have been proved to be in the absence of c9,t11-CLA and α-ESA (Fig. 7). All these results suggested that α-ESA was absorbed and quickly converted into c9,t11-CLA in mice.
Fig.7 Fatty acids composition in mouse (a, c, e) liver and (b, d, f) serum before or after
intragastric administration of tung oil or soybean oil for 3 h. The extracted lipids were methyl esterified by 1M NaOCH3/MeOH. GC chromatographs were from one replicate of the
3.3 Characterization of α-ESA saturase in cell free system in vitro
We have reported that CLnA can be converted into its corresponding CLA in vivo, furthermore, we have demonstrated that the conversion of α-ESA into c9,t11-CLA is a Δ13 saturation, a NADPH-dependent enzymatic reaction that occurs predominantly in the rat liver18,33). However, it is still not clear what the α-ESA saturase is. The nicotinamide
dinucleotides (NAD+ and NADH) and nicotinamide dinucleotide phosphates (NADP+ and
NADPH) are important cofactors occurring in all living cells. Increasing evidences have suggested that the nicotinamide dinucleotides and nicotinamide dinucleotide phosphates involve in various biological and pathological processes including energy metabolism, mitochondrial function, antioxidation/generation of oxidative stress, immunological function, and cell death39). In addition, nicotinamide dinucleotides are mainly used in the
enzyme-catalyzed substrate oxidation, while nicotinamide dinucleotide phosphates are mainly used in the enzyme-catalyzed substrate reduction40).
In this study, we aimed to understand about the conversion enough detail to be able to study the underlying mechanism of CLA formation in mice. For this reason, we also want to know whether other coenzymes involve in this conversion besides NADPH. And to accomplish this aim, the reconstitution of enzymatic activity system in vitro is clearly warranted and this reconstitution system will allow us to reproduce the conversion of α-ESA into CLA in vitro. And we also study on the distribution of the enzymatic activity of CLA formation in subcellular fractions, which will lay a solid foundation for the further separation and purification of α-ESA saturase from mouse liver homogenate.
3.3.1 Procedures
AnimalsAll animal experiments were conducted in accordance with the Regulations for Animal Experiments and Related Activities at Tohoku University (2018AgA-015) 31). Institute of
Cancer Research (ICR) mice, 13 weeks old, were obtained from CLEA Japan Inc. and were allowed to acclimate to the facility for 1 week before the initiation of the experiments. At 14 weeks of age, the mice were sacrificed by decapitation after an overnight fast for 12 h and the following tissues were collected: liver, kidney, small intestine, pancreas, brain, heart, lung, spleen, epididymal white adipose tissue (eWAT), and brown adipose tissue (BAT). All tissues were stored at −80°C until use.
Non-esterified form α-ESA preparation
To prepare the enzyme substrate α-ESA (free fatty acid form), tung oil was hydrolyzed by potassium hydroxide (KOH) as previously reported with a slight modification17). After bubbling
with nitrogen gas for 15 s, 30 mg of tung oil in a glass test tube was saponified with 0.25 ml of 0.3 M KOH in 2.5 ml methanol at 40°C for 90 min. After cooling to room temperature, 2.5 ml of H2O and 5 ml of hexane was added. The reaction mixture was vigorously vortexed for 2 min
and centrifuged at 500 × g for 5 min to separate the organic layer from the aqueous layer. The top organic layer containing non-saponaceous matters was removed, while the bottom aqueous layer was mixed with 1.5 ml of 6 M HCl and 5 ml of hexane to extract the fatty acids. The mixture was vigorously vortexed for 2 min and centrifuged at 500 × g for 5 min. Then, the top
organic layer was concentrated by solvent evaporation under vacuum, dissolved in dimethyl sulfoxide (DMSO) and stored at −80°C until use.
Subcellular fractionations of liver
The liver was homogenized in 9 volumes (w/v) of chilled 0.01 M Tris-acetate sucrose buffer, pH 7.4, containing 0.01 M tris-acetate, 0.25 M sucrose, 1 mM dithiothreitol (DTT), 1 mM phenylmethylsulfonyl fluoride (PMSF), 1 mM ethylenediaminetetraacetic acid (EDTA)33), by
using the bead-type homogenizer Micro Smash MS-100 (TOMY Seiko, Tokyo, Japan) at 3600 rpm for 30 sec × 3 times. After this, the liver homogenate was centrifuged at 600 × g, at 4°C for 10 min to collect the pellet containing intact nuclei and debris. The nuclear pellet was re-suspended into 1 volume of 0.01 M Tris-acetate sucrose buffer and the post-nuclear supernatant was again centrifuged at 8000 × g, at 4°C for 20 min using an Optima L-100 XP Ultracentrifuge with a type 70.1 Ti fixed-angle rotor (Beckman Coulter Ltd., Fullerton, CA) to sediment mitochondria. The mitochondrial pellet was re-suspended into 1 volume of the of 0.01 M Tris-acetate sucrose buffer and the post-mitochondrial supernatant was further ultracentrifuged at 105000 × g, at 4°C for 60 min to obtain microsomes41). The microsomal pellet was also
re-suspended into 1 volume of the same buffer and the cytosolic supernatant was retained. A total of 450 μl of each subcellular fraction, namely nuclear, mitochondrial, microsomal, and cytosolic, was subjected to an enzymatic activity assay and the amounts of CLA were determined by GC analysis.
In order to find out the three ingredients of liver homogenate, α-ESA, and NADPH, which is necessary for the conversion of α-ESA into CLA in the in vitro reconstitution system, these three ingredients were replaced by their corresponding solvents one by one. And we found that in the absence of any one of the ingredients, CLA formation was not detected (Fig. 8). This result suggested that the converting process was an enzyme-mediated metabolic process. Next, we also tried to confirm whether other coenzymes NADP, NADH, or NAD could initiate the reaction in the in vitro reconstitution system, however, in the presence of NADP, NADH, or NAD the CLA level was not detected, indicating a high preference for NADPH of α-ESA saturase (Fig. 9). Furthermore, the heated liver homogenate incubated with α-ESA and NADPH also showed no activity, demonstrating the conversion of α-ESA into CLA occurs through a NADPH-dependent enzymatic reaction.
While in the α-ESA saturase subcellular localization experiment of the liver homogenate, the enzymatic activity was the highest in the microsomal fraction, followed by the mitochondrial fraction, lower in the nuclear fraction, and absent in the cytosolic fraction (Fig. 10). Therefore, it was confirmed that α-ESA saturase was abundant in microsomes, which contain the major CYP drug-metabolizing enzymes. And this result is useful for the further separation and purification of α-ESA saturase from mouse liver homogenate.
+, Addition; -, Not Addition.
Fig.8 Reconstitution of enzymatic activity system in vitro. Homogenate was homogenized in
0.01 M Tris-acetate sucrose buffer, NADPH and α-ESA was dissolved in 0.9% NaCl solution and DMSO, respectively. Corresponding solvents were added to reaction mixture in place of the not-addition ingredient. Data are presented as Mean ± SD, n=3.
+, Addition.
Heated homogenate, liver homogenate was heated at 60°C for 30 min.
Fig.9 Characterization of enzymatic activity system in vitro. Homogenate was homogenized in
0.01 M Tris-acetate sucrose buffer, and all the coenzymes, namely NADPH, NADP+, NADH,
and NAD+ were dissolved in 0.9% NaCl solution. Data are presented as Mean ± SD, n=3.
Fig.10 Specific activity of CLA formation in different subcellular fractions. (a) Ultra centrifugal procedures for subcellular fractionation of liver homogenate. Nuclear, mitochondria and microsomes were re-suspended into 1 volume of homogenizing buffer. (b) Bar graph analysis of specific activity of CLA formation in subcellular fractions. a,b,c,d Values without a
common letter are significantly different (p < 0.05). Data are presented as Mean ± SD, n=3. ND, not detected.
3.4 Confirmation of α-ESA saturase
Our previous studies have indicated that the NADPH-dependent enzyme α-ESA saturase involved in the conversion of α-ESA into CLA should be classified as part of the drug metabolism but not as part of the β-oxidation enzyme group in the fatty acid metabolic pathway33). And we also confirmed that enzymatic activity of the conversion of α-ESA into
CLA was abundant in microsomes in this dissertation. However, the precise metabolic pathway and enzyme involved have not been clarified yet. Microsomes are derived mostly from endoplasmic reticulum and the superfamily of cytochrome P450 (CYP) enzymes, which are membrane proteins localized primarily in the membrane of the endoplasmic reticulum (ER)42),
are considered as the major enzyme family responsible for the phase I drug metabolism (reduction, oxidation, or hydrolysis reactions) of numerous endogenous and exogenous compounds, such as drugs and other xenobiotics43). In addition, the reactions catalyzed by CYP
enzymes require the cofactor NADPH as the electron source and the redox partner of cytochrome P450 reductase (CPR). CPR was eventually found to be localized in the endoplasmic reticulum, which functions in the electron transfer from NADPH to CYP44). Based
on these considerations, we sought to elucidate whether CYP play a role in the conversion of α-ESA into c9,t11-CLA.
We also noticed that the conversion of α-ESA into CLA is similar to that in the metabolic pathway of eicosanoids, where leukotriene B4 (LTB4), prostaglandin E2 (PGE2), and lipoxinA4
(LXA4) are the dominant eicosanoids. In the LTB4 metabolic pathway, LTB4 is oxidized by
reduced to 10,11,14,15-tetrahydro-12-oxo-LTB4 by an unknown reductase(s)45). Additionally,
PGE2 and LXA4 are oxidized to 15-oxo-prostaglandin E2 (15-oxo-PGE2) and 15-oxo-lipoxinA4
(15-oxo-LXA4), respectively; LTB4 12-HD/PGR subsequently reduces 15-oxo-PGE2 to
13,14-dihydro-15-oxo-PGE2 and 15-oxo-LXA4 to 13,14-dihydro-15-oxo-LXA4 in the presence of
NADPH46). In addition, Clish et al.47,48) have reported that LTB
4 12-HD/PGR is a member of
the zinc-independent medium chain dehydrogenase/reductase family, which exhibits high reductase activity toward double-bond in several xenobiotics. Therefore, we speculated that the conversion of α-ESA into c9,t11-CLA proceeds through the LTB4 metabolic pathway, in which
the double bond of α-ESA is saturated by the unknown reductase(s), or the PGE2 and LXA4
pathways, in which the double bond is directly reduced by LTB4 12-HD/PGR.
In this study, we aimed to validate our presumptions by testing the possible effect of inhibitors and CYP-substrates on c9,t11-CLA formation in the in vitro reconstitution system of enzymatic activity containing mouse hepatic microsomes, NADPH, and α-ESA. Moreover, we also aimed to determine the enzymatic activities and Cyp4 family gene expression levels in various tissues for correlational analyses, which is useful for determining the specific enzyme of CYP.
3.4.1 Procedures
Inhibitory effects of inhibitors and CYP-substrates
In evaluating the possible effect of inhibitors in CLA formation, liver microsomes (10 mg protein/ml) were pre-incubated with inhibitors (CYP-selective inhibitors, COX inhibitors and
CPR inhibitor) or DMSO solvent used as the control, at 37°C for 5 min. Then, the pre-incubated mixtures were immediately subjected to the enzymatic activity assay. The IC50 (concentration
of inhibitor required to cause a 50% inhibition of the original enzyme activity) was determined graphically from the plot of the logarithm of inhibitor concentration versus the percentage of CLA remaining (% of control) after inhibition using GraphPad Prism 7 (GraphPad Software, San Diego, CA, USA). To determine the inhibitory effect of CYP-substrates on CLA formation, liver microsomes (10 mg protein/ml) were pre-mixed simultaneously with α-ESA and CYP-substrates (α-ESA: CYP-CYP-substrates=1:1 or 1:4 in mole ratio) before the addition of NADPH, which initiated the reaction. Following this, the mixtures were incubated at 37°C for 30 min as described above for the enzymatic activity assay and the amounts of CLA were determined by GC analysis.
Preparation of tissue homogenate
For detecting enzymatic activity, each one of the frozen biological samples (a total of 10 tissue samples) was homogenized in 9 volumes (w/v) of chilled 0.01 M Tris-acetate sucrose buffer, pH 7.4, containing 0.01 M tris-acetate, 0.25 M sucrose, 1 mM dithiothreitol (DTT), 1 mM phenylmethylsulfonyl fluoride (PMSF), 1 mM ethylenediaminetetraacetic acid (EDTA)33),
by using the bead-type homogenizer Micro Smash MS-100 (TOMY Seiko, Tokyo, Japan) at 3600 rpm for 30 sec × 3 times.
Cyp4 family messenger RNA expression analysis
pancreas and spleen samples, while the RNeasy Lipid Tissue Mini Kit (Qiagen, Valencia, CA, USA) was used for brain, epididymal adipose tissue, and brown adipose tissue samples, the RNeasy Fibrous Tissue Mini Kit (Qiagen, Valencia, CA, USA) was used for cardiac tissue to purify the high-quality RNA according to the protocol given by the manufacturer. The concentration and purity of the isolated RNA was determined using the Nanodrop 1000 spectrophotometer (Thermo Scientific, Wilmington, USA). Subsequently, reverse transcription of RNA to complementary DNA (cDNA) was performed with the PrimeScript® RT Master Mix
(Perfect Real Time) Kit (Takara Bio Inc., Shiga, Japan)49). Briefly, an aliquot volume of 1000
ng of RNA, 4 μl of 5 × PrimeScript RT Master Mix (Perfect Real Time) and RNase-free distilled water up to 20 μl were mixed and incubated at 37°C for 10 min, and then at 85°C for 5 sec. Finally, 480 μl of RNase-free dH2O was added to dilute the cDNA and the samples were stored
at −20°C for subsequent analysis.
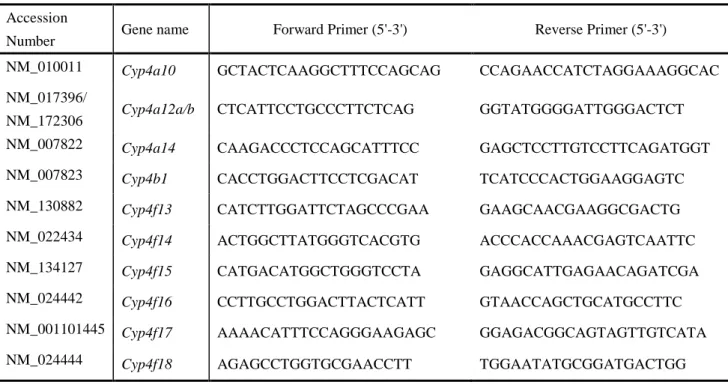
The cDNA was used for real-time quantitative reverse transcriptase polymerase chain reaction (qRT-PCR) to analyze the expression levels of Cyp4 family genes. The qRT-PCR reaction was prepared in a final volume of 20 μl containing 10 μl 2 × TB Green® Premix Ex Taq™ (Tli RNaseH Plus) (Takara Bio Inc., Shiga, Japan), 1 μl forward primer (10 μM), 1 μl reverse primer (10 μM) and 10 μl diluted cDNA. The gene-specific primers, purchased from Sigma-Aldrich (Merck KGaA), are shown in Table 1. PCR amplification was performed with a CFX Connect™ Real-Time PCR Detection System (Bio-Rad, California, USA) and each biological sample was assayed in two technical replicates. The reactions were subjected to an initial 30 sec denaturation at 95°C. To verify the specificity of the amplification reaction, a
melting curve analysis was performed in the range of 60°C to 95°C, 0.5°C per 5 sec increments after thermo-cycling for each reaction50). The threshold cycle (Ct) value, representing the PCR
cycle at which an increase in reporter fluorescence signal significantly above the background fluorescence can first be detected, was also determined. The expression levels of the Cyp4 family genes (10 genes total) in each biological sample was normalized to tissue weight, and shown as fold changes relative to the corresponding Cyp4 transcripts in the liver.
Correlation analysis
For correlation studies, the specific activity of CLA formation was normalized to the corresponding tissue weight. The correlations between the tissue specific activity and the relative expression level of Cyp4 family genes were described using Spearman’s rank correlation coefficients (rs). The strength of correlation was ranked as follows: for absolute
values of rs, 0.01–0.19 was regarded as negligible, 0.20–0.29 as weak, 0.30–0.39 as moderate,
0.40–0.69 as strong and ≥ 0.70 as very strong51).
3.4.2 Results
The effect of inhibitors on CLA formation
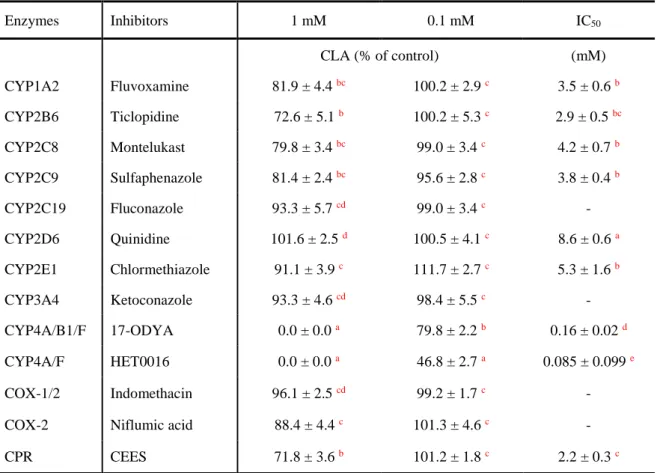
To validate the effect of CYP in the conversion of α-ESA into c9,t11-CLA, the various CYP-specific inhibitors were selected to test their inhibitory effect on CLA formation in hepatic microsomes. With the exception of CYP2C19 inhibitor (fluconazole) and CYP3A4 inhibitor (ketoconazole), all the other CYP-specific inhibitors, including CYP1A2 inhibitor (fluvoxamine), CYP2B6 inhibitor (ticlopidine), CYP2C8 inhibitor (montelukast), CYP2C9
inhibitor (sulfaphenazole), CYP2D6 inhibitor (quinidine), CYP2E1 inhibitor (chlormethiazole), CYP4A/B1/F inhibitor (17-ODYA), and CYP4A/B1/F inhibitor (HET0016) showed inhibitory effect against the CLA formation. Especially, the 17-ODYA and HET0016 showed a significantly higher inhibitory level than all the other inhibitors. Specifically, the CLA formation was almost completely inhibited by 17-ODYA and HET0016 at a concentration of 1 mM, meanwhile the other inhibitors still maintain fairly high enzymatic activity. The inhibition ratio of 17-ODYA was about half that of HET0016 at 0.1 mM (20.2 ± 2.2 % versus 53.2 ± 2.7 %), and the IC50 value of 17-ODYA was about two-fold that of HET0016 (0.16 ± 0.02 mM versus 0.085 ± 0.099 mM), but still significantly lower than that of other CYP1-3 inhibitors. Similarly, the inhibitor CEES of CPR required for electron transfer from NADPH to CYP significantly inhibited the CLA formation with an IC50 value of 2.2 ± 0.3 mM (Table 2). On the
contrary, the cyclooxygenase (COX) inhibitors indomethacin and niflumic acid showed a slight inhibitory effect on CLA formation only at a high concentration (Fig. 11, Table 2). Although, the activity of leukotriene B4 12-hydroxydehydrogenase/15-ketoprostaglandin Delta 13-reductase (LTB4 12-HD/PGR), which was thought to be involved in the conversion of α-ESA
into CLA, could be effectively inhibited by COX inhibitors. These results thus indicated that the NADPH-dependent CPR/CYP4 electron transport system instead of LTB4 12-HD/PGR,
contributed to the conversion of α-ESA into CLA.
Correlation analysis of enzymatic activities and Cyp4 mRNA expression
In this study, we measured the expression level of Cyp4 family genes and the specific activity of CLA formation in tissues, which may help us to figure out the specific CYP4 enzyme
involved in the conversion of α-ESA into CLA. For this purpose, the mRNA expression levels of a total of 10 Cyp4 family genes were examined to determine the tissue distribution patterns.
Cyp4a subfamily isoforms were almost exclusively found in the liver and kidney, such as the
highest mRNA expression of Cyp4a10 and Cyp4a12a/b were found in the kidney, and the
Cyp4a14 mRNA was mostly detected in the liver. While Cyp4b1 mRNA was expressed almost
entirely in kidney. Cyp4f13 was expressed ubiquitously in various tissues with the highest expression in the liver followed by kidney, BAT, and small intestine. Cyp4f14 and 4f15 were primarily detected in the liver, and fairly low amounts were observed in the small intestine, brain, and kidney. Cyp4f16, 4f17, and 4f18 were also expressed ubiquitously across tissues like
Cyp4f13. Specifically, Cyp4f16 mRNA was pretty high level in both the kidney and small
intestine, while Cyp4f17 mRNA was highest in the liver and kidney and slightly lower in BAT, eWAT, the spleen, and brain. Cyp4f18 mRNA was most highly expressed in the spleen. All these results showed that Cyp4 family genes exhibited a highly different tissue-divergent distribution pattern (Fig. 12a). In addition, the specific enzymatic activity of CLA formation was determined in various tissue homogenates (in a total of 10 tissues), and the activity levels from the most to the least active tissues were as follows: liver, kidney, small intestine, and pancreas, while activity was non-detected in other tissues (Fig. 12b).
The observed disparity between the tissue-divergent expression pattern of Cyp4 genes and the alterations in the specific activities of CLA formation in tissues pointed to the necessity of a correlation study. The correlation study results were displayed as the specific activity of CLA formation in 10 tissues from 6 male ICR mice versus the relative expression levels of each of
the Cyp4 family genes, and these results can be used to confirm the specific CYP4 enzymes in the conversion of α-ESA into CLA (Fig. 13). The best correlations were found in Cyp4a14 and
4f13 with a very high statistical significance. And Cyp4f14 and 4f15 had very strong positive
correlations with a very high statistical significance. While a moderate and a strong statistically significant positive correlation were detected in Cyp4f16 and Cyp4f17, respectively. In contrast, there were no significant correlations between the specific activities and the expression levels of the Cyp4a10, 4a12a/b, 4b1, 4f18 genes. Therefore, the specific activity of CLA formation showed the most similar tissue-distribution pattern with the gene expression patterns of
Cyp4a14 and Cyp4f13. These results suggested that CYP4 enzymes are involved in CLA
formation, with CYP4F13 and CYP4A14 being the most relevant enzymes.
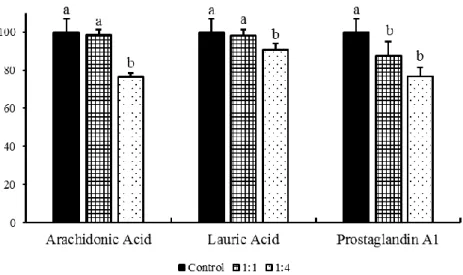
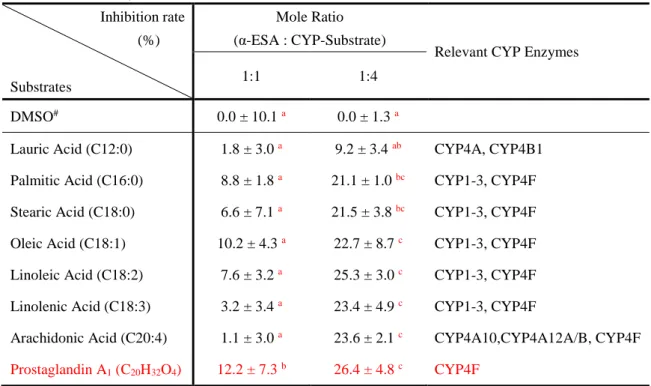
The effect of CYP-substrates on CLA formation
In this study, the liver microsomes were incubated simultaneously with CYP-substrates, α-ESA and NADPH to explore the possible inhibitory effect of CYP-substrates on the conversion of α-ESA into CLA. And this would be helpful in identifying the specific CYP4 enzyme from the most relevant enzymes CYP4F13 and CYP4A14. The results showed that the yield of CLA production decreased with the increasing of CYP-substrates concentration (Fig. 14 and 15). Among them, prostaglandin A1 (PGA1) showed the strongest inhibitory effect, because even at low concentrations, prostaglandin A1 (PGA1) also significantly inhibited the formation of CLA (Table 3 and Fig. 14), while lauric acid showed no inhibition of CLA formation based on the comparison between CYP-substrate groups (Table 3). The other CYP-substrates were proved to have a significant inhibitory effect only at a high concentration. Therefore, the
CYP4F-substrate PGA1 appeared to be the most potent substrate, while lauric acid, the CYP4A-
and CYP4B1-substrate was the least potent substrate. Taken together, these results suggested that the α-ESA saturase that convert α-ESA into CLA belongs to the CYP4F subfamily protein, rather than the CYP4A or CYP4B subfamily protein. Furthermore, considering the results of the results of the correlation analysis described above, we confirmed that CYP4F13 is the most suitable candidate enzyme among CYP4F subfamily involved in the conversion of α-ESA into CLA.
Fig.11 Inhibitory effect of inhibitors in hepatic microsomes. The hepatic microsomes were
pre-incubated with inhibitors or DMSO for 5 min. Leukotriene B4 12-hydroxydehydrogenase/15-ketoprostaglandin Delta 13-reductase (LTB4 12-HD/PGR) enzyme was inhibited by the cyclooxygenase (COX) inhibitors indomethacin and niflumic acid, while CYP enzymatic activities were inhibited by the corresponding CYP-specific inhibitors. The
NADPH-cytochrome P450 reductase (CPR) activity was inhibited by CEES. Data are expressed as percentage of the control (no inhibitor), n=3. IC50 values are listed in Table 2.
CEES, 2-chloroethyl ethyl sulfide; DMSO, dimethyl sulfoxide; α-ESA, α-eleostearic acid; CLA, conjugated linoleic acid; NADPH, nicotinamide adenine dinucleotide phosphate
Fig.12 Relative expression ratio of Cyp4 family genes and specific activity of CLA formation
in various tissues. (a) The relative expression ratio of Cyp4 family genes in each tissue. The gene expression ratio was normalized to tissue weight and shown as fold changes relative to
the corresponding Cyp4 transcripts in the liver. (b) The specific activity of α-ESA conversion into CLA in various tissues. The specific activity was normalized to tissue weight: specific activity (nmol/min /g tissue) = CLA amounts (nmol)/ time taken (min)/ tissue weight (g).14 weeks old male mice were used for this experiment. Data are presented as Mean ± SD, n=6. CLA, conjugated linoleic acid; α-ESA, α-eleostearic acid.
Fig. 13 Spearman’s rank correlations between the specific activity of CLA formation and the
Fig. 14 The inhibitory effect of CYP4F-substrates in the conversion of α-ESA into CLA. The
mole ratio is α-ESA versus CYP4F-substrates and data are presented as Mean ± SD, n=3. a,b
Fig. 15 The inhibitory effect of CYP1-3- and CYP4F-substrates in the conversion of α-ESA
into CLA. The mole ratio is α-ESA versus CYP1-3- or CYP4F-substrates and data are presented as Mean ± SD, n=3. a,b Values without a common letter is significantly different (p
Table 1 List of primer sequences used for real-time PCR.
Accession
Number Gene name Forward Primer (5'-3') Reverse Primer (5'-3')
NM_010011 Cyp4a10 GCTACTCAAGGCTTTCCAGCAG CCAGAACCATCTAGGAAAGGCAC
NM_017396/
NM_172306 Cyp4a12a/b CTCATTCCTGCCCTTCTCAG GGTATGGGGATTGGGACTCT
NM_007822 Cyp4a14 CAAGACCCTCCAGCATTTCC GAGCTCCTTGTCCTTCAGATGGT
NM_007823 Cyp4b1 CACCTGGACTTCCTCGACAT TCATCCCACTGGAAGGAGTC
NM_130882 Cyp4f13 CATCTTGGATTCTAGCCCGAA GAAGCAACGAAGGCGACTG
NM_022434 Cyp4f14 ACTGGCTTATGGGTCACGTG ACCCACCAAACGAGTCAATTC
NM_134127 Cyp4f15 CATGACATGGCTGGGTCCTA GAGGCATTGAGAACAGATCGA
NM_024442 Cyp4f16 CCTTGCCTGGACTTACTCATT GTAACCAGCTGCATGCCTTC
NM_001101445 Cyp4f17 AAAACATTTCCAGGGAAGAGC GGAGACGGCAGTAGTTGTCATA
Table 2 Inhibitory effect of inhibitors (1 mM and 0.1 mM) in the conversion of α-ESA into
CLA and IC50 values.
Enzymes Inhibitors 1 mM 0.1 mM IC50 CLA (% of control) (mM) CYP1A2 Fluvoxamine 81.9 ± 4.4 bc 100.2 ± 2.9 c 3.5 ± 0.6 b CYP2B6 Ticlopidine 72.6 ± 5.1 b 100.2 ± 5.3 c 2.9 ± 0.5bc CYP2C8 Montelukast 79.8 ± 3.4 bc 99.0 ± 3.4 c 4.2 ± 0.7 b CYP2C9 Sulfaphenazole 81.4 ± 2.4bc 95.6 ± 2.8 c 3.8 ± 0.4 b CYP2C19 Fluconazole 93.3 ± 5.7 cd 99.0 ± 3.4 c - CYP2D6 Quinidine 101.6 ± 2.5 d 100.5 ± 4.1c 8.6 ± 0.6 a CYP2E1 Chlormethiazole 91.1 ± 3.9c 111.7 ± 2.7 c 5.3 ± 1.6 b CYP3A4 Ketoconazole 93.3 ± 4.6 cd 98.4 ± 5.5 c - CYP4A/B1/F 17-ODYA 0.0 ± 0.0 a 79.8 ± 2.2 b 0.16 ± 0.02 d CYP4A/F HET0016 0.0 ± 0.0 a 46.8 ± 2.7 a 0.085 ± 0.099e COX-1/2 Indomethacin 96.1 ± 2.5 cd 99.2 ± 1.7 c -
COX-2 Niflumic acid 88.4 ± 4.4 c 101.3 ± 4.6 c -
CPR CEES 71.8 ± 3.6 b 101.2 ± 1.8 c 2.2 ± 0.3 c
Data are presented as Mean ± SD, n=3. a,b,c,d Values in a column without a common superscript
Table 3 Inhibitory effect of various CYP-substrates in the conversion of α-ESA into CLA. Inhibition rate (%) Substrates Mole Ratio (α-ESA : CYP-Substrate)
Relevant CYP Enzymes
1:1 1:4
DMSO# 0.0 ± 10.1a 0.0 ± 1.3 a
Lauric Acid (C12:0) 1.8 ± 3.0 a 9.2 ± 3.4 ab CYP4A, CYP4B1
Palmitic Acid (C16:0) 8.8 ± 1.8 a 21.1 ± 1.0 bc CYP1-3, CYP4F
Stearic Acid (C18:0) 6.6 ± 7.1 a 21.5 ± 3.8 bc CYP1-3, CYP4F
Oleic Acid (C18:1) 10.2 ± 4.3 a 22.7 ± 8.7 c CYP1-3, CYP4F
Linoleic Acid (C18:2) 7.6 ± 3.2 a 25.3 ± 3.0 c CYP1-3, CYP4F
Linolenic Acid (C18:3) 3.2 ± 3.4 a 23.4 ± 4.9 c CYP1-3, CYP4F
Arachidonic Acid (C20:4) 1.1 ± 3.0 a 23.6 ± 2.1 c CYP4A10,CYP4A12A/B, CYP4F
Prostaglandin A1 (C20H32O4) 12.2 ± 7.3 b 26.4 ± 4.8 c CYP4F
Notes: #, all the substrates were dissolved in DMSO which is also taken as a control. A,B,C Values
in a column without a common superscript letter are significantly different (p<0.05). Data are presented as Mean ± SD, n=3.
3.5 Coenzyme NADH in electron transport chain
In general, electron transfer in the CYP system is donated from NADPH via CPR, but in some cases it may also be transferred from NADH via cytochrome b5, especially in microsomal
CYP system52,53). It is generally considered that which electron transfer system is used depends
on the type of CYP molecule and the type of substrates. Although, we have demonstrated that when NADPH was replaced by other coenzymes (NADP+, NDPH, and NAD+), respectively,
the CLA converted by liver microsomes is below the detectable limit. In this experiment, we try to increase the detection sensitivity and find out when coexist with NADPH whether the electron transport chain from NADH via cytochrome b5 to substrates have a synergy effect to
the conversion of α-ESA to CLA.
3.5.1 Procedures
To determine the synergy effect of NADPH and NADH on CLA formation, liver homogenate were pre-mixed simultaneously with NADPH and NADH (0.1 M in 0.9% NaCl) before the addition of α-ESA (50 mg/ml in DMSO). Following this, the mixtures were incubated at 37°C for 30 min as described above for the enzymatic activity assay and the FAMEs catalyzed by TMSN2CH3 were dissolved in 15 μl of hexane, which increased the concentration of the FAMEs in the solution, and the amounts of CLA were determined by GC analysis using manual injection instead of autosampler.
3.5.2 Results
showed a lower enzyme specific activity than the group which only the NADPH was added. Accordingly, it was shown that NADPH and NADH do not have a synergistic effect, and conversely NADH may impair the utilization of NADPH by CYP4F13 enzymes during the conversion of α-ESA to CLA. In addition, when only NADH was added, a very low enzyme specific activity was detected, which should be owing to the basal level of NADPH remaining in the homogenate (Fig. 16). Based on these results, it was re-confirmed that CYP4F13 did not utilize the electron derived from NADH.
Fig. 16 Synergistic effect of NADH on the NADPH-dependent reactions of the cytochrome
P450 system in hepatic microsomes. Values without a common letter are significantly different (p<0.05). Data are presented as Mean ± SD, n=3. ND, not detected.
3.6 Solubilization and Purification of α-ESA saturase
We have confirmed that the enzymatic activity was the highest in the microsomal fraction. Microsomes are generally refer to the pellet fraction obtained from a tissue homogenate by ultracentrifugation after the nuclear and mitochondrial fractions have been removed by low speed centrifugation54,55). In essence, microsomes represent a preparation of intracellular
membranes derived primarily from endoplasmic reticulum56). Liver microsomes are an ideal in
vitro model to investigate compound metabolism, membrane-bound enzyme functions,
lipid-protein interactions, and drug-drug interactions57,58), because liver microsomes contain
membrane phase I enzymes namely CYP and also phase II enzymes, such as UDP-glucuronyltransferases (UGT)59). And the CYP proteins in microsomes are integral membrane
proteins, which bound to the membrane through their N-terminal transmembrane hydrophobic segment (signal anchor sequence)60). For detailed structural and functional studies, membrane
proteins need to be isolated from microsomal membrane environment and purified while maintaining both their stability and activity.
However, it is difficult to efficiently separate and purify CYP enzymes while maintaining its structure and activity due to its molecular diversity with similar properties61). The procedure for
the purification of a membrane protein begins with solubilization of the membrane by detergents, however, it is still lack of suitable detergent which is able to disrupt the hydrophobic interaction between protein and microsomal membrane matrix62). In this study, we aimed to
solubilization and purification of α-ESA saturase from microsomes, and this would enable us to study the properties and characteristics of α-ESA saturase, including substrate specificity,
kinetic properties, and regulatory mechanism. For this purpose, several detergents were investigated in order to find one suitable detergent which can extract the membrane protein α-ESA saturase from mice microsomes and still maintain enzymatic activity in the soluble fraction, and subsequently purified the α-ESA saturase from the soluble fraction using chromatography.
3.6.1 Procedures
Solubilization of microsomes
The procedure of microsomal solubilization and purification were performed at 0-4°C and samples were stored at −80°C until use. The hepatic microsomes were solubilized with 1 volume of solubilization buffer (in 0.01M Tris-acetate sucrose buffer) containing detergents in a crushed-ice bath for 60 min. A numerous of detergents, including nonionic detergents (Triton X-114, Triton X-100, Tween 20, Cholic acid), anionic detergents (sodium cholate, SDS), and amphionic detergents (CHAPS) for solubilization of hepatic microsomes were investigated. After incubation, the mixture was further ultracentrifuged at 105000 × g, at 4°C for 60 min and the supernatant was treated as soluble fraction containing the solubilized enzymes. Both of the insoluble pellet and the soluble fraction were solubilized in 0.01 M Tris-acetate sucrose buffer for enzymatic activity assay and SDS-PAGE.
It has also been reported that CYP systems are generally very unstable and that glycerol is an effective stabilizer for their activities, while sodium cholate is used to disperse lipids and enzymes63-65). For this reason, the effect of different combinations of cosolvents (sucrose and
glycerol) and detergents (sodium cholate and TritonX-114) on specific activity of CLA formation were tested. Specifically, the sucrose for protein stabilization and the Triton X-114 detergent were replaced by glycerol and sodium cholate, respectively. Lastly, a series concentrations of Triton X-114 were also tested for improving the solubilized enzymes activity.
Purification of α-ESA saturase
The soluble protein fraction of from mouse liver microsomes was diluted to total volume of 16 ml at a protein concentration of 10 mg/ml with 0.5% Triton X-114 in 0.01M Tris-acetate sucrose buffer and then subjected to HiPrep Sephacryl S-300 HR column which was previously equilibrated with 2 column volume of the same buffer at a flow rate of 2 ml/min. For determining the binding ability between α-ESA saturase and free fatty acid α-ESA, the solubilized fraction was pre-mixed with α-ESA for 5 min, then the mixture was subjected to HiPrep Sephacryl column chromatography as above. Following this, the column was washed with 0.15M NaCl in 0.01M Tris-acetate sucrose buffer. Fractions of 6 ml per tube were collected The protein composition was confirmed by SDS-PAGE and concentration was determined by the Pierce BCA protein assay kit (Thermo Scientific, Houston, TX, USA).The fractions were concentrated by Amicon Ultra-15 centrifugal ultrafiltration units (molecular weight cutoff 10 KDa;Millipore, Billerica, MA) for enzymatic activity assay.
SDS-PAGE
The polyacrylamide separating gel (10 cm in height) was 10% and the polyacrylamide stacking gel (1.5 cm in height) was 4%. Firstly, 50 μl of sample was solubilized in 50 μl of 2x
sample buffer (0.25 M Tris-HCl, pH 6.8, 10% beta-mercaptoethanol, 4% SDS, 10% sucrose and 0.004% bromophenol blue) and boiled at 95°C for 10 min. Then, the mixture was applied to the top of the stacking gel and the separation was conducted in a Bio-Rad Mini Protean elecrophoresis apparatus, with Bio-Rad Model PowerPacTM Basic (Bio-Rad, Hercules, CA)
according to the manufacturer’s instructions. Running buffer was Tris-glycine-SDS (25-192 mM-1%) and run was conducted at 12 W constant power until the bromphenol blue arrived the end of the gel. The gel was stained with CBB staining solution (0.25% Coommassie Brilliant Blue R-250, 5% methanol, 7.5% acetic acid) , and destained with the solution (25% methanol, 7.5% acetic acid) until the background was clear.
3.6.2 Results
Solubilization of microsomes
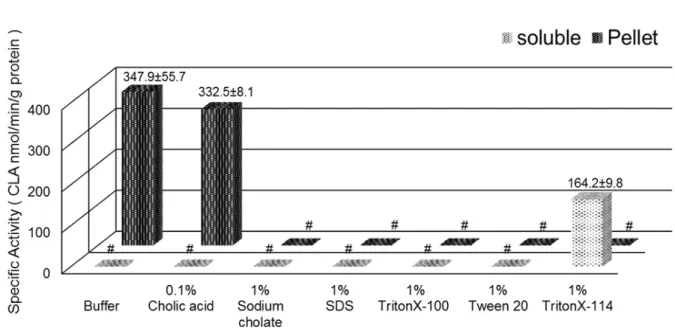
Membrane proteins are always solubilized in appropriate buffers with mild detergents. However, a very low specific activity of CLA formation in soluble fraction was only detected in a low concentration of 0.5% CHAPS and the specific activity in the insoluble pellet fraction decreased with the increasing of CHAPS concentration, indicating the detergent CHAPS had obvious inhibitory effect on enzymatic activity and was not suitable for solubilizing of α-ESA saturase (Fig. 17). In the experiment of further screening suitable detergent, a rather high specific activity of CLA formation in soluble fraction was only detected in 1% TritonX-114 group. While the specific activity in pellet fraction was only detected in 0.1% cholic acid (the maximum solubility) group. All the other detergents completely inhibited the enzymatic activity, resulting in none of enzymatic activities were detected in soluble or pellet fraction (Fig. 18).
These results confirmed that the nonionic detergent TritonX-114 was suitable for solubilizing of α-ESA saturase from microsomes, however, the specific activity of CLA formation was lost more than 50% after solubilizing with the TritonX-114 (347.9 ± 55.7 in microsomes vs 164.2 ± 9.8 in soluble fraction). Accordingly, it’s necessary to improve the solubilizing conditions.
Optimization of microsomal solubilization
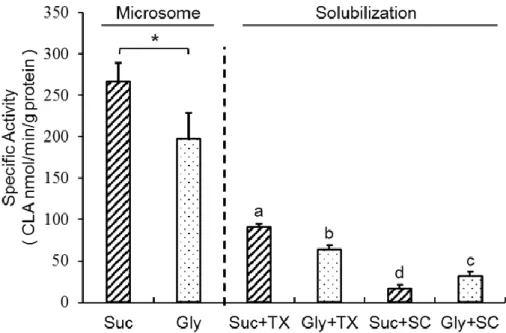
Membrane proteins usually have poor recovery in aqueous buffer due to their being embedded in a lipid bilayer and due to their hydrophobic nature. The solubilization of membrane enzyme α-ESA saturase was achieved in appropriate buffers with mild detergents, but the specific activity of CLA formation was strongly inhibited after solubilization. Glycerol and sodium cholate were often used for CYP protein solubilization. In the microsomal fraction, the specific activity of sucrose group was significantly higher than glycerol group. After the solubilization, under the condition of using sodium cholate as the detergent, the group of glycerol as cosolvent (Gly+SC group) had a higher specific activity than the group of sucrose as cosolvent (Suc+SC group), suggesting that the cosolvents and the detergents had an interaction on solublizational procedure. However, the group of sucrose as cosolvent and TritonX-114 (Suc+TX group) as detergent showed the highest specific activity, indicating the sucrose and TritonX-114 was the best combination for solubilizing of α-ESA saturase from microsomes in this study (Fig. 19).
After establishing the initial conditions for solubilization, the optimal concentration of TritonX-114 was further screened. According to the results obtained, the 0.5% TritonX-114
group showed the highest specific activity of CLA formation among the 6 different concentrations (0.25%, 0.5%, 1%, 2%, 5%, and 10%). However the TritonX-114 tends to inhibit the CLA formation, especially the 5% and 10% groups completely inhibited the CLA formation
(Fig. 20). Next, the protein composition of liver homogenate, subcellular fractions (nuclear,
mitochondria, microsomes and cytosol), soluble fraction and pellet fraction were determined by the 10% polyacrilamide gel electrophoresis (SDS-PAGE). According to the SDS-PAGE electropherogram, we speculated that the α-ESA saturase protein should be located in the band indicated by the red arrow (Fig. 21), because the protein concentration change in this band is consistent with the distribution trend of the specific activity of CLA formation in these fractions, especially the enzyme activity was not detected in the cytosol fraction, and correspondingly no protein was found in this band in cytosol fraction. What’s more, the protein molecular weight in band is about 50 KDa, which is also consistent with the molecular weight of CYP superfamily proteins (Table 4).
Purification of α-ESA saturase from soluble fraction
The elution profile and SDS-PAGE electropherogram showed the proteins in soluble fraction, which was solubilized with 0.5% TritonX-114 in 0.01M Tris-acetate sucrose buffer, were separated using Hiprep Sephacryl column. A protein band near 50 KDa were detected in fractions (No.29-37) on SDS-PAGE (Fig. 22), which waspresumed to be the α-ESA saturase protein. However, no enzymatic activity of CLA formation was detected in any purified fraction. Following this, we also tried to separate and purify the protein from the same soluble fraction using the hydroxyapatite affinity chromatography (Bio-Scale CHT5-I cartridge) or the
DEAE-sepharose ion exchange chromatography (GE healthcare HiTrap DEAE FF). Unfortunately, no enzymatic activity of CLA formation was detected in any fractions purified by these chromatography methods.
As no enzymatic activity was detected after protein purification using chromatography, we decided to first determine the binding ability between α-ESA saturase and free fatty acid α-ESA. It was expected that the higher the amount of α-ESA substrate in the fraction, the higher the amount of the α-ESA saturase enzyme in this fraction because of the substrate recruitment effect of the α-ESA saturase. Then a large amount of α-ESA substrate was detected in the fractions of the first and second protein peak. And the second peak showed the highest binding activity with α-ESA substrate after normalizing the amount of α-ESA substrate to the total protein. Therefore, the α-ESA saturase was considered to be enrichment in the second peak fraction, however, still no enzymatic activity of CLA formation was detected in this fraction or the fractions near the second peak. Since the conversion of α-ESA into CLA occurs through a multi-enzymes system, we speculate that the CYP and CPR were separated into different fractions during the purification procedure, which resulted in the loss of the enzymatic activity. Accordingly, it is necessary to reconstitute the in vitro enzyme activity system for measuring the fractions purified from the soluble fraction by chromatography.
Fig.17 Solubilization of mouse liver microsomes treated by CHAPS. Microsomes (20 mg
protein/ml) were mixed with 1 volume of various concentrations of CHAPS (the final concentrations as above) and incubated for 1h in a crushed-ice bath. Then the mixture was centrifuged at 105000 × g for 1h at 4°C. The specific activity of CLA formation enzyme in the soluble and pellet fractions were determined. Data are presented as Mean ± SD, n=3. #, not detected. Each experiment was repeated at least twice, and data shown are from one representative experiment with 3 replicates.