磯焼け域のキタムラサキウニ生殖巣の高品質化に向
けた研究
著者
?木 聖実
学位授与機関
Tohoku University
学位授与番号
11301甲第19311号
URL
http://hdl.handle.net/10097/00127856
1
磯焼け域のキタムラサキウニ生殖巣の
高品質化に向けた研究
Study for production of highquality gonads in
the sea urchin Mesocentrotus nudus from barrens
髙木 聖実
Satomi TAKAGI
2
Contents
Chapter 1. Introduction …………4
1. Background …………4
2. Research purposes …………8
Chapter 2. Improvement of gonad quality and phenology of Saccharina
japonica kelp ...……9
Section 1. Culture in spring ..………9
1. Objective ...……9
2. Materials and methods ..….……9
3. Results ...……14
4. Discussion …..……35
Section 2. Culture from winter to spring ..……..41
1. Objective ..……..41
2. Materials and methods ..….…..42
3. Results ...……..45
4. Discussion ……….57
Section 3. Culture from spring to summer .…..…...62
1. Objective .………62
2. Materials and methods ..………63
3. Results ..……….66
4. Discussion ..……….81
Chapter 3. Nutritional compounds in feed for taste improvement, and odor
active compounds …………87
Section 1. Difference among frond portions of Saccharina japonica .…87
1. Objective ....……….87
2. Materials and methods ....………88
3. Results ...………91
3
Section 2. Effect of the sporophyll of Undaria pinnatifida …………..110
1. Objective …………..110
2. Materials and methods .…………111
3. Results .…………113
4. Discussion ………….127
Section 3. Temporal changes in gonad quality and nutrient compounds in
kelps .……….131
1. Objective ...………131
2. Materials and methods ...……...132
3. Results ………...135
4. Discussion ...………155
Section 4. Identification of the amino acids improving gonad taste…..160
1. Objective …………..160
2. Materials and methods .…………161
3. Results ………….164
4. Discussion ………….172
Section 5. Odor active compounds in gonads ………….179
1. Objective ………….179
2. Materials and methods ...……….180
3. Results ....……….182
4. Discussion ...………191
Chapter 4. Conclusions .………….195
Acknowledgments ………….198
References ………….200
4
Chapter 1. Introduction
1. Background
The world food supply of fish and seafood has increased from 69,420,942 t in 1991 to 132,828,714 t in 2013 (FAO, 2019b). The inclusion of the traditional Japanese food “washoku” on the UNESCO Intangible Cultural Heritage List in 2013 (UNESCO 2013) led to an increased interest in Japanese cuisine globally (Ninomiya 2016). The Japanese cuisine “sushi” has become popular throughout the world due to its taste, artistic quality, and health benefits (Edwards 2012). Sea urchin gonad is considered a delicacy with a high commercial value and is a main sushi item (Walker et al. 2015). Japan consumes approximately 90% of the total sea urchin harvest in the world (Sun and Chiang 2015). The average price of sea urchin gonads increased from 7,363 yen/kg in 2008 to 14,661 yen/kg in 2018 at Tokyo Metropolitan Central Wholesale Market (Metropolitan Central Wholesale Market 2019), where the largest amount of sea urchins are sold wholesaled (Sun and Chiang 2015). Since 2012, the import of live, fresh or chilled sea urchins to European and Oceanian countries has been underway (FAO 2019a), indicating an increase in their worldwide popularity.
In contrast, the global sea urchin production has been decreasing from 109,736 t in 1995 to 70,833 t in 2017 (FAO 2019c) due to overfishing (Andrew et al. 2002). As a means of meeting market demands, studies on the production of hatchery raised urchins in aquaculture systems have been conducted (McBride, 2005; Pearce 2010). Much attention has been focused on development of feed (Pearce et al. 2002a; George et al. 2004; Hammer et al. 2006; Cook et al. 2007), enhancement of growth and gonad production (de JongWestman et al. 1995; Lawrence et al. 1997; McBride et al. 1997;
5
Barker et al. 1998; Cook et al. 1998; Watts et al. 1998; Kelly et al. 2001; Olave et al. 2001), and improvement of gonad texture, taste, and color (Goebel and Barker 1998; Kelly et al. 1998; McLaughlin and Kelly 2001; Pearce et al. 2002a; 2002b; 2002c; Robinson et al. 2002; McBride et al. 2004; Baião et al. 2019; Zupo et al. 2019) of hatcheryraised larvae, postsettled seeds, and adults. The commercialization of sea urchin aquaculture requires higher economic returns compared to the wild fishery. Currently, Strongylocentrotus intermedius are commercially produced in Japan and China (Liu and Chang 2015; Unuma and Kayaba 2015; Lawrence et al. 2019). Fertilized larvae are grown out to marketsized adults over 3 years, including suspended cage culture, in the Pacific Ocean in eastern Hokkaido (Unuma and Kayaba 2015). Cultured sea urchins are more expensive than wild urchins due to the consistency of gonad quality (Unuma and Kayaba 2015).
Important traits for commercial urchin gonads for the Japanese market are size, color, texture, and taste. Gonads that are bright orange or yellow in color are the most desirable (Kelly and Symonds 2013). The color of sea urchin gonads can be quantified using the Commission Internationale de l’Eclairage L*(lightness), a*(redness), and b*(yellowness) measurement system (reviewed by Walker et al. 2015). Gonad hardness is a major factor associated with texture and can be correlated with gonad developmental stage (McBride et al. 2004). Free amino acid (FAA) in gonads are closely associated with their taste (Komata et al. 1962; Lee and Haard 1982; LiyanaPathirana et al. 2002). The essential amino acids associated with taste in sea urchin gonads are glutamic acid, alanine, glycine, methionine, and valine (Komata 1964). However, there is no standard of “highquality” for sea urchin gonads with these traits, except for gonad size of M. nudus (Agatsuma 1999). Some studies reported that feeds containing 19–36% protein notably enhance
6
gonad production (de JongWestman et al. 1995; Pearce et al. 2002b; Inomata et al. 2016), and βcarotene contained in feed improve gonad color (Robinson et al. 2002; Pearce et al. 2003; Shpigel et al. 2005). However, several studies indicate that feeds with high protein content lead to undesirable gonad color and taste (Agatsuma 1998; Pearce et al. 2002a; Siikavuopio et al. 2007), decrease the content of sweettasting amino acids (glycine and alanine), and increase the content of bittertasting amino acids (valine and lysine) in the gonads (Hoshikawa et al. 1998; Inomata et al. 2016).
Metamorphosed edible sea urchin juveniles occur on “barrens.” These barrens comprise communities of crustose coralline red algae without erect macrophytes and are predominant on subtidal rocky sea floors (e.g., Cameron and Schroeter 1980; Agatsuma 2013; Byrne and Andrew 2013). Dense adult populations also inhabit these barrens. Sea urchins inhabiting barrens exhibit decreased growth rates (Lang and Mann 1976; Himmelman et al. 1983; Sivertsen and Hopkins 1995; Leinaas and Christie 1996; Agatsuma 1997; Meidel and Scheibling 1998; Blicher et al. 2007; Ling and Johnson 2009), have smaller gonads (e.g., Lang and Mann 1976; Johnson and Mann 1982; Keats et al. 1984) and exhibit undesirable gonad color (Agatsuma et al. 2005) compared to those in the kelp beds, and therefore are of no commercial value. The use of adult sea urchins from barrens would have reduced costs compared with hatcheryraised adults.
Mesocentrotus nudus accounts for more than twothirds of the total sea urchin landing
together with S. intermedius and is the most expensive source of sea urchin gonads in the world (Unuma 2015). The wholesale price of M. nudus per wooden tray (250–300 g gonads) can exceed 110,000 yen (Nukui 2018), whereas the average price of all imported sea urchins is approximately 6,000 yen/kg gonad (Unuma 2015). The main fishing seasons of M. nudus in Aomori, Iwate, and Miyagi Prefectures on the Pacific coasts of
7
Tohoku are between June and August (Kawamura 1993), when the gonad size attains a maximum (reviewed by Agatsuma 2013). Large gonad size has been reported for M.
nudus in Eisenia bicyclis and Saccharina kelp beds (Agatsuma, 1997; Agatsuma et al.,
2005; Sano et al., 2001). Gonad enhancement in wild populations of M. nudu is most commonly achieved by transplanting adult sea urchins from deep waters or barrens to kelp or fucoid beds (Agatsuma, 2013; Agatsuma et al., 2004). Several studies clarified that Saccharina kelp enhances sea urchin gonad production (Pearce et al. 2004, Pearce & Robinson 2010, Walker et al. 2015) including in M. nudus (Nabata et al. 1999, Agatsuma et al. 2002, Machiguchi et al. 2012). However, the effects of Laminariales kelps on gonad color, hardness, taste, and consistency among individuals, which determine market value, have not been quantified in detail.
The constituent of Laminariales changes seasonally. The nitrogen and carbon content of Undaria pinnatifida (Gao et al. 2013), Macrocystis pyrifera (Zimmerman and Kremer 1986), Alaria esculenta, Laminaria digitata, Laminaria hyperborea, Saccharina
latissima (Schiener et al. 2015), Saccharina longissima (Li et al. 2009), S. japonica (Li
et al. 2007), S. japonica var. ochotensis (Sato and Agatsuma 2016) and S. japonica var.
diabolica (Li et al. 2009) varies seasonally. The amino acid, protein and glucose content
of S. latissima changes phenologically (Marinho et al. 2015; Sharma et al. 2018). For S.
japonica, crude protein, crude alginic acid, ash, amino acid, chlorophyll a, iodine and
mannitol contents were shown to change seasonally (Oishi and Kunisaki, 1970; Fukushi, 1988). These findings suggest that dietary effect of S. japonica on improvement in gonad quality of M. nudus changes seasonally.
8
2. Research purposes
In Chapter 2, M. nudus from a barren habitat were collected and cultured in a cage suspended offshore and fed Saccharina kelp during a shortterm experiment. This chapter aims to evaluate any improvement of gonad quality (color, hardness, and FAA contents) and consistency among individuals conferred by this feeding regimen compared to those of natural M. nudus populations. I conducted the culture experiments in different seasons to identify the optimal culture period (Section 1, 2 and 3) (Takagi et al. 2017; 2018; 2019). In Chapter 3, different frond portions of S. japonica and different thallus parts of U.
pinnatifida were fed to M. nudus to verify the relationship between gonad qualities and the constituents of each kelp part (Section 1, 2 and 3) (Takagi et al. 2020a; 2020b). In Section 4, I identified the amino acids in feed, which improve gonad taste using artificial feeds. In addition to gonad size, color, hardness and taste, odoractive compounds, which have a dominant role in the taste of food (Spence 2015), from the gonads of M. nudus cultured was investigated (Section 5). In Chapter 4, in conclusion, the standard of “high quality” for sea urchin gonads was defined.
9
Chapter 2. Improvement of gonad quality and phenology of Saccharina
japonica kelp
Section 1. Culture in spring
1. Objective
In the present study, M. nudus from a barren habitat were collected and cultured in a cage suspended offshore and fed S. japonica kelp during a shortterm experiment. The purpose of this experiment was to evaluate any improvement of gonad quality (color, hardness, and FAA contents) and consistency among individuals conferred by this feeding regimen compared to those of natural M. nudus populations from an Eisenia kelp bed (fishing ground) and a barren habitat.
2. Materials and methods (1) Cage culture
I collected 320 M. nudus by scuba diving on the barren at depths of 3–4 m off Nojima Island, Shizugawa Bay, Miyagi Prefecture, Japan (38°40΄N, 141°30΄E) on 27 February 2014. Immediately after collection the sea urchins were placed in a cage suspended at a depth of 4.5 m at a wavesheltered site off Areshima (38°40΄N, 141°27΄E) in this bay until 5 June. The cage was cylindrical, made of polyethylene, and composed of four compartments (65 cm diameter× 180 cm total length) (Unuma and Kayaba 2015). I kept 80 urchins in each compartment. The cage was suspended horizontally. For the first 56 d of culture (until 24 April), stipes axially located on sporophylls of the cultured kelp
10
sea urchins. But the hard stipes were not nearly eaten by sea urchins. Most of them remained in the cage. For the last 42 d of culture, fronds of S. japonica cultured in Shizugawa Bay were fed to the urchins ad libitum every 7–10 d. Water temperature during culture was measured every 15 min by two data loggers (HOBO UA–002–64, Onset, MA, USA) attached to the upper surface at either end of the cage. Daily water temperature was calculated as an average of 96 data points over 24 h.
(2) Sea urchin specimen
At the start of culture, we collected 30 sea urchins (45–55 mm diameter) by scuba diving from the barren (SCB) where the urchins for culture were collected and 30 urchins from the E. bicyclis kelp bed (SK) at depths of 1–2 m near shore from the barren off Nojima. At the end of culture, a total of 30 cultured urchins were collected randomly from the cage (EC), used for analysis. We also collected each 30 urchins from the barren (EB) and the kelp bed (EK). Thus, I compared the gonad quality among five different urchin specimens (SCB, SK, EC, EB, and EK) in this study. I measured the sea urchins right away at the start and end of the experiment.
(3) Measurements, histological observations, and age determination
I measured the sea urchin test diameter (TD) (0.1 mm accuracy) using a vernier caliper and body wet weight (BW) (0.1 mg accuracy) and gonad wet weight (0.1 mg accuracy) using an electronic balance. The gonad index (gonad wet weight × 100/body wet weight) then was calculated. Part of the individual gonad was preserved in 20% formalin. Using standard histological techniques, serial crosssections (6 μm) were cut and stained with Mayer's hematoxylin and eosin. Sections were classified based on the stage of
11
development of germinal cells and nutritive phagocytes (NPs): stage I, recovering; stage II, growing; stage III, premature; stage IV, mature; stage V, partly spawned; stage VI, spent (Byrne, 1990; King et al., 1994). Age was determined by the number of black bands formed as seen in charred genital plates (Jensen 1969; Kawamura 1973).
(4) Gonadal moisture content
Using an electric balance, wet weight of about 1.4 g of gonad tissue after removal of moisture by a paper towel was measured. The tissue was dried in an oven at 80 °C for > 1 week. Dried gonad was weighed, and water content of the gonad was calculated as follows:
Moisture content = (gonad wet weight – gonad dry weight) × 100 gonad wet weight
(5) Gonad color
Colors of gonads in the five different urchin specimens were measured using a color meter (ZE–6000, Nippon Denshoku Industries Co., Ltd., Tokyo, Japan) that detects tristimulus values directly through flicker photometry using a 12-V, 20-W halogen lamp.
L* (lightness), a* (redness), and b* (yellowness) values based on the Commission
Internationale de l’Eclairage colour measurement system (Robinson et al. 2002) were measured in three replicates per gonad, with three replicates of detection per gonad. I calculated the difference in gonad color from individuals of SK, SCB, EB, and EC compared to that from EK as a fishing ground using ΔEab* as a unit of acceptable commercial color difference (Francis and Clydesdale 1975):
ΔE*ab = [(L*0 – L*sample) + (a*0 – a*sample) + (b*0 – b*sample) ]
12
acceptable commercial color. L*sample, a*sample, and b*sample indicate the values of the
gonads from SK, SCB, EB, and EC urchins. To evaluate gonad color visually, individual gonads from each urchin specimen were placed in a Petri dish (35 mm diameter) and then minced into paste using a scissors. Photos of each individual gonad in the Petri dish placed on a blackish board were taken using a digital camera with 13,100,000 pixels (Xperia A SO04E, Sony, Tokyo, Japan) at 10.87 ± 0.05 (SE) μmol photon/m2/s. Photon flux density was measured three times with a quantum sensor (LI250A, LICOR, Lincoln, NE, USA) under illumination with a fluorescent lamp.
(6) Gonad hardness
At the end of culture in June, I measured gonad hardness of EK, EB, and EC urchins using a creep meter (RE233005B, YAMADEN, Tokyo, Japan). Hardness is defined as the maximum force of the first compression of the gonad to onehalf of the original thickness (Bourne, 1982). I placed a piece of the gonad on the stand of the meter, facing up the side of test. Compression by a flatfaced plastic cylinder (5 mm diameter) was measured as the force in Newton's (N), with distance fixed at 5 mm (McBride et al. 2004). Velocity of pressurization and decompression was 5 mm/s. Withdrawal time to the original sample height was determined by setting the sensitivity to 0.02 N.
(7) FAA contents of the gonad
After about 1.0 g individual gonad tissues were quickly frozen at −30 °C, FAAs in the gonads from all urchin specimens were analyzed using the method of Murata et al. (1994) with a slight modification. Sea urchin gonads (0.1–0.5 g) were homogenized with 5 mL of 10% perchloric acid, and the homogenate was centrifuged at 7500 ×g for 10 min. The
13
precipitate was reextracted twice with 2 mL of 5% perchloric acid. The supernatants were combined and neutralized with 10 N and 1 N KOH, and the precipitates were removed by filtration. The filtrate was made up to 25 mL with water. FAAs in the perchloric acid extract were analyzed using an automatic amino acid analyzer (L8900, Hitachi HighTechnologies Corporation, Tokyo, Japan). The FAAs can be categorized into four groups: umamitasting (aspartic acid (Asp) and glutamic acid (Glu)), sweet tasting (alanine (Ala), glycine (Gly), serine (Ser), proline (Pro), and threonine (Thr)) and bittertasting (arginine (Arg), histidine (His), isoleucine (Ile), leucine (Leu), lysine (Lys), methionine (Met), phenylalanine (Phe), tyrosine (Tyr), and valine (Val)) amino acids, and others according to Kaneko et al. (2009).
(8) Protein contents of feeds
NaOHsoluble protein contents in 10 stipes of U. pinnatifida and 10 fronds of S.
japonica were analyzed using the method of Lowry et al. (1951) with the DC™ Protein
Assay Kit (DC™ Protein Assay Kit II, BIORAD, Hercules, CA, USA). Bovine serum albumin was used as the standard.
(9) Sensory evaluation
No S. japonica was fed to the sea urchins remaining in the cage since 5 June. On 23 June, I collected a total of 20 urchins cultured in the cage, 20 urchins from the E. bicyclis bed, and 20 urchins from the barren off Nojima. I dissected these urchins and removed the gonads. At a meeting facility called Tabunoki at Tokura along Shizugawa Bay, sensory evaluation was conducted by 12 fisheryassociated persons who are familiar with urchin gonad taste. For each of the eight evaluation items (color, flavor, sweetness, umami,
14
richness, saltiness, texture, and overall taste), they used the following five grades: −2 (undesirable), −1 (slightly undesirable), 0 (average), 1 (slightly desirable), and +2 (desirable).
(10) Statistical analysis
I analyzed statistical differences in gonad index, water content, L*, a*, and b* values,
ΔEab*, hardness, FAA contents, and sensoryscores among urchin specimens using the Steel–Dwass multiple comparison test after the Kruskal–Wallis test because normality and homoscedasticity of data in each urchin specimen were not detected by the Shapiro– Wilk W test and Levene test, respectively. I analyzed significant sexual difference in the elements of gonad quality in each urchin specimen using the Mann–Whitney U test. I used student ttest to evaluate differences in protein contents between stipes of U.
pinnatifida and fronds of S. japonica after logarithmic transformation. Statistical analyses
were conducted using JMP (SAS Institute Inc., Cary, NC, USA). To evaluate consistency of gonad quality among individuals, the coefficient of variation (standard deviation / average × 100) of gonad index, L*, a*, and b* values, water content, and hardness were calculated.
3. Results
(1) Water temperature
Figure 1 shows changes in daily water temperature. The average water temperature during the culture period was 7.6 °C. It rapidly decreased in early April, < 6 °C until mid April. In midMay, it reached the lowest value of 4.3 °C and then sharply increased to a
15
Figure 1. Daily water temperatures at upper surface of cultured cage.
16
peak of 11.8 °C in early June.
(2) Urchin body size and age
Table 1 shows TD and age compositions of M. nudus in each urchin specimen. The TD of each urchin specimen ranged from 50.8 to 55.0 mm. All SK and EK urchins were 2 years old. In contrast, ages of SCB, EB, and EC urchins varied widely from 2 to 7 years.
(3) Gonad development and gonad index
Gonad developmental stages of M. nudus by sex in each urchin specimen are shown in Table 2. In February, 87%–90% of gonads from SCB and SK urchins were in the recovering stage (I), with small numbers of primary spermatocytes or previtellogenic oocytes along the acinal wall and with NPs filling the lumen (Figure 2). In June, 50% of growing stage (II), with increasing numbers of spermatocytes or early vitellogenic oocytes along the acinal wall and with NPs filling the lumen (Figure 2). In contrast, 80% of gonads from EB urchins were still in the recovering stage. In all urchin specimens, more male urchins than female urchins were in the growing stage.
Figure 3 shows gonad indices of M. nudus by sex in each specimen. Gonad indices by sex differed significantly among urchin specimens (Tables 3 and 4). The gonad indices by sex of SK and EK urchins were higher than those of SCB (female; 6.3 ± 0.8, male; 6.3 ± 0.7) and EB urchins (p < 0.001). The gonad indices by sex of EC urchins (female; 16.9 ± 1.0, male; 15.6 ± 0.6) were significantly higher than those of SCB and EB urchins (p < 0.01), but they were not significantly different from those of SK and EK urchins. Within each urchin specimen, there were no significant sexual differences between the gonad indices. The coefficients of variation of gonad indices by sex were the highest at the start
17
Table 1. Test diameters (TD, mean ± SD) and age (II – VII) compositions of
Mesocentrotus nudus by specimens.
Sea urchin specimen TD (mm) II III IV V VI VII
SK 52.4 ± 1.7 30
EK 50.8 ± 2.9 30
SCB 53.8 ± 3.0 4 4 12 10
EB 51.5 ± 3.6 8 2 6 5 9
EC 55.0 ± 3.9 3 2 5 12 6 2
At start of culture in February, sea urchins collected from Eisenia bicyclis kelp bed (SK), and a barren for culture (SCB). At end of culture in June, sea urchins collected from the E. bicyclis kelp bed (EK) and the barren (EB), and cultured sea urchins (EC).
18
Table 2. Number of Mesocentrotus nudus at the gonad developmental stages of recovering and growing by treatment and sex (female, male).
Sea urchin specimen Recovering Growing
SK 27 (16, 11) 3 (0, 3)
EK 13 (9, 4) 17 (3, 14)
SCB 26 (14, 12) 4 (0, 4)
EB 24 (14, 10) 6 (1, 5)
EC 15 (6, 9) 15 (5, 10)
19
Figure 2. Histology of ovaries (left) and testes (right) of Mesocentrotus nudus.
a and c, recovering stage; b and d, growing stage. NP, nutrient phagocytes; PO, previtellogenic oocytes; EV, early vitellogenic oocytes; PS, primary spermatocytes; SC, spermatocytes. Scale bars represent 100 µm in all images.
PS
NP
NP
PO
a
c
NP
NP
b
d
EV
SC
20
Figure 3. Gonad indices (mean ± SE) of Mescentrotus nudus by sex. Explanation of SK,
EK, SCB, EB and EC is indicated in Table 1. a, b, c and A, B, C indicate significant differences among each treatment by sex (p < 0.05).
b A a A c C c B ab A
SK
EK
SCB
EB
EC
21
Table 3. Result of Kruskal–Wallis test of gonad index, color and hardness, and moisture contents and amino acid contents in the ovaries of Mesocentrotus nudus among each specimen. χ2 df P Gonad index 51.677 4 < 0.0001 L* 39.378 4 < 0.0001 a* 31.027 4 < 0.0001 b* 28.141 4 < 0.0001 ΔEab* 28.754 3 < 0.0001 Hardness 16.997 2 0.0002 Moisture content 28.518 4 < 0.0001 Aspartic acid 18.804 4 0.0009 Glutamic acid 0.745 4 0.9457 Alanine 28.492 4 < 0.0001 Glycine 12.961 4 0.0115 Proline 26.849 4 < 0.0001 Serine 30.419 4 < 0.0001 Threonine 32.519 4 < 0.0001 Arginine 18.505 4 0.0010 Histidine 18.496 4 0.0010 Isoleucine 31.502 4 < 0.0001 Leucine 29.023 4 < 0.0001 Lysine 18.948 4 0.0008 Methionine 27.213 4 < 0.0001 Phenylalanine 33.866 4 < 0.0001 Tyrosine 28.495 4 < 0.0001 Valine 26.384 4 < 0.001 Taurine 27.302 4 < 0.0001 Tryptophan 20.626 4 0.0004 Ornithine 8.309 4 0.0809 αAminobutyric acid 14.125 4 0.0069 Cystathionine 9.200 4 0.0563 Citrulline 5.074 4 0.2798 NH3 21.853 4 0.0002
22
Table 4. Result of Kruskal–Wallis test of gonad index, color and hardness, and moisture contents and amino acid contents in the testes of Mesocentrotus nudus among each specimen. χ2 df P Gonad index 58.813 4 < 0.0001 L* 49.582 4 < 0.001 a* 28.116 4 < 0.0001 b* 15.057 4 0.0046 ΔEab* 20.588 3 0.0001 Hardness 14.395 2 0.0007 Moisture content 18.311 4 < 0.0001 Aspartic acid 25.075 4 < 0.0001 Glutamic acid 17.008 4 0.0019 Alanine 45.535 4 < 0.0001 Glycine 10.939 4 0.0273 Proline 42.282 4 < 0.0001 Serine 36.353 4 < 0.0001 Threonine 42.592 4 < 0.0001 Arginine 26.515 4 < 0.0001 Histidine 29.161 4 < 0.0001 Isoleucine 39.059 4 < 0.0001 Leucine 37.534 4 < 0.0001 Lysine 29.200 4 < 0.0001 Methionine 28.235 4 < 0.0001 Phenylalanine 43.146 4 < 0.0001 Tyrosine 33.717 4 < 0.0001 Valine 22.228 4 0.0002 Taurine 5.441 4 0.245 Tryptophan 30.406 4 < 0.0001 Ornithine 20.992 4 0.0003 αAminobutyric acid 54.135 4 < 0.0001 Cystathionine 21.287 4 0.0003 Citrulline 7.299 4 0.1209 NH3 14.580 4 0.0057
23
of culture (SCB), and they declined markedly by the end of culture (EC) (Table 5). The coefficients of variation of SK and EK urchins were the lowest compared to the other specimen (Table 5).
(4) Gonadal moisture content and gonad hardness
Figure 4 shows gonadal moisture content by sex. There were significant differences in the moisture content among urchin specimens (Tables 3 and 4). The moisture content of ovaries from EC urchins was significantly lower than that from SCB urchins (p < 0.05). In contrast, the moisture content in testes from EC urchins was not different from that of SCB urchins but was significantly higher than that of SK urchins (p < 0.01). There were no significant sexual differences in moisture content within each urchin specimen (p > 0.05). The high coefficient of variation of the moisture content of the gonads at the start of culture in SCB urchins declined by the end of culture (EC) (Table 5).
Gonad hardness by sex in the three urchin specimens from June is shown in Figure 5. Gonad hardness differed significantly among urchin specimens (Tables 3 and 4). Hardness of testes of EC urchins was significantly lower than that of EB urchins (p < 0.01) and did not differ from that of EK urchins. Hardness of ovaries of EC urchins was significantly greater than that of EK urchins (p < 0.01) but did not differ significantly from that of EB urchins. Hardness of testes of EK urchins was greater than that of ovaries (p < 0.05). There were no significant sexual differences in the hardness of the gonads in the EC and EB urchins. The coefficient of variation of ovary hardness from EC urchins was the lowest. The value for testes was similar for the EC, EB, and EK urchins (Table 5).
24
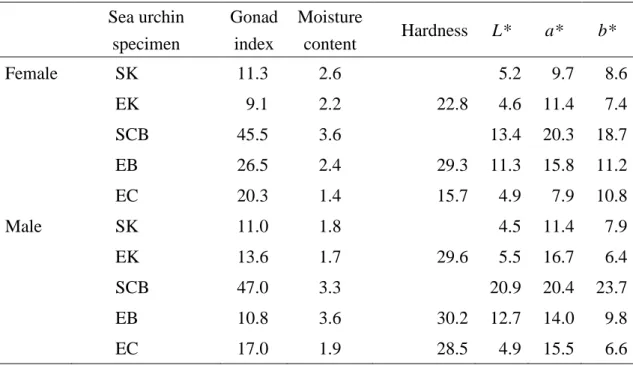
Table 5. Coefficient of variations of gonad indices, and L*, a*, b*, moisture contents and hardness of gonad of Mesocentrotus nudus by sex.
Sea urchin specimen Gonad index Moisture content Hardness L* a* b* Female SK 11.3 2.6 5.2 9.7 8.6 EK 9.1 2.2 22.8 4.6 11.4 7.4 SCB 45.5 3.6 13.4 20.3 18.7 EB 26.5 2.4 29.3 11.3 15.8 11.2 EC 20.3 1.4 15.7 4.9 7.9 10.8 Male SK 11.0 1.8 4.5 11.4 7.9 EK 13.6 1.7 29.6 5.5 16.7 6.4 SCB 47.0 3.3 20.9 20.4 23.7 EB 10.8 3.6 30.2 12.7 14.0 9.8 EC 17.0 1.9 28.5 4.9 15.5 6.6
Explanation of SK, EK, SCB, EB and EC is indicated in Table 1.
25
Figure 4. Gonadal moisture contents (mean ± SE) of Mesocentrotus nudus by sex. Explanation of SK, EK, SCB, EB and EC is indicated in Table 1. a, b, c and A, B, C indicate significant differences among each specimen by sex (p < 0.05).
c B bc A a A ab AB bc A
26
Figure 5. Hardness of the gonad (mean ± SE) of Mesocentrotus nudus by sex at end of culture. Explanation of EK, EB and EC is indicated in Table 1. a, b, c and A, B, C indicate significant differences among each specimen by sex (p < 0.05). An asterisk indicates significant difference between sex (p < 0.05).
b a a B A B * EK EB EC
27
(5) Gonad color
Figure 6 shows the L*, a*, and b* values of gonads by sex from each urchin specimen. There were significant differences in these values among urchin specimens (Table 3 and 4). L* values of gonads by sex of EC urchins were significantly higher than those of SCB urchins. L*values of ovaries of EC urchins did not differ from those of SK and EK urchins. There were no significant sexual differences in L* values within each urchin specimen. The a* values of ovaries of SK urchins were significantly higher than those of EK, EB, and EC urchins but did not differ from those of SCB urchins. The a* values of testes of EK urchins were significantly lower than those of the other urchin specimens (p < 0.05). The b* values of gonads of EC urchins by sex were significantly lower than those of EK urchins (p < 0.05). No significant increase in a* and b* values of gonads by sex was detected from the start (SCB) to the end (EC) of the culture period. The a* and b* values of testes were significantly higher than those of ovaries in each urchin specimen, except for the gonads of EK urchins (p < 0.05).
The coefficients of variation of L* values of gonads by sex from EC urchins were markedly low compared to those from SCB and EB urchins, but they were similar to those of SK and EK urchins (Table 5). The coefficient of variation of a* value of ovaries of EC urchins was also lower than those of SK and EK urchins. The value for testes of EC urchins was close to those from EK and EB. Coefficients of variation of b* value of gonads by sex from EC urchins were also low compared to those from SCB.
ΔE*ab values by sex of SK, SCB, EB, and EC are shown in Figure 7. There were significant differences in ΔE*ab value by sex among urchin specimens (Tables 3 and 4),
but no significant sexual difference in the values was detected within each urchin specimen. The values of gonads by sex of SK and EC urchins were significantly lower
28
Figure 6. L*, a*, b* values (mean ± SE) of the gonad of Mesocentrotus nudus by sex. Explanation of SK, EK, SCB, EB and EC is indicated in Table 1. Lower–case and Upper– case letters indicate significant differences among each specimen (p < 0.05). Asterisks indicate significant differences between sex (p < 0.05).
a A a A c C b c BC ab B a A B b ab A b b A A c ab AB A AB d AB bc cd B
*
*
*
*
*
*
*
*
SK
EK
SCB
EB
EC
29
Figure 7. ΔE*ab (mean ± SE) of the gonad of Mesocentrotus nudus by sex. Explanation
of SCB, EB and EC is indicated in Table 1. Lowercase and Uppercase letters indicate significant differences among each treatment by sex (p < 0.05).
SCB
EB
EC
SK
a ab bc c A A B B30
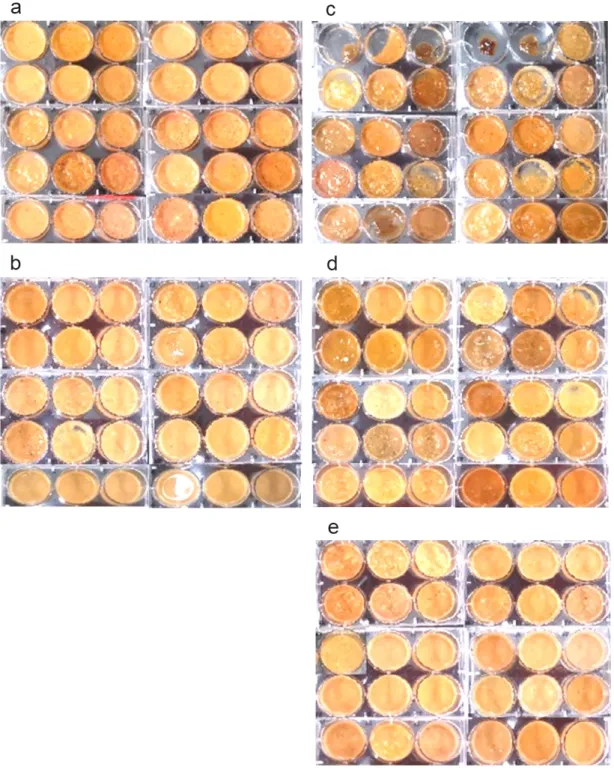
than those of SCB urchins (p < 0.05). The value for testis of EC urchins was significantly lower than that of EB urchins (p < 0.01). Individual gonads from EC urchins exhibited good color visually and high consistency among individuals compared to those of SCB and EB urchins (Figure 8).
(6) FAA contents
Table 6 lists the FAA contents of gonads by sex from each urchin specimen. There were significant differences in the contents of the 22 FAAs among urchin specimens, with the exception of Glu, ornithine, cystathionine, and citrulline in ovaries and taurine, and citrulline in testes (Tables 3 and 4). Of the sweet tasting amino acids, Ala contents in gonads by sex in EC urchins were > 300 mg/100 g and were significantly higher than those in the other urchin specimens (p < 0.01). Ser contents in gonads by sex in EC urchins also were significantly higher than those of the other urchin specimens (p < 0.01), except for that the value for testes of SCB urchins. Gly contents in gonads by sex in all specimens were high, and no significant difference was detected among urchin specimens.
Of the bitter tasting amino acids, Arg contents were the highest in gonads from all urchin specimens. The contents of Arg and Lys in testes significantly increased from the start (SCB) to the end (EC) of the culture period (p < 0.01). Arg contents in ovaries of EC urchins were significantly lower than those of EB urchins (p < 0.01). Lys contents in gonads by sex of EC urchins were significantly lower than those of EB urchins (p < 0.05). There were no significant differences in the contents of Arg and Lys in gonads by sex among the EC, SK, and EK urchins. Of other bitter tasting FAAs of the gonads, levels of His, Ile, Leu, Met, Phe, Tyr, and Val were higher in EC urchins than in EK urchins. In EC
31
Figure 8. Individual gonads minced into paste by each treatment. a, SK; b, EK; c, SCB; d, EB; e, EC. Explanation of SK, EK, SCB, EB and EC is indicated in Table 1.
32
Table 6. Free amino acid content in the gonad of Mesocentrotus nudus among treatments (mg/100 g) (mean ± SE). Lower–case letters indicate significant differences among treatments by sex (p < 0.05). Asterisks indicate significant differences between sex at each treatment (p < 0.05).
Explanation of SK, EK, SCB, EB and EC is indicated in Table 1.
SK EK SCB EB EC
Male Female Male Female Male Female Male Female Male Female
Aspartic acid 3.2 ± 0.2c 4.0 ± 0.4ab 7.8 ± 0.9a* 4.1 ± 0.8ab 5.4 ± 0.5ab 5.9 ± 0.6a 4.5 ± 0.4bc 3.6 ± 0.3b 4.5 ± 0.3b* 2.8 ± 0.3b Glutamine 107.7 ± 4.2b 125.7 ± 9.5 156.1 ± 10.2a 125.4 ± 10.0 180.9 ± 30.5ab 166.4 ± 31.1 114.1 ± 8.5ab 123.9 ± 6.8 141.4 ± 5.0a 132.7 ± 7.3 Alanine 191.4 ± 6.5b 199.5 ± 6.9b 191.0 ± 16.0b 208.8 ± 19.7b 131.3 ± 25.0b 168.7 ± 19.8b 158.7 ± 9.1b 210.8 ± 12.2b* 339.3 ± 9.7a 379.4 ± 21.3a Glycine 910.5 ± 23.4a 930.7 ± 26.4ab 909.4 ± 24.3ab 937.1 ± 25.5a 775.5 ± 36.0b 766.6 ± 45.2b 909.8 ± 52.6ab 939.2 ± 29.0a 870.2 ± 24.1ab 895.9 ± 26.4ab Serine 65.9 ± 4.5bc 67.2 ± 6.7bc 86.5 ± 6.0b 76.0 ± 7.5bc 87.0 ± 13.5ab 90.3 ± 6.7b 40.2 ± 6.6c 59.2 ± 7.8c* 134.1 ± 9.9a 158.0 ± 16.8a Threonine 20.2 ± 1.8b 35.5 ± 3.9b* 13.5 ± 1.0c 16.5 ± 2.2c 36.7 ± 6.6ab 43.7 ± 5.9ab 25.3 ± 3.0b 51.6 ± 5.2ab* 49.6 ± 3.1a 68.0 ± 7.2a* Arginine 370.2 ± 14.3b* 306.9 ± 17.9ab 398.0 ± 19.7ab* 312.4 ± 13.3b 282.2 ± 22.6c 268.1 ± 30.2b 481.4 ± 41.5a* 378.7 ± 16.4a 378.2 ± 16.3ab* 288.2 ± 17.6b Histidine 14.3 ± 0.8b 19.8 ± 1.9b* 16.3 ± 1.0b 18.6 ± 2.3b 19.3 ± 2.4b 18.4 ± 2.7b 20.2 ± 2.9b 21.5 ± 2.5b 31.3 ± 2.1a 41.7 ± 4.6a Isoleucine 43.6 ± 4.1b 61.2 ± 4.3b* 29.3 ± 2.3c 32.1 ± 2.3c 67.1 ± 9.1ab 69.6 ± 9.8ab 55.1 ± 5.0b 70.8 ± 7.2ab 78.4 ± 4.6a 105.0 ± 8.7a* Leucine 80.3 ± 6.9bc 113.6 ± 7.6b* 59.9 ± 3.9c 71.2 ± 4.7c* 107.8 ± 15.3abc 106.9 ± 15.3bc 104.6 ± 9.2b 126.0 ± 12.0b 154.2 ± 7.9a 209.2 ± 16.9a* Lysine 211.9 ± 6.6ab* 168.9 ± 10.3b 233.2 ± 13.1ab* 162.7 ± 7.9b 153.9 ± 13.0c 138.7 ± 19.5b 300.9 ± 33.7a 226.8 ± 12.0a 213.6 ± 8.3b* 163.2 ± 13.6b Methionine 23.1 ± 2.8b 30.2 ± 2.5b* 18.8 ± 1.2b 22.6 ± 2.5b 32.1 ± 6.8ab 32.1 ± 3.3b 25.4 ± 3.4b 30.5 ± 3.5b 44.6 ± 2.5a 63.0 ± 4.6a* Phenylalanine 28.9 ± 3.2bc 48.9 ± 3.2b* 23.8 ± 1.5c 30.3 ± 2.2c* 47.4 ± 6.8b 40.3 ± 4.7bc 42.4 ± 3.8b 58.2 ± 5.3b* 74.0 ± 4.0a 98.9 ± 8.3a* Tyrosine 74.3 ± 6.3b 89.8 ± 5.6b 51.9 ± 3.3b 52.7 ± 3.9c 84.3 ± 10.6ab 84.6 ± 12.2abc 98.7 ± 8.1ab 110.3 ± 9.1ab 111.7 ± 6.6a 142.7 ± 12.7a* Valine 65.4 ± 5.3bc 98.6 ± 5.9b* 49.8 ± 3.2c 61.2 ± 3.3c* 102.2 ± 12.6ab 107.3 ± 13.5ab 66.8 ± 11.0abc 85.2 ± 13.7bc 97.7 ± 10.7a 163.6 ± 13.9a* Taurine 106.4 ± 4.9* 87.4 ± 3.2ab 92.2 ± 3.3* 78.8 ± 4.7b 113.4 ± 14.4 91.2 ± 7.5ab 97.8 ± 7.0 97.1 ± 3.1a 91.6 ± 7.2* 51.9 ± 5.4c Tryptophan 17.8 ± 1.3b 24.7 ± 1.5a* 12.3 ± 1.3c 14.5 ± 1.7b 20.2 ± 2.6abc 22.1 ± 2.6ab 16.7 ± 1.9bc 28.7 ± 3.1a* 29.7 ± 2.8a 40.2 ± 6.0a Ornithine 11.3 ± 0.5abc 12.9 ± 0.6 11.6 ± 3.7c 11.4 ± 1.5 14.9 ± 1.1 a 12.3 ± 1.0 13.7 ± 1.2ab 13.0 ± 1.1 10.3 ± 0.7bc 16.4 ± 1.3* αAminobutyric acid 1.5 ± 0.3d 2.6 ± 0.4b 2.0 ± 0.5cd 4.1 ± 1.1ab 5.1 ± 0.9a 4.1 ± 0.6ab 4.3 ± 0.6bc 5.8 ± 1.2a 4.7 ± 0.3b 5.5 ± 1.2ab Cystathionine NDb ND 5.6 ± 1.3a* 0.4 ± 0.3 1.1 ± 1.1a ND 3.6 ± 1.2a 2.0 ± 1.1 2.7 ± 0.8a 0.8 ± 0.5 Citrulline 0.1 ± 0.1 0.3 ± 0.2 2.2 ± 0.8 1.3 ± 0.9 0.7 ± 0.5 0.2 ± 0.2 3.2 ± 1.4* ND 0.9 ± 0.4 0.1 ± 0.1 NH3 10.8 ± 2.2a 12.7 ± 1.8a 2.7 ± 0.4b 4.1 ± 0.9bc 3.3 ± 0.9b 6.1 ± 2.3bc 2.4 ± 0.9b 7.1 ± 0.9ab* 4.2 ± 1.1ab 2.8 ± 0.8c
33
urchins, contents of Asp, Arg, Lys, and taurine were significantly higher in testes compared to ovaries (p < 0.05), whereas contents of Thr, Ile, Leu, Met, Phe, Tyr, Val, and ornithine were significantly higher in ovaries compared to testes (p < 0.05). Tasterelated FAAs at > 10 mg/100 g contents increased from the start (SCB) to the end (EC) of the culture period, except for Glu and Val.
(7) Sensory evaluation
Sensory evaluation scores of gonads of cultured sea urchins and those from the E.
bicyclis kelp bed and the barren are shown in Table 7. Significant differences in the scores
were detected among urchin specimens with the exception of richness and saltiness (p < 0.05). There were no significant differences in the scores for color, flavor, sweetness, umami, and overall taste between the gonads of cultured urchins and those from the kelp bed. These scores of gonads of urchins from the barren were significantly lower than those of the cultured urchins and those from the kelp bed (p < 0.05). No significant difference in the scores for texture between the gonads of cultured urchins and those from the barren was detected, although the score for the urchins from the kelp bed was significantly higher than that from the barren urchins (p < 0.05).
(8) Protein content in feeds
NaOHsoluble protein content (mean ± SE) in stipes of U. pinnatifida was 1.59 ± 0.09%, which was significantly lower than the 4.11 ± 0.45% found in fronds of S.
34
Table 7. Scores by sensory evaluation of gonad of Mesocentrotus nudus in Eisenia bicyclis, on barren and at the end of culture in June (mean ± SD) and result of Kruskal–Wallis test of the scores among each treatment. Lower–case letters indicate significant differences among treatments.
Eisenia bicyclis Barren End of culture χ2 df P
Color 1.83 ± 0.39a –1.33 ± 0.65b 1.42 ± 0.79a 27.739 2 < 0.0001 Flavor 0.58 ± 0.90a –0.42 ± 0.79b 0.58 ± 0.92a 8.718 2 0.0128 Sweetness 1.17 ± 0.83a 0.00 ± 0.74b 1.00 ± 0.95a 10.067 2 0.0065 Umami 1.08 ± 0.79a −0.08 ± 0.79b 1.00 ± 0.74a 11.163 2 0.0038 Richness 0.58 ± 0.95 0.00 ± 1.13 0.83 ± 0.94 3.908 2 0.1417 Saltiness 0.50 ± 0.90 –0.17 ± 0.72 0.17 ± 1.20 2.942 2 0.2297 Texture 0.92 ± 1.00a –0.08 ± 0.29b 0.58 ± 0.92ab 8.820 2 0.0122 Overall rating 1.25 ± 0.75a –0.25 ± 0.87b 1.25 ± 0.45a 16.690 2 0.0002
35
4. Discussion
A multipleprey experiment with M. nudus cultured in aquaria indicated preferential grazing of S. longissima compared to the brown alga Agarum cribrosum, the green alga
Ulva pertusa, and the red alga Neodilsea yendoana (Machiguchi et al. 1994). The feeding
rates on S. longissima, S. japonica, and Saccharina angustata were high compared to those on other macrophytes (Machiguchi et al. 1994; Nabata et al. 1999). In addition, feeding experiments demonstrated that Saccharina kelp promotes gonad production of M.
nudus (Agatsuma 1999; Nabata et al. 1999). Gonad size can be increased at any time of
year (e.g. Andrew 1986; Klinger et al. 1997), but it is most readily manipulated in the season when nutrients are beginning to be mobilized for gametogenesis. In the Sea of Japan and the Tsugaru Strait in southern Hokkaido, Japan, gonad development of M.
nudus proceeds from the recovering stage to the growing stage from January to May and
to the maturation stage from June and August (Fuji 1960b; Agatsuma et al. 1988). The gonads increase in size during the growing stage (Fuji 1960b; Agatsuma et al. 1988) due to accumulation of nutrients in NPs (Holland and Holland 1969; Walker et al. 2005; 2007; 2013). These past studies support the premise that the observed enhancement of gonad production and associated changes in gonad qualities of M. nudus in the current study were due to feeding with S. japonica for 42 d. The low consumption of U. pinnatifida stipes would be also affected by low water temperature of < 6 °C (Agatsuma 1997). In addition, low protein content supports this finding. Temporal decrease in water temperature to < 6 °C in April is assumed to be affected by southward First Oyashio Intrusion in the Pacific waters along the northeastern coast of Japan (Mizuno 1984; Ogawa 1989), which might decrease the kelp intake of M. nudus (Agatsuma et al. 1996; Machiguchi et al. 1994).
36
McBride et al. (2004) first examined gonad hardness of Mesocentrotus franciscanus using a creep meter and reported that gonad hardness is affected by reproductive cycle, with greater values in fall during the recovering and growing stages than in spring during the maturation stage. At the end of the culture experiment, gonad hardness of EC and EK urchins was lower than that of EB urchins, likely due to differences in gonad development between growing and recovering stages (i.e., increased numbers of gametogenic cells and predominance of NPs in EC and EK urchins). Harder recovering gonads of EB urchins is coincident with that of the recovering gonads in M. franciscanus starved for 3 months (McBride et al. 2004). For both sexes of sea urchin, gonads containing predominantly NPs are preferred by consumers (Walker and Lesser 1998; Walker et al. 2007; Phillips et al. 2009; Unuma and Walker 2009; 2010). One of the best gonad qualities is firmness (Agatsuma et al. 2004; Kato and Schroeter 1985). Moreover, gonad hardness is a major factor associated with texture. Sensory evaluation indicated a higher texture score for gonads from the kelp bed urchins than from the barren urchins, which suggests that growing gonads with less hardness relative to the recovering gonads but harder than mature gonads are preferred. Some studies indicated that lower gonad texture or firmness values were linked to high water content of the gonad (McBride et al. 2004; Pearce et al. 2004), but this relationship is not always detected (Pearce et al. 2002b; Azad et al. 2011). Moisture content of mature and partly spawned gonads is greater than that of recovering to growing gonads, leading to differences in hardness (McBride et al. 2004). In the present study, no relationship between gonadal moisture content and hardness between recovering and growing gonads was detected.
L* values of the ovary and testis at the end of culture were similar to those of the
37
This result indicates improvement of L* by consumption of S. japonica. Low ΔE*ab
values of ovary and testis of EC urchins compared to those of EB urchins also indicate improvement of total color (L*, a*, and b*) regardless of the lack of difference in a* and
b* between the gonads from EC and SCB urchins. Sensory evaluation results revealed a
significantly low score for color of gonads of urchins from the barren, which likely explains the low L* value. These results were confirmed visually. Yellow and reddish colors of sea urchin gonads are caused by carotenoids, mainly βechinenone (Griffiths and Perrott 1976; Goodwin 1980; 1984; Matsuno and Hirao 1989). Additionally, in all urchin specimens except for EK, testes had higher a* and b* values than ovaries. This would be responsible for the sexual difference in content of the pigment in gonads (Goodwin 1984; Borisovets et al. 2002). Agatsuma et al. (2005) reported that brown colorization of M. nudus gonads occurred in individuals at > 7 years of age and also < 7 years of age with small size gonads due to low food availability. Ages of sea urchins used in the present study varied among urchin specimens but all were below 8 years of age: 2 years from the kelp bed, 2–6 years from the barren, and 2–7 years for culture. Low L* values indicating brown color were particularly observed in the gonads of SCB urchins. Using urchins collected from a habitat with low food availability as the starting point demonstrated improvement of gonad color by shortterm feeding with S. japonica. For improvement in cage cultured urchins, choosing the subjects younger than 8 years is necessary.
The present study firstly compared the uniformity of gonad quality of cultured and wild urchins quantitatively. In the present study, coefficients of variation of gonad indices, gonad water content, and gonad color (L*, a*, b* values) for EC individuals were low compared to those of SCB urchins and almost the same as or less than those of EK urchins.
38
Coefficients of variation of gonad hardness for EC urchins were also lower than those for EK and EB urchins. These results indicate that the uniformity of good quality among individuals was upgraded in cultured urchins, which should lead to increased confidence in sea urchin buyers and thus result in enhanced market value.
Komata (1964) reported that the free amino acids closely associated with sea urchin gonad taste are Glu, Ala, Gly, Met and Val. In contrast, Asp, Pro, Thr, His, Lys, Phe, Tyr, taurine, cysteine and tryptophan are not associated with gonad taste. Of the sweet tasting FAAs in the gonads of EC urchins, Ala content per 100 g of testes (339.3 mg) and ovaries (379.4 mg) was much higher than that of the other urchin specimens. Hirano et al. (1978) reported that Ala content in testes and ovaries of M. nudus fed Saccharina sp. and U.
pinnatifida for 11 months until June was 269 mg and 164 mg, respectively. In gender
mixed gonads of adult M. nudus fed S. angustata for 8 weeks from June to August, Ala content was about 280 mg (Nabata et al. 1999). In contrast, Ala content in testes and ovaries of M. nudus fed frozen S. japonica var. ochotensis for 2 months from April to June was 42.8 mg and 38.0 mg, respectively (Inomata et al., 2016). In sexmixed gonads of wild Diadema setosum, alanine content increased from 25.7 mg/100 g in April to 260.9 mg/100 g in June and then decreased to 27.7 mg/100 g in October (Kaneko et al. 2012). Komata et al. (1962) examined FAA contents in gendermixed gonads of three species of sea urchin from the wild and reported that alanine content was 91.8 mg in March, 126.5 mg in July, and 102.0 mg in August for H. pulcherrimus; 102.8 mg in August for
Heliocidaris crassispina; and 126.0 mg in March and 101.1 mg in July for S. intermedius.
Alanine content of mixedgender gonads of H. crassispina fed U. pertusa, U. pinnatifida, and Sargassum spp. for about 7 weeks from April to June was 231 mg, 261 mg, and 308 g, respectively (Osako et al. 2006). These alanine values from past studies are low
39
compared to those in the gonads of M. nudus fed S. japonica for 42 d in the present presumably due to gonad developmental stages, and among species and by feed type. Phillips et al. (2010a) indicated umami and sweet taste of wild Evechinus chloroticus testes and ovaries are correlated to Glu and Gly concentrations, respectively. However, in the present study, there were no significant differences in these FAAs among the gonads from all urchin specimens. Degree of sweetness of Gly is comparable to about 60% of that of Ala (Schutz and Pilgrim 1957). The organoleptic threshold values of Ala and Gly are 60 mg/100 mL and 130 mg/100 mL, respectively (Kirimura et al. 1969), although little difference in the taste between these free amino acids was obtained from sensory examination (Komata et al. 1962). Even so, the marked increase in Ala content of gonads from EC urchins is likely to make a major contribution to sweet taste. Of the bitter tasting FAAs associated with gonad taste, Komata (1964) reported that Arg in the gonad makes the taste undesirable. There was no significant difference in Arg content in gonad by sex among the EC, SK, and EK urchins, although Arg content in testes from EC urchins was higher than that in SCB urchins. Leu, Met, Tyr and Val contents in the gonads of EC urchins were higher than those of EK and/or EB urchins. Val is an essential FAA for a specific sea urchin gonad taste (Komata et al. 1962; Murata 2009). While, synergistic effects of increase in these other bitter tasting FAAs and increase in sweet tasting Ala on gonad taste remain unclear. In the present study, sensory evaluation of gonads was not conducted separately by urchin gender. However, the significantly higher score of sweetness of the gonads of cultured urchins compared to those from the barren was caused principally by the markedly high levels of alanine content in testes and ovaries of EC urchins. Higher bitter tasting FAA contents (excluding Arg and Lys) and higher Ala content in the gonads of EC urchins compared to those from the kelp bed might have
40
contributed to the lack of significant difference in the sensory scores of overall taste between them (although bitterness was not scored in the sensory evaluation).
FAA contents in sea urchin gonads increase at the maturation stage (Lee and Haard 1982; LiyanaPathirana et al. 2002; Osako et al. 2007). Increase in levels of most FAAs in the growing gonad of EC urchins compared to the recovering gonad from SCB urchins may be attributable to the development of germ cells. Hirano et al. (1978) examined sexual differences in FAA contents in the gonad of M. nudus in June after feeding with
Saccharina sp. and U. pinnatifida. They reported a high proportion of Ile, Thr, Lys, and
Arg in the ovary and of Glu, Ala, and taurine in the testis. In the present study, the same sexual differences in the contents of Thr and Ile were detected. This may suggest that sexual differences in FAA contents in the gonads vary according to food source as well as feeding season and length, which affect gonad development.
In the present study, gonad size, color, hardness, taste, and consistency among individuals of M. nudus collected from barren habitats could be improved to reach a level similar to that of animals from the E. bicyclis kelp bed by cage culture and shortterm feeding with Saccharina kelps. In particular, sweet tasting alanine contents of the gonads were markedly high.
41
Section 2. Culture from winter to spring
1. Objective
After the mature stage, gonads appear to be melting because of eggs and sperm ooze from the gonoduct, and the gonad cannot maintain their consistency (Unuma 2002). Because the commercial quality of sea urchin gonad decreases after the initiation of gametogenesis because of the melting state (Lee and Haard 1982; Unuma 2002; Unuma et al. 2003; Reunov et al. 2004; Dumont et al. 2006), sea urchins are harvested before gametogenesis when nutritive phagocytes (NPs) are fully developed. To improve gonad yield and suppress gametogenesis for harvesting urchins during the high market value season, some researchers have focused on controlling photoperiod and water temperature (Walker and Lesser 1998; Böttger et al. 2006; Dumont et al. 2006), utilization of deep seawater at a stable low temperature pumped from a depth of greater than 200 m (Unuma and Kayaba 2015), and triploid sea urchin generation (Böttger et al. 2011; Walker et al. 2015). Section 1 showed that feeding on fresh S. japonica cultivated between April and June enhances gonad production and improves gonad color, texture, and taste of M. nudus from a barren similar to urchins on the E. bicyclis kelp bed (fishing ground). This indicates that earlier initiation of S. japonica feeding potentially improves gonad quality, resulting in a high market value. In the present study, M. nudus were collected from a barren in December and cultured in cages in the wild until May, in addition to a laboratory circulation rearing system until March without abiotic factors such as wave action. Both urchins were fed fresh cultivated S. japonica. This study aimed to (1) clarify whether gonad size and quality (color, texture, and taste) can be improved before the fishing season and (2) verify the possibility of an early harvest.
42
2. Materials and methods (1) Cage culture
A total of 500 adult M. nudus (45–55 mm TD) were collected by scuba diving from a barren at depths of 3–4 m off Nojima Island, Shizugawa Bay, Miyagi Prefecture (38°40΄N, 141°30΄E), on 11 December 2014. Immediately after collection, the sea urchins were kept in five cages (n = 100 each) suspended horizontally along a straight line at a depth of approximately 2 m at a wavesheltered site off Areshima Island in the bay for 155 days until 15 May 2015. This site is the same as Section 1. The horizontal distance between each cage was approximately 3 m and the vertical distance between each cage and the seafloor ranged 7.5–9.3 m. The polyethylene cages were cuboid (90 × 87 × 45 cm) with 3 cm meshes. Fresh S. japonica cultivated were fed to the urchins ad libitum every 7–10 days. From observation of the amount of uneaten kelp, I regulated the amount of kelp fed to the sea urchins. The kelp was cultivated by longline method. Water temperature during culture was measured every 15 min by two data loggers (HOBO UA002–64, Onset) attached to the upper surface of the cages at both ends of the culture line. Daily water temperature was calculated as an average of 96 data points over 24 h. During the cage culture, the ambient photoperiods of daily light and dark length changed from 9.5 h:14.5 h to 11.5 h:12.5 h (National Astronomical Observatory of Japan 2016).
(2) Laboratory culture
Eighteen adult M. nudus were collected from the same site on the same day of cage culture. After collection, they were kept in a cool box with moist urethane mats immersed in seawater, then transported to the laboratory in Sendai (38°28΄N, 140°87΄E) for about 2 h. Each sea urchin was held individually in a 3L aquarium (26.5 cm length (upper), 22
43
cm length (bottom), 14.5 cm height, and 10.5 cm width) of a circulation rearing system (ZHab Mini System, Aquatic Habitats, Apopka, FL) with 18 aquaria on three shelves. A fluorescent was set above six aquaria on each shelf. The feeding experiment was started immediately after transportation. Using artificial seawater (Live Sea Salt, Delphis, Itami, Japan), the turnover rate of seawater in each aquarium was regulated at two to three times per hour. Water temperature and salinity were controlled almost the same as that of the cage culture in Shizugawa Bay (realtime monitoring data of oceanic environment by Tohoku EcosystemAssociated Marine Science). Seawater salinity, DO, pH, and NH3 ion concentration were measured every 4 days using a COND METER (ES51, HORIBA, Kyoto, Japan), DO METER (OM51, HORIBA, Kyoto, Japan), and pH/ION METER (D 53, HORIBA, Kyoto, Japan), respectively. The seawater was kept at 31–33 psu salinity, greater than 6.64 mgO/L, 7.51–8.17 pH, and less than 500 mg/L NH4 by substituting a third of the rearing seawater every 4 days. Photon flux density of the fluorescents at the surface of aquaria was at 167.2 ± 8.5 (SE) mmol photon/m2/s, measured three times using a quantum sensor (LI250A, LICOR, Lincoln, NE). Of 18 sea urchins, nine individuals were fed fresh S. japonica ad libitum as an experimental treatment and the other nine individuals were starved as a negative controlled treatment. The aquaria of both treatments were selected randomly. The laboratory experiment was conducted for 84 days until March 5, 2015. Seawater temperature in the aquaria was monitored every 1 h by a data logger (RTR52A, T&D, Nagano, Japan). Daily water temperature was calculated as an average of 24 data points over 24 h. One urchin fed with S. japonica and two starved urchins died during the experiment.
44
At the start of experiments, 40 sea urchins (45–55 mm TD) were collected from the barren in the same manner as that described for the cultures. Because the gonads removed from one urchin were insufficient for use of all measurement and analysis items, 20 urchins were used for measurements of gonad color and the other 20 urchins were used for gonad hardness and moisture. The other measurement and analysis items TD, BW, gonad index, age determination, histological observation, and FAA content) were performed using 40 urchins. At the end of the cage and laboratory experiments, six cultured urchins were collected randomly from each of five cages (n = 30). In addition to these cultured urchins, 15 laboratoryreared urchins that survived were used for all measurement and analysis items. Except for the gonad color measurement, all measurement and analysis items were conducted one time for each urchin. Overall, four treatment groups of M. nudus were assessed: at the start of the rearing experiments, at the end of cage culture (C), at the end of laboratory feeding (LF), and at the end of laboratory starvation (LS). The measurements and analyses conducted were same as those in Section 1. No gonad hardness of LF and LS could be measured because of the small number (n = 7 and 8) and the markedly small size.
(4) Statistical analysis
Statistical analysis was conducted using JMP 10 software (SAS Institute Inc.). Data were tested for normality (Shapiro–Wilk Wtest) and homogeneity of variances (Levene’s test). Some of the data were logtransformed to ensure normality and homogeneity of variances. Differences in TD; BW; gonad index; L*, a*, and b* values; ΔE*ab; and FAA contents at the start and end of the experiments among the four treatments were analyzed with oneway ANOVA with Bonferroni correction (α = 0.0019). Tukey’s multiple
45
comparison test was performed as a post hoc test. The difference in gonad hardness between the start and end of cage culture was analyzed with Student’s ttest.
3. Results
(1) Water temperature
Figure 9 shows the changes in daily water temperatures. Water temperature of the laboratory culture almost matched with that of the cage culture in Shizugawa Bay. The water temperature at the start of cultures was 11.9°C, it decreased to 5.1°C in midMarch, and then became erratic. From late March, it increased to a peak of 14.3°C in early May, and then sharply decreased to 8.9°C in midMay.
(2) Urchin body size and age
Table 8 shows TD and BW weight of M. nudus in each treatment. There were significant differences in TD and body weight among treatments (Table 9). The TD and BW of the sea urchins in treatment C were significantly larger than those in the other treatments (p < 0.01). There was no significant difference in BW between the sea urchins at the start of the experiment and in LF (p = 0.33). The BW of the sea urchin in LS was significantly less than that in the other treatments (p < 0.05). All urchins used for experiments were 3 y of age.
(3) Gonad development and gonad index
Gonad developmental stages of M. nudus by sex in each treatment are shown in Table 10. Sixtyfive percent of gonads at the start of the experiment were in the recovering stage, with small numbers of primary spermatocytes or previtellogenic oocytes along the acinal
46
Dec. Jan. Feb. Mar. Apr. May
Cage culture Lab culture
Figure 9. Daily water temperatures at the upper surface of cultured cages (n = 96) and in the main tank of the circulation rearing system (n = 24).
47
Table 8. Test diameters (TD) and body weight (BW) of Mesocentrotus nudus by treatment (mean ± SE).
Start, C, LF, and LS indicate M. nudus at the start of the rearing experiments, at the end of cage culture, at the end of laboratory feeding, and at the end of laboratory starvation, respectively. Lowercase letters indicate significant differences among treatments (p < 0.05). Treatment N TD (mm) BW (g) Start 40 47.5 ± 0.3b 46.2 ± 0.6b C 30 52.9 ± 0.4a 70.8 ± 1.2a LF 8 47.6 ± 0.5b 49.8 ± 2.6b LS 7 48.0 ± 0.6b 38.4 ± 0.6c
48
Table 9. Results of oneway analysis of variance for test diameter, body weight, gonad index, color, moisture, and free amino acid (FAA) contents in gonads of Mesocentrotus
nudus among treatments.
df MS F P
Test diameter Treatment 3 180.53 57.19 < 0.001
Error 80 3.16
Body weight Treatment 3 4115.61 135.93 < 0.001 Error 80 30.64
Gonad index Treatment 3 1.63 176.11 < 0.001 Error 80 0.01 L* Treatment 3 0.03 18.52 < 0.001 Error 60 <0.01 a* Treatment 3 16.89 4.88 0.004 Error 60 3.46 b* Treatment 3 99.68 3.62 0.018 Error 60 27.52 ∆E*ab Treatment 3 0.59 11.76 < 0.001 Error 60 0.05 Moisture Treatment 3 33.41 4.58 0.006 Error 60 7.30
Total FAA Treatment 3 6634900 61.71 < 0.001 Error 80 107518
Aspartic Acid Treatment 3 2.69 2.04 0.115 Error 80 1.32
Glutamic Acid Treatment 3 0.70 23.40 < 0.001 Error 80 0.03 Alanine Treatment 3 144092 38.50 < 0.001 Error 80 3743 Glycine Treatment 3 49692.4 3.12 0.031 Error 80 15926.0 Proline Treatment 3 3520.1 15.68 < 0.001
49 Error 80 28522.7 Serine Treatment 3 2.11 47.01 < 0.001 Error 80 0.04 Threonine Treatment 3 4.93 74.66 < 0.001 Error 80 0.07 Arginine Treatment 3 90401.2 13.44 < 0.001 Error 80 6724.8 Histidine Treatment 3 5832.0 71.08 < 0.001 Error 80 82.05 Isoleucine Treatment 3 2.73 60.98 < 0.001 Error 80 0.04 Leucine Treatment 3 3.40 85.76 < 0.001 Error 80 0.04 Lysine Treatment 3 0.28 11.63 < 0.001 Error 80 0.02 Methionine Treatment 3 8288.60 48.10 < 0.001 Error 80 170.24 Phenylalanine Treatment 3 2.08 47.16 < 0.001 Error 80 0.04 Tyrosine Treatment 3 83581.9 104.05 < 0.001 Error 80 803.3 Valine Treatment 3 71081.9 79.13 < 0.001 Error 80 898.3 Taurine Treatment 3 1.99 70.05 < 0.001 Error 80 0.03 Ornithine Treatment 3 2342.3 116.07 < 0.001 Error 80 20.18
α-aminobutyric acid Treatment 3 93.42 22.01 < 0.001
Error 80 4.24
Significances (α < 0.0019 due to the Bonferroni correction) are shown as bold. (Continued)
50
Table 10. Gonad developmental stage of Mesocentrotus nudus by treatment and sex.
Start, C, LF, and LS indicate M. nudus at the start of the rearing experiments, at the end of cage culture, at the end of laboratory feeding, and at the end of laboratory starvation, respectively.
Treatment
Recovering Growing
Female Male Percent
(%) Female Male Percent (%) Start 8 18 65.0 2 12 35.5 C 3 2 16.7 13 12 83.3 LF 3 4 87.5 0 1 12.5 LS 2 4 85.7 1 0 14.3