トップページ - 横浜国立大学学術情報リポジトリ
22
0
0
全文
(2) AEeffectofNiCrystals ' 37 function of its magnetization (and of the amplitude ofstress). It is therefore expected that Young's modulus of the demagnetized state is generally smaller. than thaLL of the magnetized state. This phenomenon is uSually known as the AE effecLL, first investigated experimentally by Hondai) in 1902. Since. then, many reports on this phenomenon have been published. They are reviewed by Becker and Db'ring2), and Bozorth3). However, almost all the investigations have been carried on by polycrystals, so the experimental study. on the AE effect in single crystals are very few. Only Kimura4) measured the effect in single crystals of iron of various orientation and Yamamoto5) also investigated on iron and nickel crystals. In nickel crystals he found peculiarities quite similar to thoSe in the case of iron crystals. Bozorth6) also investigated the various elastic constants of single crystals ofnickel and their change with magnetization by a urtrasonic pulsing Method. But further measurements in single crystals have been expected to proceed. The reason why such desired studies are few is due to the diMculty of obtaining single crystals. Now we have investigated into this problem and tried to' explain. th'e effect, based upon the conception of magnetic domains. This is the object of the present study.. As a result of the existence of the AE effect, a question as to what is the・normal Young's modulus in ferromagnetics occurs. It should bestressed that Es, the value at saturation, is the normal value6)7), that is, the value it could possess if the magnetostriction were zero, as Young's modulus in ferromagnekLics. The value at demagnetized state, Eb, is only for a practical use. In the demagnetized staLLe the Hooke's law does not hold strictly and, moreover, Eo has not always a unique value, because the distribution of the magnetic domain vectors can differ from time to kime, even in the state of. zero magnetization. Actually, there were remarkable fluctuations for the values of Eo, about±O.6 per cent, in our measurements. On the contrary, in the saturated state the domains, accordingly Ek, are fixed; Ek is a purely elastic modulus. I"L should be noted that volume magnetostriction of nickel is generally so small that it can be ignored usually. Thus we take always Ek for a basic value and the customary measure of the magnitude of the AE effect is expressed as aE7Els, where dE==E---Ek is the difference between the values of Young's modulus at a magnetized state, E, and its value at saturated state, Ek. Of course, this expression has not an essential distinction from. the ordinary expression, d'E/Eb, with respect to the demagnetized state, where d'E= E-Eo and should be distinguished from dE It is easily reduced to another form by the following relation, and vice versa,. ' ' d'EVEb==[--(dEYEs)+(AE/Eg)o]・[1+(dE7Es>o], (1) ' ' '. wheire (AE7Ek)e= (Eb-Els)/Eb, the value of dE/Eb at the demagneti2ed state;.
(3) 38 T. Watanabe, Y. Gond6 and Z. Funatogawa By the above reason, we should chooze Eg as a starting point and measure the dEeffect on the descending hysteresis curve. On ehe descending hysteresis curve, the distribution of magnetic domain at the residual point can be assumed theoretically. The following relation. b/Is=1/i/'iii-Bi (2) is easily derived, where k is the magnetization at the residual point, Is the saturation magnetization, and・BbB2 and B3 are the direction cosines of the rod axis with respect to the three cubic axes, [100], [OIO] and [OOI], respec-. tively, in order of the magnitude. The relation (2) is held in both regions. whereBi>B2+B3 and Bi<B2+B3. It should be noted that the residual is a mark po'int which divides the hysteresis curve into two branches-one for the higher magnetization according to "rotation`' process, that is, a change in the direction of magnetization of the domains, and the other for the lower magnetization corresponding to " moving boundary " process, that is, a change in the volume of the domain. dE effect must be explained by these conceptions and already several theories2),8-i3) have been proposed. But their experimental. .. ,. confirmation may not be satisfactory yet.. MeasuTements of Young's modulus may be performed by either a 'static. loading or dynamical method, which gives values of the isothermal and adiabatic Young's modulus, respectively. At present rather the dynamical method has usually been adopted, because the dynamical method can give the more accurate result than the statical ane and can make measurements possible by enough small stress. There are several methods of exciting longitudinal oscillations and detecting resonance, or measuring the velocity of a pulsed elastic wave.,They are reviewed by Bozorth3) briefly. We have adopted the method of longitudinal vibration excited magnetostrictively, as described in g 3.. g2. Preparation of Crystals. ,. One way to investigate on anisotropic propertieS of ferromagnetic crystals is to use the single crystals, prepared for a slender cylindrical rod form with. desired orientations. In another case the use of a disk form of the crysta! is more desirable. For the study of dE effect by means of the magnetostrictive vibration, however, the former is more convenient. As a rule, single crystals of nickel and other metals, which have no transformation in a solid phase, are usually produced from the melt by Bridgman methodi4) (or its modified form)i5)i6) and a slow cooling methodi7)i8). The latter one is basically simple; a suitable quantity of the material is melted in an appropriate crucible and cooled in such a way that there is a small. temperature gradient along the specimen. On cooling through the melting. e.
(4) AE effect of Ni Crystals. 39. point the supercooled molten metal will solidify at one end and a crystal formed there will slowly grow as the rest of the material solidifies. On the other hand, the former method is founded on almost the same principle as described above, but it is an important difference between them that in the Bridgman method the IQwering of solidified crystals through a freezing point from the high temperature region with a suitable speed with respect to the crystal orientation is needed. By this method, using a seed and a suitable speed for lowering crystals, it is easier to produce a crystal of the selected orientation. Furthermore, its advantage is to be able to obtain a long crystal more easily, if the so-called "zone melting" method is used together, in which. only a small portion of the metal wire is melted at first and the melted region is moved gradually. Therefore we have adopted the modified method, almost the same as described by H. Takaki and othersi6), except the construction of the furnace. There are, however, remarkable practical difEiculties in the use of this' m' ethod with high melting point. metals such as nickel, etc. They are those of the high. 1J. 'ttt.z. temperature production and of protecting the samples and the. K. K. heating element from oxidation. Those difficulties are overcome by the use of a high resistance. wire-wound furnace operated in a vacuum without the use. L. 1. Tovaouum puMP. t. 2o02/secBoosrer. ・l. anct. 2oo2/m}'nRolary. of a heavy current such as in. ABcD. a Tamman furnace. For the heating element a molybdenum .t. or tungsten wire is conveniently. -. 1・-:. ・,. EFGHIOcm.. used. A reducing atmosphere such as hydrogen is not desir-. :.I・-,. :ii:[i. able for melting nickel, because. -". nickel absorbs hydrogen, thus producing 'inclusions of gas in. the specimen.. (A) Furnace and method. -. of growth・ Fig. 1. Diagram of furnace. Theverticalmolybdenum A,aluminacrucible;B,purealuminacoarse. resistance tube furnace is ?.ObW.d,erii,g,',.AiiN[l.,alX,M,i"aFl"b.e6'iybDd'..S.M.aAgll],ge.a, shown in Fig. 1. The heater Sf.,",iC ei!.dS.e.ed; aJ",dwWilr,e.i ,5siteeKi,Sh",P.PtO,r,tetr.l'.l・:. was prepared by winding a nal; L,lamp..
(5) 40 T. Watanabe, Y. Gond6 and Z. Funatogawa molybdenum w.ire (1.4 mm diameter) 50 times with 5mm in pitch on a T6kai. Rozai AM alumina tube of 54 mm in outer diameter. The casing, in which the furnace was mounted, was held in a vacuum, about 10-3mmHg, by a OB200--booster pump during operation. The temperar ture was observed with an optical pyrometer through the top glass window and also was crudely estimated, using the heating element itself as a resistance thermometer. When the temperature reached 15000C, the voltage applied. to the furnace was approximately 72V and the heating current was 22A, then the furnace attained an equilibrium state. During the operation, the voltage had to be held constant carefully to keep the temperature constant.. An alumina crucible of 3mm in inner diameter, 7mm in outer diameter and 40cm in length, with a seed and a nickel wire inserted to be melted (50cm length and 2mm diameter), was hung at the suitable position in the furnace by a thin molybdenum wire (O.08mrn diameter), was melted at the upper ・part of the seed and tbe lower portion of the wire, and then was lowered with a suitable speed from the melting point region. The control of the. e. ". lowering speed, from 4cm/h to 20cm/h, was attained by a synchronous motor and reduction gears. For this lowering mechanism a Wilson seal was applied.. As the seed became a nucleus for the growing of a new crystal, we could obtain the crystal with a desired orientation in most cases. Sometimes the rod produced by this procedure was divided into several crystals. Perhaps this occurred when the polycrystalline wire inserted in the crucible had not. slided down smoothly. We suppose that it was due to a "thermal shock", that is, the colder polycrystalline wire dropped suddenly into the supercooled. molten metal j.ust oyer the growing crystal and made it to solidify with independent orientations.. After the procedure, the crucible was broken carefully by a grinder and the ingot was removed; grain boundaries between crystals in the specimen was plainly seen by etching it in a conc. HN03. Its crystallographic orientation was determined by the X-ray rotation photographs. During the procedure, it was especially necessary to avoid・ introducing any undue strain.. (B) Specimens. ' '. The polycrystalline nickel wire used in our study was prepared with the courtesy of Tokyo Shibaura Electric Works Co., Ltd. and impurities detected by spectroscopic analysis were Mn, Fe, Si, Mg, Al and a trace of Ca as shown in Table 1.'The purity of the material was 99.6 % or more. Table 1. Spectroscopic analysis of materials. si. Al. Fe. +. +. ++. Mg +. Ca. Mn. trace. ++. .. ".
(6) ". AE effect of Ni Crystals T.able 2.Dimensions, orientations'and residu.al magnetization of. the specimens. b-calc. and 4-obs. denote the :calcqlated and observed values of residual magnetiza'tion, gespectively.. Specimen. number. No.. No. No.'. 1. Length (cm). Diameter. 17. 83. O. 284. (cm) O. '. Direction cosmes. 1)・-catc.. 1}- -obs・. (gauss). (gauss) 458 375 285. P2. P3. O. 633. O. 576. o. sls. 456. 289. O. 795. O. 602・. O. 073. 363. Pi. 2. 19. 72. 3. 20. 00. O. 284. O. 999. O.O13. O. O13. '289. N-. '12a. .18. 16. O. 277. O. 922. O. 307. O. 237. 313. N N. 13a. 19. 14. O. 277. O. 883.. O. 467. O. 052. 14a. 20. 90. O. 278. 0. 958. O. 223. o. 17s. 327 301. N. 15. 20. 04. O. 279. O. 996. O. 091. o. ooo. .N. 17b. 21. 07. O. 281. O. 994. O. 108. .O. 022. Polycrystal. 20. 20. O. 197. 294 285. 290 290. 290 396. [m]. All the specimens prepared were cylindrical rods and annealed at 9000C for 2 hours in a vacuum. The constants of the specimens are shown in Table 2.. 315 366. p,<Q+e. G >U+&. b-caic and b-obs in the table are calcu-. NI2a. lated values by Eq. 2 and observed values. o Nol. N. xN. Nl4a. N. N. N N・. of the residual magnetization at room temPeratures, respectively. Fig.2shows. No3. the stereographic projection of the. [IOO]Ntqb Nt3aNo2,["o]. orientations of the specimens.. N. Nl o. o. o. NN. N. Fig. 2. Stereographic projection of the orientation of the specimens.. g3. Experimental Method The Young's modulus, E; and its change dE dde to magnetization were determined by the resonance frequency of the forced longitudinal vibration, produced magnetostrictively, and applied to the specimeni9)ac). The magnetic properties weTe measured ballistically. The magnetic field was produced by a water-jacketed solenoid, 40cm in length, of the field constant of 59.5 Oe/A. The homogeneity of the magnetic field produced was within 2 per cent over the length of 20cm in the central position of the solenoid. For rods vibrating in the longitudinal mode this fundamental resonance frequency is given by the relation. ' ' E=4plij2(1+ cr22712, "2 ), (3) where l is the 1'ength of the rod, r the diameter of the ' rod, p its density, f. '.
(7) [ I. I 1. I i. 42 T. Watanabe, Y. Gond6 and Z. Funatogawa the fundamental resonance frequency and fo its Poisson ratio. Because the magnitude of the second term in the brackets of (3) is so small as the order. 1. of 10-5 the relation is reduced to. '. r'. '. '. E= :4p l2 f2 (4). by neglecting it. Th'ts resonance frequency f is measured as a function of the externally,applied magnetic.field, Hle.., and the value for the saturated magnetized state, k, is determined in hlgh fields, where the saturat'ion is attained. Then, the change Qf Young's modulus with respect to that for the saturated magnetized state can be estimated by the next formula,. ,,i,1 '1 AE,'-EI;==':2`if1/lf'lg ' 'I (5) Practically, :thls change of the resonance frequency, of, .is measured as the. w. change of the capacity of t'i e variable condenser 'in the osc'illator, illustrated. below. Thus the following relation .. dE7Eb=2dC/Cs (6) '. is finally used in order to compute the change of Young's modulus, where Cs II?stchheaCnagPea. CitY Of the Variable condenser at the saturated state and Ac is. Fig. 3 shows the block diagram of the measuring system. The center of the specimen, that is, a node of the longitudlnal v'sbration was clamped as weakly as possible on the kpife edge supporter. Both ends of the specimen. 2--STAGE V;ACUUiVI TUBE. C.R OSCILLATOR AMpLIFIRE VOLiTMETER. tVIAaNETIZtNa N -t -. 1. COIL. l. '. l-- -. vOH OSCiLLOG-RAPH. .. 1 ' 1 SPECIMEN, --l. .e. JJY. STANDARD SIqNAL. RECE!VER. D,C VOLT74qE ST)4LBiLlZER. Fig. 3. Block diagram of the Measuring system.
(8) AE effect of Ni Crystals - 43 were inserted into a "driving coil" and a "detecting coil", respectively, avoiding any contact with the coils, in order to prevent an o'bstruction against the measurement. They are illustrated by Fig. 4. The former coil was composed of a solenoid wound 500 times (B.S. #35), the length of which was 1cm, and the latter was that wound 5000 times (B.S. #35), the length of which 2.5cm, on each .of two glass tubes of 1cm in diameter, respectlvely.. & .Is,g. ee 'i "' ;'. zaes,. ・ge・. .ljii. Il ,". ・ew =tec va・. Fig. 4. Mounting of the specimen. A, magnetizing soSenoid; B, specimen (20cm in length); C, driving coii; D, knife edge supporter; E, detecting coi!; F, brass tube base.. Then they were put in the magnetizing solenoid, as shown in Figs. 3 and 4. By alternating the magnetic field of the driving coil fed by an oscillator, the longitudinal vibration was excited in the specimen. The oscillator consisted of two parts, 6AG7-6AG7-6V6; a master oscil-. lator, and one stage of power amplifier. The master oscillator was the modified Wien bridge type C--R circuit and was supplied by an electronically stabilized powersource. A good wave form was obtained by this oscillator. The detailed circuit diagram is shownin Fig.5. The frequency of the oscillator was calibrated by comparison with the 1000 c./sec modulated wave of the JJY. Frequency Standard (4Mc/sec). When the specimen was vibr4ted magnetostrictively, the E.M.F. was induced in the detecting coil, then it was amplified and measured by a vacuurn tube voltmeter. In Fig. 5 these circuits are.also given in detail. The reading. of a micro-ammeter (paA I in Fig. 5, the indicator of the vacuum tube volt-. meter) increased steeplY arid stiowed a sharp maximum when the resonance point was reached. The capacitance of the oscillator was composed of two.
(9) T. Watanabe, Y. Gond6 and Z. Funatogawa. 44. emG. SK. tg;4n. 3os. :. ) ,. '. ,. :. PF, `. '. s. '. e. ,q22. e-ee. .- -b e a-. d--- ee -t)'. S50V `toM. :. -:eee. e-e e--. -eee. 4SPF. O.tM. l8o K. " `. 6s a. P. 3oseF. 'B + 2sov. (lsTABguzlsD). {M. --eoape. PF. .gsyfi. !QAfii7. 2trK. SOO .3W. m. 2K. 39K. o,tM. 6gR. SZPK. ISoV. 22K. SM. tew. tOK. sk. fOOR. o.fM. '. tetvvtA"v3oA. I'b Ped. 7keSii. lo-. 4. 'A. tl. &XQQ XXXXQXQ SPEClMEN. A. MAqNE"r1ZgN(l?e COtL. @@@e@@OOOOOOOO'. 6SN 7. 6AiVZ5. 6SQ7. aQ6iz! z.sr. '. -. ' ' tM. 2eK. 'o,o2: 'o,ei o.osM - t-) ee. dpp ebee. -- -"n- de. `- -p. ' o,ts 3K tOO k. sqM. IM. 2SO , K. e) t-). '. ' 2soK , 2.M50eK 3K SzzM 2of,C tt SM. '. tu ---th toe SK. ln. tOKha. `. fe K. 3o K. 30 k. 6 b'. gs+o v (sT)aiBiL1zEoj. '. Fig. 5. Connection diagram of the apparatus. '. variable condensers of different capacities connected in parallel (in order to. perform fine adjustments), the total amount of the capacity being from 18 to 394 pF. The resonance point could be eas'ily determined to one tenth of ・the scale division. of the, condenser (90pF in fUll) connected in parallel, hence.
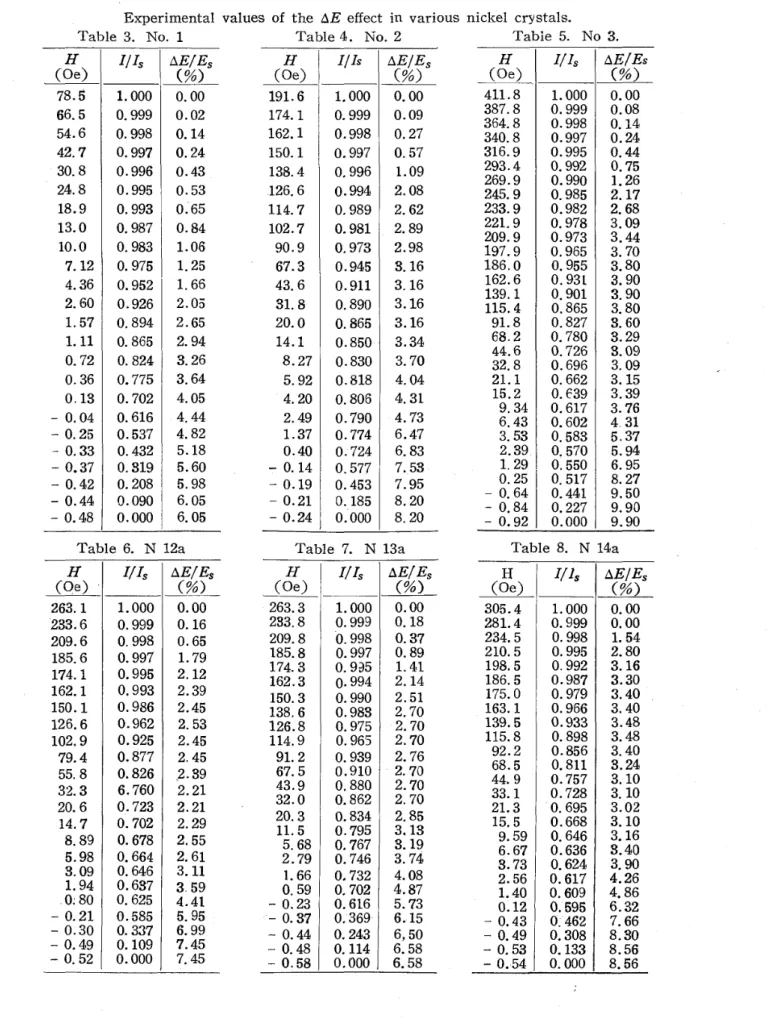
(10) AE effect of Ni Crystals 45 to about 1/4000 of the total capasity. An example of the resonance curve is shown in Fig. 6.. 60. -. ?. -t so 3 s・ 40. 2 : 30 2,. 2o. ..'. HEx=. .2.Z(oE). I-. 2tZ(ptos. o `'NNN,,.. to e. o. 10 t2 t4 t6 t8 20 2Z gn . SCALE DF CONDENCER. Fig. 6. An example of the resonance curve.. When such a dynamic method of magnetostrictive vibration was used, it was very necessary that the amplitude of the driving field current should be taken as small as possible. In our measurements this current was limited to 50paA, therefore, the high frequency magnetizing field produced by the. current was only about O.030e in maximum. It was the most important progress on the experimental procedure that by such a small field dE effect. could be investigated. ・ ・ .,・ AII the measurements were perforn bed at the same temperature,'about 180C. g4. Experimental Results Measurements of ttne change of Young's modulus were carried out ats several points on the descending hysteresis curve usually, at room temperature. Fig. 7 shows the change of Young's modulus relative to that for the saturated state, dE/Ek, as a function of the magnetic field, Hlzff. Here only those 'of. three crystals, with principal axes, a tetragonal crystal No. 3, a diagonal crystal No. 2 and a trigonal crystal No. 1, and a polycrystal'are shown. About these experimental values and those of other crystals, not shown in this figure, Tables 3 to 11 should be referred. ILL is rioted that very remarkable. anisotropy is observed. As shown there, Young's modulus of a trigonal.
(11) 1 i. T. Watanabe, Y. Gond6and 'Z. Funatogawa. 46・. H ,FF. oo 1. foe). 3oo. 2oo. ioo. M. No2. POLY. 400. No3. 2 3. 9, 4. ×-. xZ. /. (iie,)s. ". 6. -7. t,. '. 3. Fig. 7. Relative change of Young'si modulus AE/Es, as a function. ・ ofthemagneticfield,H;innickelcrystals. ' crystal, with the direction of the easiest magnetization increases quickly at low fields, but the rate of increase gradually diminishes as the field increases and finally satura't'ep. On the other hand, in crystals with the d'trection of more diMcult magnetization Young's modulus increases at first, has a "plateau". in the following stage, especially showing even a decrease in [100], and increases again quickly just before the saturation.. In Fig. 8 and Fig. 9 the relative change of Young's modulus is shown as a function of the reduced magnetization, that is, the ratio of the intensity of magnetization, 1, t・o the saturation magnetization, k, and is tabulated in Tables 3 to 11, too. Generally, Young's modulus increases gradually with the increase of magnetization, but after the ,magnetizatiQn exceeds the residual point, which is indicated in the figures, the rate of increase once diminishes remarkably, even showing a decrease in [100], and then increases again very abruptly to "che saturation. Corresponding to the field dependency, in the trigonal crystal these anomaly are not seen.. -. "・.
(12) '. 47. AE effect of ' Ni Crystals. ,SI)(s --.--------------. ot. OO.tO,2O.3Q4O,5OSO,7O.8O,9t.O '. 2. 3. '. '. 4. a. <r. n. 5. 'NoI. '. '. x. 4g, 8. c% (--). n. x. 9. No3. ii`. .. p "13. '. n/. po>tl. ... '. n. Fig. 8. Relative change of Young's modulus, AEIEs, as a function of the reduced't magnetization, I/Ib, in nickel crystals, with the principal orientations: '. --m--pt- JI(GI,. o o,t o,2 a3 o4 o,s a6. o. O.7. 09. o,g. E. i.o. '. n-"-hNA. n-. 2. e--.o. t. /. g ,. .dnE g,. a. o. e. A -". o. e) 10 11. '. '. Fig. 9. Relative change of Young's modulus, AEIEk, as a function of the reduced magnetization, I/Is, in nickel crystals, without the principal orientations..
(13) T. Watanabe, Y. Gond6 and Z. Funatogawa. 48. Experimental values of the AE effect in various nickel crystals. Tabie 5. No 3. Table 3. No.1 Tab!e4. No.2 I/ Is 11 fs AEZEs l!4 AE/Es AE!Es (Oe) (Oe) (Oe) (%) (%) (%). H. H. H. 78.5. 1. 000. o. oo. 191.6. 1. 000. o. oo. 411.8. 66. 5. O. 999. O.02. 174. 1. O. 999. O.09. 54. 6. O. 998. O. 14. 162. 1. O. 998. O. 27. 387. 8 364. 8 340. 8. 42. 7. O. 997. O. 24. 150.1. O. 997. O. 57. 30. 8. O. 996. O. 996. 1.09. 24. 8. O.995. .126. 6. O.994. 2. 08. 18.9. O, 993. O.43 O.53 O:65. 138. 4. 114. 7. O. 989. 2. 62. 13. 0. O. 987. O. 84. O. 981. 2. 89. 10.0. O. 973. 2.98 3. 16. 245. 233. 221. 209. 197. 186,. 3. 16. 162.6. O.93t O. O. O. O. O. O. O. O. O. O. O. O. O, O. O. O.. 316.9 293.4 269.9 9 9 9 9 9 O. O. 983. 1.06. 7. 12. O. 975. 1. 25. 102.7 90.9 67.3. 4. 36. O. 952. 1. 66. 43. 6. O.945 O.911. 2. 60. O.926. 31. 8. O. 890. 3. 16. 139. 1 115. 4. 1.57. O. 894. 2.05 2.65. 20. 0. O. 865. 3.16. 91. 8. 1. 11. O. 865. 2. 94. 14.1 8.27. O.850・. 3. 34. O.830 O.818. 3. 70. 68.2 44.6 32. 8. 4. 04. 21.1 15.2. O. 72. O. 824. 3. 26. O. 36. O. 775. 3. 64. O.13. O. 702. 4. 05. - O. 04 - O. 25. O. 616. 4. 44 4. 82. O.33 - O.37 - O.42 - O.44 ・-. - O. 48. O.537 O. 432 O. 319 O. 208. O.090 o.ooo. 5.18 5. 60 5. 98 6. 05. O. 806. 4. 31. 2. 49. O.790. 4. 73. 1.37 O.40. O. 774. 6.47. 9. 34 6. 43 3. 53. O.724. 6. 83. 2. 39.. -- O. 14. O. 577 O. 453 O. 185. 7. 53 7. 95. 1, 29 O. 25 - O. 64. - O.19 - O.21 - O.24. 6. 05. Table 6. N 12a. H. 5. 92 4. 20. AE/Es (%). 263. 1. 1.000. '233.6 209. 6. O. 999 O. 998. o. oo O. 16. 185. 174. 162. 150. 126. 102.. 6 1 1 1 6 9. O. 997. O. 65 1. 79. O. 995 O. 993. 2. 12 2. 39. O.986 O.962. 2.45 2. 53. 126.8. 2. 45. 114. 9. 79. 55. 32. 20. 14. 8. 5. 3. 1. .O:. 4 8 3 6 7 89 98 09 94 80. O. O. O. 6.. 2, 45. 91. 2 67. 5. - O. 21. - O.30 - O. 49 - O. 52. 925 877 826 760. O.723 O. O. O. O. O. O.. 702 678 664 646 637 625. O.585 O. 337 O. 109. o.ooo. 263. 233. 209. 185. 174.. 162.3. 43.9. 29 55 61 11. 95 99 45 45. ・・. O. O. 1. 2.. 234. 210. 198, 186. 175. 163. 139. 115.. 997 995 994 990 983 975 965 939. O.910 880 862 834 795 767 746 732 702 616. 37 89 41 14. 2.51 2. 2. 2. 2. 2. 2. 2. 2. 3. 3. 3.. 70 70 70 76 70 70 70 85 13 19 74. O.'369・. 6.15. O. 243 O. 114. - O.58. o.ooo. 6, 50 6. 58 6. 58. 2.79. 4.41. O. 998. - O. 37 - O. 44 - O. 48. 5. 68. H. (Oe) 305.4 281.4. O. O. O. O. O. O. O. O.. 4. 08. 4.87 5. 73. O.997 O. O. O. O.. 995 992 990 985. O.982 O. 978. O.973 O.965 O. 955 901 865 827 780 726 696 662 639 617 602 583 570 550 517 441 227. o.ooo. o. O. O. O. O. O. 1. 2. 2. 3. 3. 3. 3. 3. 3. 3. 3. 3. 3. 3. 3. 3. 3. 4. 5. 5. 6. 8. 9. 9. 9.. oo 08 14 24 44 75 26 17 68 09 44 70 80 90 90 80 60 29 09 09 15 39 76 31 37 94 95 27 50 90 90. -・. d. Table 8. N 14a. o. oo O. 18. 1. 66 O. 59 - O.23. IL 5. - O.84 - O.92. 1. 000 O. 999. O. O. O. O. O. O. O. O. O.. 32. 0 20. 3. 3. 59 5. 6. 7. 7.. 3 8 8 8 3. 150. 3 138. 6. 2.39 2.21 2.21 2. 2, 2. 3.. 8. 20 8. 20. Table 7. N 13a AE/Es ll4 ff (Oe) (%). U4. (Qe). o.ooo. 1. 000 O. 999 O. 998. 5 5 5 5 0 1 5 8. 92.2 68.5 44. 33. 21. 15. 9. 6. 3. 2. 1.. 9 1 3 5 59 67 73 56 40. O.12 - O.43 - O. 49 - O. 53. - O.54. Uls 1. 000. O. O. O. O.. 999 998 995 992. O.987 O. O. O. O.. 979 966 933 898. AE/Es. (%). o. o. 1. 2. 3. 3. 3. 3.. oo oo 54 80 16 30 40 40. O.757 O.728. 3. 3. 3. 3. 3.. O. 695. 3.02. O.856 O. 811. O.668 O. 646. O.636 O. 624 O. 617 O. 609 O.'595 O:'462 O. 308 O. 133 o. ooo. v. 3.48 48 40 24 10 10. 3. 10 3. 16 3. 40 3. 90. 4.26 4. 86 6. 32 7. 66. 8.30 8.56 8. 56. e.
(14) AE effect of Ni Crystals. 49. Experimental values of the AE effect in various'・ nickel' crystals.. Table. H. (Oe) 442. 412. 388. 365. 341. 317.. 3 3 3 3 3 4. 293. 9・. 275.4 258. 4. 234.4 210.5 175. 1 139. 6'・. 103. 9 80. 4. 56.8 33.2 21. 4. 15.5 9. 64 6. 71 3. 78. 2.61. 1. 47. O.38. - O.45. 9. N15. Table 10. N 17b. H. U4. AEIEs. (%). (Oe). 1. 000. o. oo 0..10 O. 24 .o. 3i O. 54 O. 94 1. 54. 412.3 388. 361. 341. 317. 293.. O.998 O. 996 O. 9)5. O.992 O. O. O. O.. 990 988 985 977. O.970 O. O. O. O. O. O.. 955 920 875 822 782 736. O.686 O. O. O. O. O.. 654 634 614 602 587. O.582 O.56D O. 544. - O. 55. O.445 O.149. - O.66. o. ooo. 275.3 258.3 234.4. 2.34 3. 24. 3.84 3.94 4.04 3.94. 210. 4 175. 0 139. 5. 103.9 80.3. 3. 84 3. 84. 3. 3. 3. 3. 3. 3. 4. 5. 6.. 74 64 64 64 84 94 68 04 40. 7. 9. 9. 9.. 93 20 73 73. 3 3 3 3 8. 56. 7 33. 1 21. 3. 15.5. 9.59 6.67. 3. 75 2. 58 1.42 O. 29. ny4. Table 11. Polycrystal. AEIEIs. (Oe). 1.000. o. oo. O. o. O. O. O. O. O. O.. O.11 O.i9 O.43 1.03. 324. 9 295. 4. 999 9gs 997 996 995 994 993 987. O.977 O. O. O. O. O.. 945 895 840 795. 2. 2. 3. 3. 3. 3. 3.. 07 77 35 63 74 74 63. ・3. 5 6. 3.35. O.696. 3. 14 2. 93. O. 665. 2.88. O.646. 2. 88 2. 99 3. 14. 748. O. 624. O.610 O. 595 O. 590-. 3.734.42. 271.9 247. 9. 223.9 .199.4 176. 4 152. 4. 128.9 105.0 8L 3. 57.6 46.7 33..8 27. 9 22. 0 16. I. 10:2 7. 21 4. 28 3. 12. U4. AEZEs (%). l.ooo. o. O. O. O. O.. O. 999. O.998 O.997 O. 996 O ・994 O. 992 O. 988 O. 978 O. 967 O. 950 O. 926 O. 910. O.892 O. 877. O.866 O.850 O. 832 .O. 820. O. 87 - O. 07. 8.75. - O.38 - O.48. o. ooo. O.83. o. ooo. ,8. 75. 1.72 2. 12 2. 68 3. 12. 3. 3; 3. 3.. 25 37 46 56. 3.56 3. 68 3. 93. 4.21. 5.45 6.30. 6.50. - O. 44 - O. 73. 1. 98. 1.00 1. 28. 5. 06. 8. 50. 5. 40. oo 16 31 47 72. O.796 O. O. O. O.. O.582 O.566 O.440 O.196. -・. H. (%). 783 760 720 600. O.180. 7. 87. 10.4 13.1 13.1. g5. Elastic Constants At the same time, Young's moduli at magnetically saturated gtates, Ek, and at unmagnetized state, Eb, were computed by using values for frequency, fk and fb, corresponding to each state, and the Iength of the specimen as well as its density. They are given in Table 12. According to the theory of elasticity, in cubic crystals such as nickel 1/E;. the reciprocal of Young's modulus, and rc, compressibility are expressed by the following relations:. ' 1/E=S,i--2(Sii---Si2・---!!ll4)(B3Bg+BgB?+B?B3) (7) '. ''. rc =3(Sii+2 S,,), (8) where Sn, Si2 and S44 are the elastic constants in Voigt's notation, and Bi, B2 and B3 are direction cosines of the rod axis of the specimen with respect to the crystallographic tetragonal axes. Thus we tabulate- values of 1/Ek and 1/Eb of various crystals in Table 12 and shew 1/Eg as a function of 3Z- in. ..
(15) l. :. :. l /. l. T. Watanabe, Y; Gond6 and Z. Funatogawa. 50. :. Table 12. 0bserved values of Young's modulus in nickel crystals.. !. Eb and Eb denote Young's modulus at the magnetically saturated. l. state and at the unmagnetizdd state, respectively. r ( =Pl.PZ+P:P:+P&P2, is the orientation function.. Specimen number. Eo q (dyne!cm2) (dyne/cm2). 3T. Direction*. 12. 12. -12. × 10 O. 366. O. 9870. 2. 91. 2.73. 2. [111] [110]. O. 7029. 2, 42. 2.22. O. 412. O. 450. 3. [100]. O. OOIO. 1. 34. 1. 20. O. 747. O. 833. 12a. [4tl]. O. 3996. 1. 75. 1. 62. e.573. O.616. N. 13a. O. 5150. 2.04. O. 458. O. 490. N N N. 14a. L210] [511]. 2. 18. O. 2287. 1. 50. 1, 37. O. 665. O.730. 15. [100]. O.0244. 1. 40. 1. 26. O.716. O.794. 17b. [100]. O. 0334. 1. 36. 1.24. O. 734. O. 805. 2.,34. 2. 02. O. 427. O.495-. N'. 1. Poly.. × 10. -12. × 10 O. 344. No. No. No.. × 10. 1/Eo 1/Eb (cm21dyne) (cm21dyne). v. `. * See Fig. 2. O,8. o. O.7. e. k. O,6 x1ol2. O,5 .. OA. f. '. O,3 .. Q2 tt. al. o. at. 'a2. O,3. --------n---. 04. a6 ov ) 3(tfel+ofal+ofe2) O,5. o,g. 09. e t.o. Fig. 10. The reciprocal of Young' modulus, 1/Es, at the saturated state as a function of the orientation function, 3L in nickel crystals. t/ '. t/ tttit. tt tt. t. ' Fig. 10, where I-'(=B3B3+BgBl+B?Bg) is the orientation function. Here 3I', ' three times of the orientation function, is taken by usage. As expected from '. (7) it is noted that these measured points are placed on a straight'line. e.
(16) AE bffect of Ni Crystals 51 (. approximately. SubstituLLing the values of 1/Ek into (7), we obtain values of. Sn and Sn-Si2--&. 2!4-・. Further estimation for Si2 and S44, we intend to use the measured values of compressiblity for polycrystalline nlcke12i). In any metal, wtchout distinction. of the crystal lattice, the compressibility should be the same for a single crystal as for a polycrystal, since the compresslbility of a single crystal does. not depend upon the orientation. It may be reasonable if theeffect of graln boundaries in the polycrystal is negligible and for some'metal$ it has been testified. The most reliable experimental isothermal coMpressibility of polycrystalline nickel as determined by Bridgman22) and modified by Slater23) is. the following value: ' rc = O.535 × 10-i2 cm2/dyne.. ' Substituting this valu'e into (8), we can obtain Si2 and further S44. The. results obtained are ' '. '. Sil== O・73sXIO-12cm2/dyne,. Si2==-O.28oxlO-i2cm2/dyne, (Saturatedstate). S44= O.814×10-i2cm2/dyne, (g) for nickel at the saturated state. The moduli of elasticity, Cii・, calc-ulated by Si]・ for nickel at the saturated state are g'lven, too:. Cii= 2.53o×10i2dyne/cm2,. Ci2=1.54sxlOi2dyne/cm2, (Saturatedstate). '' C44==1.23sxlOi2dyne/cm2. ' (lo)' Further, the elastic an'lsotropy factor A is obtained by.. A =='2 C44/(Cii--C,2)=2.50. (Saturated state) (11). Atthe unmagnetized state, too, these values are computed by the same procedure as above. These are given as follows:. Sn = O.82sxlO-i2cm2/dyne, S12 = -O・321 ×1O-12 cm2/dyne,. S44=: O.872×10-i2cmnydyne, (Unmagnetized state). Cn=2.46×10i2dyne/cm2, ' (12) tt t' Ci2==1.58×10i2dyne/cm2., . ・ ・. Cl4= 1・14sxlOi2 dype/cm2,' '. - ・A--2.62 It should be stressed the fluctuations of the measured values of 1/JEb from the straight, line in the 1/llb vs I' curve are larger than t.hat of 1/Ek, and cpnsidered in g6. The va!ues pbtained, (10), (11) and (12) are summarized in Table 13,. 1.
(17) T. Watanabe, Y. Gond6 and Z. Funatogawa. 52. g6. Discussion (A) Young's modulus and the elastic constants. The elastic constants of nickel have been measured by seVeral investigators. The data reported are summarized in Table 13. Among them, the data of Yamamoto2i>, Honda and Shirakawaat), Sh"irakawa and Numakura25> are for Table 13. Elastic constants (in 1012 dyne/cm2) of nickel crystals. M,a.g,n.e,t.i,c,adiiy Investigators. Unmagnetiz.ed. Cll. C12. C44. Cll. C12. C44. This paper. 2. 53. 1. 55. 1. 24. 2.46. 1.58. 1. 14. Bozorth et al.6). 2'. 1. 23. 2. 50. 1.' 60. 1.185. 2. 524 1.538 L 23. 2. 52. 1. 54. 1. 229. 2: 517. 1;574 1.226. t!.. 6). rt 6) Neighbours26). Yamamoto21) .Honda and. Shirakawa24) Shirakawa and. Numakura25). , 53. 2. 523. 2.526. 1. 58. 1.566 1. 52. 1. 23. 1. 238. Remarks *10 kc magnetostrictive vibration.. 10 Mc ultrasonic pulsing method. (velocity measurement). rf. m. '. rt 10 Mc ultrasonic pulsing method. *20. kc magneto-. 2. 44. 1. 58. 1. 02. 2.52. 1. 51. 1. 04. *Static loading method.. 2. 25. 1, 49. O. 91. *Static loading method. strictive vibration.. (calculated from &D. * Observed value of compressibility z==O.535×10-12cm21dyne was used.. unmagnetized only and the variety of values may be expected, as shown in the table, because Eb is sensitive to heat treatment and domain configuration.. Eb is, moreover, a function of the stress used. The larger to some extent t.he stress, the smaller Eb.is in general. The,result of the static method shown in the table may be due to the larger stress used there. This should be also recognized in the results of the dynamic method. Therefore, it is necessary that a stress used should be as small as possible. It has already. '9. stated in g3 that our measurements were carried out by the very small stress.. As already mentioned in g1, therefore, in ferromagnet'tcs the value at the saturation, Ek, is the norrhal Young's modulus. So the values of Bozorth et al.6) and Neighbours et al.26> should be compqred directly with the present. result and agree well with each other, in spite of a difference in the method of measurements. (Frequency used is about 10 kc by us and .10 Mc by Bozorth and others.) For reference, reliable values for unmagnetized in our investigation are g'iven, too; it is interesting that the change of C44 is the most remadrkable. Accuracy of the absolUte of E itself is worse than its relative change value dE7E; of course, due to the difference ofthe measuring method; but the variety of the values for unmagnetized state is remarkable Qver the. -17.
(18) dEeffectofNiCrystals ' 53 '. experimentalerror,particularlyinthedirectionof[110]. '1 (B) The change of Young's mbduluS with magnetization. ,' ' The forms of dE./Els vs H curve.and of AE7El; vs-I curve are dlfferent accord`ing to their orientation. Some peculiarities, found outaboutthem,are quite similar to those on iron crystals qualitatively, as already reported by Yamamoto5>, replacing [100] in iron to [111] in.niCkel. Namely, in nickel as well as iron the behavior of the specimen with a direction of easy' magneti. zation is almost 1ike qualitatively, while with a direction of diMcult magnetizatfon 'it holds the same, too. But a consideration on this behavior, espec'ially. on unlike one, has not been carried on in detail. The essential feature of the phenomena could be explained by the magnetic doma・in theory by consider'tng LLwo processeS of the mechanostriction; rotations of the domain magnet'ization vector and d'tsplacements of the magnetic domain boundaries due to the applied stress. Becker and Db'ring2), Db'ringi3) and Takagii2) and others have proposed the domain theory on the dE effect.. As shown in Figs. 8 and 9, there are two stages of abrupt increase of the dE; near the res'idual point and just before the saturatiozi. The latter,. we consider, corresponds to the rotatfon proqess and, on the other hand, the. former may correspond to the moving boundary process, as well. In th'ts case the residual point may be a mark point which partitions both processes. Due to a mechanical vibration, however, the residual point. may be affected. and can not be decided as a point clearly in the experiment. Thus it is nothing but a marker, we suppose, near which the change due to the moving boundary process abruptly enlarges on the descending hysteresis cu'. rv'. e. As. a matter of fact, they are always found out near the middle point of the firstincreaseofAEinthedEvsIcurves,inFigs8and9.--. ., Tab. ' '. ,-. X・;,k4,s,]l.aexei,&f,Je's.t',".e,.c.h,a,",,g,e.g`,.Y,O,"."g'.S,.M.gd.",'g,S,.'",.g,i,C.k8'l '・. pointandunmagnetizedstate,respectively.'Tistheorientation. function... - . ... Specimen number-. Direction*. 3T. (AE7Ek)r. (AEZEs)o. (%). - (%). [lil]. O. 9870. ' 6.1. . 2.o. 2 3.. [110]・. .O. 7029. 8. 2. [100]. O.・OOIO. ,10 .' 1. 6. 1 5. 8. N. 12a. [411]. O. 3996. N. 13a. [2101. O. 5150. 7. 4 6. 6-. N. 14a.. [511]-. O. 2287. 8.6. N N. 15. [100]. O. 0244. 9. 8. 6.2. 17b. [100]. O. 0334. 8.9. 5, 8 5. 2. No.. 1. No. No.. l3. 2. Poly. ,f See. Fig. 2.. .'. 3.5 3.9・ 4. 5. ..
(19) 54 T. Watanabe, Y. Gond6 and Z. Funatogawa (ri1!IEk)r, the values of dE7Eb at the residual point, and (dE7Eb)o are tabulated in Table 14 and shown in Fig. 11 as a function of the orientation functibn. The values are found to be a straight line, that is, a linear function of 3I", as expected by the D6ring's theory2),i3), but it is interesting that a. remarkable deviation from the line has been found on the specimen with the direction of [110] and [210]. A consideration on this anomaly is now in. progressandwillbereportedinfuture. .' ''';i'・. LB . t t/ /tt. ttt. '. e. (2s). oI=O. dR, g. '. (%). '. e),6. ・4. A. (lfleSIs). 5. N-s. 1=I,. g. N. N .. .-,. N. ? o. SNN. ,. {Nb. NN. . N. Ngbs. o at a2 o,3 o4 as o,6 ol og og--"o - 3< 62of+de+ e2e2). Fig. 11. (AEIEb)r and (AE/Eb)o as a function of the orientation function.. (C) Frequency dependency. According to Bozorth6), in his experiments at 10 Mc, the greatest change. of Young's modulus was only about 3 per cent, while in usual resonance experiment ,at 10 to 20 kc, adopted also in,our experiment, the value has been. observed by 16 to 20 percent at room temperature.' He has suggested this considerable distinction occurs due to relaxation of the domain wall motion by micro"eddy-current damping at higher frequency. The decrease of AEIEb. -. and the equivalent increase. of the logarithmic decrement due to eddy-current. damping with frequency for a polycrystalline nickel are shown in Fig. 12 after Bozorth6). The frequency used in our experiments is about 10kc, where frequency dependencies of damping・and dE7Eb are very remarkable as shown in the figure. Therefore, the cause of the variation of experimental dEIE value should be due to the variety of dimensions of the specimen, namely, the proper resonance frequency, and to the variety of domain size. In our experiment the unexpected result for a polycrystal, dE of which is larger than that for single crystals, could be explained by the eddy-current shielding. theory to $ome extent, The thinner the sample and the smaller the domain size, the larger the dE effect should be observed. Whether the first abrupt. e.
(20) AE effect of Ni Crystals 55 18. v. 16. d. i4. "Ro. t2. A. ' (Mto g. 2 .t. e. o. Vs-5.oo x1oS E,=2,2 2 xiO. c!ls(Ec i,9iC' 'DYNES. 2CM'. ' .,Oo, ;zo ap.6o 80'100 l20 14Q i60't80. .FREQUENCY (Kc) Fig. 12. Relative change in Young's modulus and the decrement, as a function of frequency for a polyc.rystalline nickel. (After Bozorth.). increase near the residual point appears or not, therefore, is influenced by the eddy-current shielding due to higher resonance frequency, if the crystals were free from imperfection and strain.. g7. Summary The nickel crystals of a slendet cylindrical rod form were grown by the modified Bridgman's method in a molybdenum wound resistance furance in a. vacuum. (g2) Young's modulus and its change with magnetization, the dE effect, of the nickel crystals were measured by the dynamical method of magnetostrictive vibration at room temperature. The method of measurement and the construction of the measuring apparatus is described in detail. (g3). The results obtained are the followings: '. ' (1) The normal value of Young's modulus in ferromagnetics is Ek, the value at the saturated magnetized state, where the magnetic domains are. ,aligned all together and the additional magnetostrictive strain is negligiblly small. Actu,ally, Ek was determined uniquely in accordance with other investi-. gators, while Eb, the ELvalue at the unmagnetized state, was not as expected.. Thus we took always Ek for a basic value and the customary measure of the. magnitude of the dE effect was expressed as dE7Es, where dE==E-Es. A conversion formula frpm the expression dE7Ek to the ordinary expression. }.
(21) 56 T. Watanabe, Y. Gond6 and Z. Funatogawa d'E/Eb was given. (g 1, g 5, g6). (2) Generally, Young's modulus increased gradually with the increase of magnetization, but after the magnetization exceeded the residual point, the rate of increase once diminished remarkablly, even showing a decrease in [100], and then increased again very abruptly to the saturation. In [111]. the change was simple and the first step disappeared. This behavior was quite similar to that of iron crystals qualitatively, as already reported by Yamamoto5), replacing [100] in iron to [111] in nickel. I't was suggested that. the first increase to the residual point was due to the moving boundary process, while the latter increase to the saturation was due to the rotation process. (,l!7Eb)r, the value of dE7Ek at the residual point, was plotted as a function of the or' i6ntation function 3IH'=3(B3B3+Bg,ei+B?BZ), where Bi, B2 and B3 where direction cosines of the rod axis of a specimen referring to the crystal axes, The curve was found to be a straight line, excepting the. specinieins,[110]and[210].(g4,g6) ' '. .. `. (3) The elastic constants of nickel crystals were determined by using the data of 1/E in the single crystal and reliable experimental data of compressibility in polycrystalline nickel. The results obtained'were Su=O.738,. Si2= ---O.280 and S44=:O.814×10di2cm2/dyne at thesaturatedstate. The moduli of elasticity were calculated to be Cii=2.53o, Ci2=1.54s and C44=1.23sxlOi2 dyne/cm2 at the saturated state. These values were directly compared with those obtained by means of velocity measurement of a 10 Mc pulse, and they c6incided well with each other, in spite of a difference in the experimental. method-in our case, resonance frequency measurement in about 10 kc region was used. (g 5, g6) (4) Frequency dependence of Young's modulus wasi discussed briefly. (g 6). ' H. Takaki In conclusiop, the authors wish to express their thanks to Prof. and the members of his laboratory of University of Kyoto who kindly gave adyice,and various conveniences in the preparation of nickel crystals, to Prof.. M. YaMamoto of T6hoku University and to Mr. N. Miyata of our laboratory. `. for' the,hglpful discussion and advice. The present work was partly supported. by the Scientific Research Expenditure from the Ministry of Education.. References. v. ' Mag., [6] 1) 'K. Honda, S. Shimizu and S. Kusakabe:' Phys. Z., 51 (1902), 380; Phi!. ・ '4(1902),338. 2) R. Becker and W. D6ring: Ferromagnetismus, Springer, Berlin (1939), p. 336. 3) R. M. Bozorth:, Ferromagnetism, Van Nostrand, New York (1951), p. 684. 4) R. Kimura: Proc. Math.-Phys. Soc. Japan, 21 (1939), 686, 786; 22 (1940), 45, 219, 233.. 5) M. Yamamoto: Sci. Rep. T6hoku Imp. Univ., 31 (1943), 101. ' 6) R.M.Bozorth, W.P.Mason and H.J. McSkimin: Bell System Tech. J.,30 (1951),970.. x. ".
(22) AE effect of Ni Crystals 57 7) E. W. Lee: Rep. Prog. Phys., 18 (1955), 220. 8) Y. Nakamura: J. Phys. Soc. Japan, 10 (1955), 937. 9) N. Akulov and E. Kondorsky: Z. Phys., 78 (1932), 801; 85 (1933), 661. 10) M. Kersten: Z. Phys., 85 (1933), 708. 11) W. F. Brown: Phys. Rev., 50 (1936), 1165; 52 (1937), 325. 12) M. Takagi: Sci..Rep. T6hoku Imp. Univ., 28 (1939), 85. 13) W. D6ring: Z. Phys., 114 (1939), 579. 14) P. Bridgman: Proc. Am Acad. Arts Sci., 60 (1925), 305. 15) R. G!ocker and L. Graf: Z. Anorg. Chem., 188 (1930), 232; L. Graf: Z. Phys. 67 16) 17) 18) 19). (1931),388. -- '・. ' H. Takaki, S. Nakamura, Y. Nakamura, J. Hayashi, H. Furukawa and M. Aso:J. Phys. Soc. Japan, 9 (1950, 204. R. M. Bozorth, H. J. Williams and J. C. Walker: Rev. Sci. !nst., 20 (1949), 947. R. F. Pearson: Brit. J. Appl. Phys., 4 (1953), 115.. M. Yamamoto: Sci. Rep. T6hoku Imp. Univ., 27 (1938), 342.. 0.Engler:Ann.d.Physik,31(1938),145・ , 4. 2O) 21) M. Yamamoto: Sci. Rep. Res. Inst. T6hoku Univ., 5 (1951), 308; Phys. Rev. 77 (1950), 566. 22) P. W. Bridgman: Proc. Am. Acad. Sci., 58 (1923), 165. 23) J..C.Slater:Phys.Rev.,57(1940),744. " 24) K. Honda and Y. Shirakawa: Sci. Rep. Res. !nst. T6hoku U,niv., 1 (1949), 9. 25) Y. Shirakawa and K. Numakura: Nippon Kinzoku Gakkai-Shi, 19 (1955), 99 (in Japanese). 26) J. R. Neighbours, F. W. Bratten and C. S. Smith: J. Appl. Phys., 25 (1952), 389.. '. '. f. 1. '. '. t t. t.
(23)
図
関連したドキュメント
As with subword order, the M¨obius function for compositions is given by a signed sum over normal embeddings, although here the sign of a normal embedding depends on the
The method employed to prove indecomposability of the elements of the Martin boundary of the Young lattice can not be applied to Young-Fibonacci lattice, since the K 0 -functor ring
The inclusion of the cell shedding mechanism leads to modification of the boundary conditions employed in the model of Ward and King (199910) and it will be
Making use, from the preceding paper, of the affirmative solution of the Spectral Conjecture, it is shown here that the general boundaries, of the minimal Gerschgorin sets for
We show that a discrete fixed point theorem of Eilenberg is equivalent to the restriction of the contraction principle to the class of non-Archimedean bounded metric spaces.. We
Kilbas; Conditions of the existence of a classical solution of a Cauchy type problem for the diffusion equation with the Riemann-Liouville partial derivative, Differential Equations,
Answering a question of de la Harpe and Bridson in the Kourovka Notebook, we build the explicit embeddings of the additive group of rational numbers Q in a finitely generated group
Then it follows immediately from a suitable version of “Hensel’s Lemma” [cf., e.g., the argument of [4], Lemma 2.1] that S may be obtained, as the notation suggests, as the m A
