ORIGINAL RESEARCH
Reduction of iodine load and radiation exposure in liver CT images with lOOkVp CT with adaptive statistical iterative reconstruction
technique in routine CT examination
Eliko Tanaka, MD*/ Yoshitaka Sato, MD/ Tadayuki Okumoto, MD
Japanese Journal of Diagnostic Imaging 2016 Vol.34 No.2
ORIGINAL RESEARCH
Reduction of iodine load and radiation exposure in liver CT images with lOOkVp CT with adaptive statistical iterative reconstruction
technique in routine CT examination
Date of receipt: July 22-2015
Eliko Tanaka, MD* / Yoshitaka Sato, MD/ Tadayuki Okumoto, MD
Abstract
*Department of Radiology, JMA Ebina Medical Plaza (E.T.), Kanagawa, JAPAN.
*Department of Radiology, Showa University Fujigaoka Hospital, Yokohama, JAPAN Department of Radiology, JMA Ebina General Hospital, Kanagawa, JAPAN (Y. S., T.0.)
Objective: To assess whether the
low-tube-voltage CT imaging with the tube-voltage of
1OOk Vp using adaptive statistical iterative reconstruction technique (ASIR) may allow reduction of iodine load and radiation exposure dose to provide sufficient hepatic enhancement for adequate lesion detection in the clinical practice.
Material and Methods : Twenty three patients who
received twice contrast-enhanced abdominal CT examinations within
12 months; firstly at 120 k Vp with a
contrastdose of
1 OOml/bodyand
secondly at 100 k Vp with ASIR with a contrast dose of 1. 6 mL/kg were included. Estimated radiation exposure, mean CTnumber of portal
veinand hepatic parenchyma, AHU of hepatic parenchyma, CNRs, image noise, and FOM were
comparedbetween
100kVp-l.6ml/kg and
120kVp-100ml/body protocols.Two readers assessed the visual quality of the hepatic parenchyma on CT images.
Results: The mean CT number
of the portal vein, liver parenchyma and mean
AHU of hepaticparenchyma were significantly higher and the mean
CTDivol,mean
DLP,and mean estimated ED were sign ificantly
lower at the 100/ i Vp-1. 6m
l/kgprotocol than at the 120k Vp
-1 OOml/body protocol.There was no significant difference in overall image quality between the two protocols.
Conclusion: Low-tube-voltage
CT imaging using lOOkVp which is
available with commercially-supplied machines in city hospitals with ASIR allows significant reduction of iodine
load andradiation exposure dose while the image quality remains unchanged in
routine clinical examination.Keywords ; low dose CT, low voltage
CT,
contrast media,dose reduction
Jpn J Diagn Imaging 2016; 34 143-152Address reprint request to
Elilio Tanalw, M.D., Departmentof
Radiology,Showa University Fujigaolw Hospital, 1-30 Fujigaoka,Aoba-liu, Yolwham
a,Kanagawa, 227-8501, JAPAN
Jpn J Di agn Imaging-Vol.34 No.2 (2016) 143
Introduction
Periodic contrast enhanced CT examinations are widely used in patients after cancer surgery for screening of tumor recurrence and/or metastases or monitoring tumor response to chemotherapy. In the examinations, the contrast material is preferable to be limited to the acceptable smallest volume to avoid the risk of contrast-induced nephropathy which is closely associated with the dose of iodine used and preexisting renal dysfunction1l.
In addition, the amount of radiation exposure in each examination should be reduced, especially, in patients with a chronic clinical course who require repeated CT studies.
Recently investigated new technology of low-tube-voltage CT imaging has a potential to reduce those hazards since higher iodine contrast enhancement with this technique is obtained compared to the conventional imaging protocol using the tube-voltage of I 20kVp because the mean photon energy approaches the iodine k-edge of 33 keV2i. This technique has initially been applied in CT angiography, then recently in contrast-enhanced abdominal imaging, especially for solid organ imaging to reduce the dose of contrast agent as well as radiation exposure3·6
l. Although the image noise increases associated with a reduction of the tube- voltage, it is resolved and offset with the use of iterative reconstruction technique7l
In imaging the liver, a rapid injection of contrast agent at a speed higher than 3 mL/
sec is recommended to obtain adequate hepatic parenchymal enhancement, it is not always achieved in the clinical settings because of safety concerns depending on the size of injected veins. The low- tube-voltage CT imaging technique may also useful in these circumstances since it enhances the degree of contrast enhancement of the Ii ver parenchyma even with low concentration of tissue iodine and help hepatic lesion detection.
Most previous researchers have investigated
144 Jpn J Diagn Imaging-Vol.34 o.2 (2016)
and reported the low-tube-voltage CT technology with the tube-voltage of 80kVp, however, these techniques require higher tube current8l which is not always available with commercially-supplied machines in most city hospitals.
The purpose of our study was to assess the low- tu be-vo I tage CT imaging with the tube-voltage of I OOkVp using adaptive statistical iterative reconstruction technique (ASIR) may reduce iodine load and radiation exposure dose and provide sufficient hepatic enhancement for adequate lesion detection in the clinical practice.
Materials and methods
This study was approved by our institutional review board and informed consent was obtained.
Patients
Among patients who underwent contrast enhanced CT under the suspicion of metastatic liver tumors between October and November 2013, those with a previous contrast-enhanced CT examination including portal phase imaging in the preceding 12 months using tube-voltage of 120 kYp were considered for participants in this study. Patients more than 62.5kg of body weight were excluded.
Consequently, 23 patients were enrolled in this study consisting of 11 men and 12 women ranging in age from 35 to 83 years (mean, 68.9 years) and ranging in body weight from 45.9 to 62.0 kg (mean, 52.1 kg). In the preceding CT examination, a fixed dose of l 00 mL of iopamidol with an iodine concentration of 300 mg/mL (lopamiron; Bayer Healthcare, Osaka, Japan) was applied. Because of the indication criteria, patients with renal failure (eGFR < 30 ml/ min/1.73m2) or allergic history to iodinated contrast media are not included in our study.
CT protocol and contrast injection
In the preceding CT examination, all patients
were subjected to portal phase contrast enhanced imaging on a 64-detector CT scanner (Optima CT660, GE Healthcare, Tokyo, Japan). The scanning parameters were as follows: tube voltage, 120 kVp ; noise index, 12.0 Hounsfield units(HU) at 5-mm slice collimation; tube current, auto mA;
detector configuration, 64 detectors with 0.625- mm section thickness; beam collimation, 40 mm; rotation time, 0.7 second; pitch,.0984: I; and reconstruction algorithm, ASIR (GE Healthcare) of 50%. lopamidol-300 (lopamiron-300; Bayer Healthcare, Osaka, Japan) was delivered via a 24-gauge catheter inserted into the antecubital or forearm vein; a power injector was used to inject I 00 mL of contrast medium at a fixed injection rate of2 mL/s in all patients (120kVp-100ml/body protocol) . Then the patients were divided into two groups according to their body weight, another words, by the dose of administered iodine per Kg- body weight as one higher than 600mgl/kg and the other equal to or lower than that; (a) higher dose group: 12 patients with body weight ranging 45.9 to 50.0kg (average 48.0kg) and injected iodine dose ranging 600 to 652mgl/kg (average 626mgl/kg) and (b) lower dose group: 11 patients with body weight ranging 50.4 to 62.0kg (average 56.7kg) and injected iodine dose ranging 483 to 595mgl/kg (average 531 mgl/kg).
In the second scanning, All patients were scanned with the same 64-MDCT scanner as the following settings: tube voltage, I 00 kVp; noise index, 12.0 Hounsfield units(HU) at 5-111111 slice collimation;
tube current, auto mA; detector configuration, 64 detectors with 0.625-mm section thickness; beam collimation, 40 111111; rotation time, 0.6 second; pitch,.0984: l; and reconstruction algorithm, ASIR (GE Healthcare) of 70%. lopamidol-300 (Topamiron-300; Bayer Healthcare, Osaka, Japan) was delivered via a 24-gauge catheter inserted into the antecubital or forearm vein. All patients received l .6 mL/kg of contrast medium at a fixed injection rate of 2 mL/s. ( l OOkVp-l .61111/kg protocol)
In both protocols, all patient were scanned from the top of the clavicle to the pelvis in a cephalo-caudal direction. Contrast-enhanced CT including portal phase imaging at 80 seconds after the initiation of contrast injection was obtained following the pre-contrast unenhanced scanning in all patients.
Quantitative image analysis
Quantitative measurements of CT images were performed at a commercially available PACS viewer by a radiologist (E.T.) who was blinded to the image protocol and results of qualitative image evaluation.
The both image sets obtained with two different protocols in each patient were displayed side by side with a preset soft-tissue window (window width, 300 HU; window level, 40 HU) setting. Mean CT number (in Hounsfield units) for portal vein, liver and right paraspinal muscles were measured by manually placing circular regions of interest (ROls) at the same image level. CT numbers of the portal vein were measured in ROls of approximately 25 1111112 on three contiguous different slice levels near the level of the bifurcation of the portal vein, and were averaged. CT numbers of the liver were measured in three RO ls of approximately 150 1111112 set in the right anterior segment, right posterior segment, and left lobe not including visible blood vessels, bile ducts,tumors, or artifacts and were averaged. CT numbers of the paraspinal muscles were recorded in RO Is of approximately 70 1111112 on three contiguous different slices not including macroscopic areas of fat infiltration, and were averaged.
For each protocol, image noise was calculated as the standard deviation of the pixel values from a circular or ovoid ROI of approximately 30 1111112 set in a homogeneous region of the subcutaneous fat of the anterior abdominal wall. For all measurements, the size, shape, and position of the ROis were kept constant among each protocol by applying a copy and paste function of the PACS viewer. The
Jpn J Diagn Imaging-Vol.34 No.2 (2016) 145
contrast-to-noise ratio (CNR) and figure of merit (FOM) were calculated as "CNR = (mean CT numbers of hepatic parenchyma -mean CT numbers of muscle )/image noise" and "FOM = CNR2 / ED (effective dose)", respectively.
Effective dose (ED)
The CTDlvol and dose length product (OLP) values produced by the CT scanner were recorded for each patient and protocol. Then the effective doses (ED) were obtained by multiplying the dose length product (OLP) values with conversion factors (0.015)9).
Evaluation of liver enhancement
The mean enhancement value of hepatic parenchyma was defined as increase of mean CT number of the liver parenchyma on portal phase of contrast-enhanced CT (6H U) compared to that of unenhanced CT. Since a minimum enhancement value of 50 HU is regarded necessary to ensure adequate conspicuity of low-attenuation hepatic lesions10
l,
numbers of patients who showed the mean enhancement values greater than 50 HU were counted.Qualitative Image Analysis
Qualitative analyses of the images by the two protocols were performed independently by two radiologists (T.O. and Y.S. with 19 and 4 years of experience in radiology, respectively) for image contrast, image noise, and overall image quality. The CT data sets were randomized, and the radiologists were blinded to the acquisition parameters. All images were displayed at a window level and width of 40 and 300 HU, respectively (standard abdominal window settings) and their adjustment was allowed during the qualitative assessment. The readers used a 3-point subjective scale to grade image contrast, and overall image quality : I, unacceptable; 2, acceptable; and 3, good. Image noise was similarly graded: I, noise present and interfering; 2, not
146 Jpn J Diagn Imaging-Vol.34 No.2 (2016)
interfering; 3, minimum noise. In cases of inter- observer disagreement, final decisions were reached by consensus.
Statistical Analysis
We used the two-tailed paired t test to compare estimated radiation exposure, mean CT number of portal vein and hepatic parenchyma, 6HU of hepatic parenchyma, CNRs, image noise, and FOM between I OOkYp-l .6ml/kg and I 20kVp- l OOml/body protocols. The chi-square test was used to compare the number of patients who showed 6HU greater than 50 HU between I OOkVp-l .6ml/kg and 120kYp-
l OOml/body protocols. The Wilcoxson singed-rank test was used to compare qualitative CT images.
Differences of p < 0.05 were considered statistically significant. All the statistical analyses were done using the R statistical package, version 3.1.1 (2014)
Results
Radiation Exposure
In contrast-enhanced CT imaging, the mean CTDlvol, mean OLP, and mean estimated ED were significantly larger with I 20kVp-l OOml/body than with I OOkYp-l.61111/kg protocol. The mean CTDlvol and the mean estimated ED were 11.0%
and I 0.7% lower in the l OOkVp- l.6ml/kg protocol compared to the 120kVp-100ml/bodyprotocol, respectively. Neither of the mean CTDivol, mean OLP, nor mean estimated ED demonstrated any significant differences between the two protocols in unenhanced CT examinations.
Contrast media dose
The average of volume of injected contrast material in patients with the I OOkYp-l .6ml/kg protocol was 16.5% lower than with the 120kYp-
l OOml/body protocol. Moreover, the reduction rate of the average of volume of injected contrast material was 22.3% in patients with higher dose group (>=600mgl/kg) and 9.1 % in patients with
lower dose group ( <600mgl/kg), respectively.
Quantitative Image Analysis
The mean CT number of the portal vein and liver parenchyma at the IOOkVp-l.6ml/kg protocol was significantly higher than those at the I 20kYp-
l OOml/body protocol and no significant difference
Table 1 Radiation dose
100kVp-l.6ml/kg mean CTDivol (mGy)
non-contrast enhanced CT 9.7±3.1 contrast enhanced CT 8.9±1.9 mean DLP (mGyxcm)
non-contrast enhanced CT 257.8±85.0 contrast enhanced CT 719.5±157.5 ED (mSv)
non-contrast enhanced CT 3.9±1.3 contrast enhanced CT 10.8±5.6
Table 2 Contrast material dose and quantitative image analysis
was found in mean image noise. Mean CNR of the liver at the I OOkVp-1.6ml/kg protocol increased significantly by 20% at the 120kYp-1 OOml/body protocol (Table2). Both higher dose group and lower dose group were similar trends (Table 3, 4). Mean FOM was significantly high at the l OOkYp-1.6ml/
kg protocol compared to the value at the 120kYp-
120k V p-1 OOml/body p-value
9.0±3.8 0.19
10.0±2.8 <0.05
228.8±101.9 0.1 815.5±231.8 <0.05
3.4±2.3 0.1
12.1±3.5 <0.05
100kVp-1.6ml/kg 120kVp-100ml/body p-value Mean contrast material dose
480 580.5±56.2
per body weight (mgl/kg) Mean CT number (HU)
Portal Vein 183.5±30.4 157.2±24.4 <0.0 1 Liver
non contrast 63.4±7.5 63.4±6.3 0.58
contrast enhanced 121.9±13.9 111.7±13 .8 <0.01
Muscle 65.6±8.7 63.7±8.2 <0.05
Mean t:.HU 56 .2±15.1 48.1±14.0 <0.0 1
Mean image noise (HU) 5.6±0.9 6.1±1.2 0.08
Mean CNR 10.0±2.4 8.0±2.4 <0.01
Jpn J Diagn Imaging-Vol.34 No.2 (2016) 147
I OOml/body protocol on the higher dose group, but not significantly different compared to the lower dose group (fig. I).
Enhancement of hepatic parenchyma
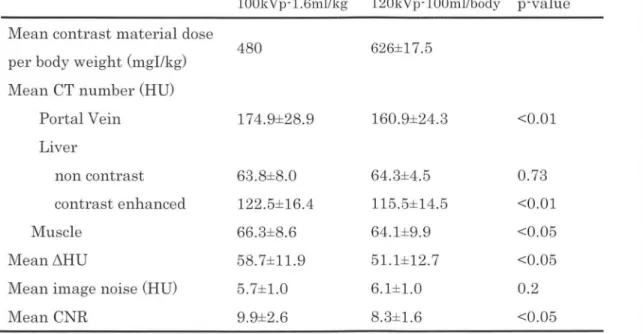
The mean t.HU of hepatic parenchyma was significantly higher at the I OOkVp-I .6ml/kg protocol than at the I 20kVp- I OOml/body protocol on both the higher and lower dose groups (Table3, 4). The overall number of patients who showed t.H U greater
Table 3 Contrast material dose and quantitative image analysis in patients with higher dose group.
100kVp-1.6ml/kg 120kVp-100ml/body p-value Mean contrast m aterial dose
per body we igh t (mgl/kg) Mean CT number (HU)
Portal Vein Liver
non contrast
contrast enhanced M u scle
Meanl'.'.1HU
Mean image noise (HU) Mean CNR
480
174.9±28.9
63.8±8.0 122.5±16.4 66.3±8.6 58.7±11.9 5.7± 1.0 9.9±2.6
626± 17.5
160.9± 24.3
64.3±4.5 115.5±14.5 64.1±9.9 51.1±12.7 6.1±1.0 8.3 ±1.6
Table 4 Contrast material dose and quantitative image analysis in patients with lower dose group.
100kVp-1.6ml/kg 120kVp-100ml/body Mean contrast material dose
480 531±35.6
per body weight (mgl/kg) Mean CT number (HU)
Portal Vein 193.0±30 .5 153.1±25.0
Liver
non co ntrast 65.0± 7.2 62 .3±7.9 contrast enhanced 121.2± 11.1 107 .7±12.2
M u scle 64 .8± 8.8 64.1±6.2
Meanl'.'.1HU 56.1±10.7 44.8± 10.7
Mean image noise (HU) 5.6±0.6 6.0± 1.9
Mean CNR 10.0± 2.2 7.5± 3.0
148
Jpn J Diagn Imaging-Vol.34 No.2 (2016)
<0.01
0.73
<0.01
<0.05
<0.05 0.2
<0.05
p-value
<0 .01
0.31
<0 .01 0.26
<0.01 0.24
<0.05
than 50 HU was significantly larger at the I OOkVp- 1.6ml/kg protocol than at the 120kVp-1 OOml/body protocol (Table5).
Qualitative Image Analysis
The mean score of image contrast was 2. I ±0.3 at the I OOkVp-1.6ml/kg protocol, and it was significantly higher than 1.7±0.6 at the I 20kVp- l OOml/body protocol(K=0.71). The mean score of image noise was 1.8±0.4 and 1.7±0.4 at the I OOkVp-l .6ml/kg protocol and 120kVp-1 OOml/body protocol, respectively (K=0.67). The mean score of overall image quality was 1.7±0.4 and 1.8±0.4 at the I OOkVp-1.6ml/kg protocol and I 20kVp-1 OOml/ body protocol, respectivel(K=0.80) . There was no significant difference in the image noise and overall
0 0
"'
0
';!
:;:;:
0 ~
u..
~
B
100kVp-480mg/kg 120kVp-100m I/body A
image quality between the two protocols (fig. 2). A case are shown in Figure 3.
Discussion
Reduction of the amount of iodinated contrast agent as well as the dose of radiation exposure for CT examinations is important, especially in patients with a chronic clinical course who require repeated examinations and/or who have renal dysfunction. A new technology of low-tube-voltage CT imaging is one of the solutions and most researchers apply tube-voltage of 80kVp using high performance machines, however, it requires higher tube current and is not always possible with commercially- supplied machines in most city hospitals. In this
0
"'
';!
:;:;:
0
~
u.. ~
"'
~
100kVp-480mg/kg 120kVp-100ml/body B
Figure 1 Box plot of FOM. A and B plot shows FOM of patients with each prior higher and lower dose group, respectively. Mean FOM was significantly high at the 1 OOkVp-1.6ml/kg protocol compared to the value at the 120kVp-1 OOml/body protocol on the higher dose group(p<0.01), but not significantly different compared to the lower dose group (p=0.07).
Table 5 Number of patients with L'iHU greater than 50HU 100kVp-l.6ml/kg
overall 78.2% (18/23)
patients with higher dose group
patients with lower dose group
83.3% (10/12)
72. 7% (8/11)
120kVp-100ml/body p-value 43.4% (10/23) <0.01
58.3% (7/12) 0.17
27.2% (3/11) <0.05
Jpn J Diagn Imaging-Vol.34 No.2 (2016) 149
study, we investigated the possibility of low-tube- voltage CT technique which is available with machines in most hospitals using the tube-voltage of lOOkVp to reduce iodine load and radiation exposure dose. Increase of image noises from low
o<0.01
p=0.78
QJ '-0 u
V>
C1l :J V>
>
Image contrast Image noise
tube-voltage imaging was compensated by ASJR.
Firstly, about 11 % of reduction of radiation exposure was confirmed in contrast-enhanced CT with the I OOkV p-l.6ml/kg protocol compared to the 120kVp-100ml/body protocol. Since there was no
p=0.78
• 120kVp
D
100kVpOverall image quality
Figure 2 The results of t11e quantitative image analysis. Mean score of image contrast was significant higl1er at the 100kVp-1.6ml/kg than 120kVp-1 OOml/body protocol There was no significant difference in the image noise and overall image quality.
A B
Figure 3 Axial contrast-enhanced CT images in 60-year-old woman with 50kg of body weight at 120kVp-1 OOml/body protocol (A) and 1 OOkVp-1.6ml/kg protocol (B) by using preset abdominal window (window width, 300 HU; window level, 40 HU) Image contrast and image noise at 1 OOkVp-1.6ml/kg protocol compare well with those at 120kVp-1 OOml/body protocol
150 Jpn J Diagn Imaging - Vol. 34 No.2 (2016)
significant change in non contrast -enhanced CT, this reduction was considered to be provided by the increase of the signal from the contrast given by the use of low tube-voltage imaging technique.
Secondly, degree of contrast enhancement was significantly increased at the liver parenchyma, portal vein, muscle in the I OOkVp-l.6ml/kg protocol compared to the 120kVp-lOOml/body protocol.
The mean LiHU and mean CNR also demonstrated significant higher values. These differences were observed in the comparison to the higher dose group, as well as, to the lower dose group of the I 20kVp-
l OOml/body protocol. As a result, optimal hepatic enhancement (LiHU > 50HU) was significantly more often observed in the 1 OOkYp-l.6m I/kg protocol.
The number of optimal hepatic enhancement of our 78.2% in patients who received 480mgl/kg contrast media in l OOkVp setting was even higher than that of 61 % observed in patients in previous report who received 600mgl/kg contrast media in l20kVp setting1 I)_ These results mean that the use of lower tube-voltage imaging technique using I OOkVp provided higher degree of contrast enhancement and higher CNR with the administration of lower dose of contrast media compared to the conventional tube-voltage imaging with I 20kYp, which agrees with the results of previous stud/-51. Optimization of contrast media dose will be required in I OOkVp setting as the previous study in 80kVp settings12·13l.
An increase in background image noise, a common drawback with the low-tube-voltage CT technique14l has been successfully compensated by the ASIR image reconstruction technique as demonstrated by Marin et al1l-
Thirdly, these favorable objective results were also confirmed by the visual assessment by the radiologists. Namely, a significant increase of contrast enhancement was visually appreciated in the I OOkYp-1.6ml/kg protocol in spite of the less volume of contrast media used compared to the
l 20kVp-l 001111/body protocol. In addition, visual impression of image noises and overall image quality did not deteriorate.
There are some limitations in our study. Firstly, the body weight of our patients were relatively small. However the fact that a smaller body size have a greater frequency of compromised image quality with a low-tube-voltage abdominal CT may prevent the underestimate of our results. Secondly, in our study design, contrast injection speed was fixed at 2 mL/sec regardless of the amount of contrast media and the timing of initiation of imaging was fixed optimal to I 20kYp-l OOml/
body protocol. It is reported that at the same speed injection, both the time to and the magnitude of the peaks of enhancement increase with the contrast medium volume2l. Therefore, the peak enhancement in the 100kYp-1.6ml/kg protocol in this study might not have been maximum, and again this is not against the result of this study demonstrating the benefit of the 1 OOkVp-l .6ml/kg protocol.
In conclusion, low-tube-voltage CT imaging using lOOkVp which is available with commercially- supplied machines in city hospitals with ASIR is useful to reduce radiation dose as well as amount of contrast media while the image quality remains unchanged or even improved in routine clinical examination. Further investigation should be necessary to reveal whether this imaging protocol may preserve or improve the diagnostic accuracy for various pathologic processes.
Acknowledgement
I received generous support from Dr. Jun Watari and Dr. Fumio Uchiyama of JMA Ebina General Hospital. I would like to offer my special thanks to M. Hayashi, M. Ishihara, and T. Nogawa of radiological technologists at JMA Ebina Medical Plaza.
Jpn J Diagn Imaging-Vol.34 No.2 (2016)
151References
1) European society of urogenital radiology. ESUR guidlines on contrast media the ELECTRONIC VERSION of 8.1. http:/ /www.esur.org/guidelines/
2) Bae KT. Intravenous contrast medium administration and scan timing at CT: considerations and approaches. Radiology 201 O; 256: 32-61.
3) Nakaura T, Awai K, Maruyama N, et al. Abdominal dynamic CT in patients with renal dysfunction:
contrast agent dose reduction with low tube voltage and high tube current-time product settings at 256-detector row CT. Radiology 2011; 261: 467- 476.
4) Nakaura T, Nakamura S, Maruyama N, et al. Low contrast agent and radiation dose protocol for hepatic dynamic CT of thin adults at 256-detector row CT: effect of low tube voltage and hybrid iterative reconstruction algorithm on image quality.
Radiology 2012; 264: 445-454.
s) Noda Y, Kanematsu M, Goshima S, et al. Reducing iodine load in hepatic CT for patients with chronic liver disease with a combination of low-tube-voltage and adaptive statistical iterative reconstruction. Eur J Radiol. 2015; 84: 11-18.
6) Noda Y, Kanematsu M, Goshima S, et al. Reduction of iodine load in CT imaging of pancreas acquired with low tube voltage and an adaptive statistical iterative reconstruction technique. J Comput Assist Tomogr 2014; 38: 714-720.
7) Marin D, Nelson RC, Schindera ST, et al. Low-tube- voltage, high-tube-current multidetector abdominal CT: improved image quality and decreased
152
Jpn J Diagn Imaging-Vol.34 No.2 (2016)
radiation dose with adaptive statistical iterative
reconstruction algorithm--initial clinical experience.
Radiology 201 O; 254: 145-1 53.
s) Kaza RK, Platt JF, Goodsitt MM, et al. Emerging techniques for dose optimization in abdominal CT.
Radiographies 2014; 34: 4-17.
9) Deak PD, Smal Y, Kalender WA. Multisection CT protocols: sex- and age-specific conversion factors used to determine effective dose from dose-length product. Radiology 201 O; 257: 158-166.
10) Walkey MM. Dynamic hepatic CT: how many years will it take 'til we learn? Radiology 1991; 181: 17- 18.
11) Yamashita Y, Komohara Y, Takahashi M, et al.
Abdominal helical CT: evaluation of optimal doses
of intravenous contrast material--a prospective
randomized study. Radiology 2000; 216: 718-723.
12) Goshi ma S, Kanematsu M, Noda Y, et al.
Determination of optimal intravenous contrast agent iodine dose for the detection of liver metastasis at 80-kVp CT. Eur Radial 2014; 24: 1853-1859.
13) Buis N, Van Gompel G, Van Cauteren T, et al.
Contrast agent and radiation dose reduction in abdominal CT by a combination of low tube voltage and advanced image reconstruction algorithms. Eur Radial. 2015; 25: 1023-1031.
14) 14) Nakaura T, Kidoh M, Nakamura S, et al. Low- dose abdominal CT protocols with a tube voltage setting of 1 00 kVp or 80 kVp: Performance of radiation dose reduction and influence on visual contrast. Clin Radial 2014; 69: 804-811.