!
"#$%&'()* "*+,-./0123 4#567"#89
:;<= >?@ A
῏ ῍
ῌ
ῌ ῎῎
ῌ ῌ
ῌ
ῌ
Abstract
TADERA IKUGAWA DAWARA
Hot springs research in- stitute of Kanagawa Prefecture, Iryuda , Odawara, Kanagawa , Japan.
J. Hot Spring Sci.
Origin of deep hot spring waters in Kanagawa Prefecture is investigated based on compositions of major ions and oxygen-hydrogen isotope ratio. It is found that they are classified into three groups. Hot spring waters of group , which are seen in the coastal area, are considered to be originated from mixing of seawater and meteoric water. Their isotope ratios indicate that contribution of the latter is small. Hot spring waters of group , for their formation fossil seawater is probably involved, are divided into two subgroups based on the ratio of calcium ion in total cation. Hot spring waters of subgroup -A are characterized by the feature that calcium concentration is higher than that expected from the gypsum precipitation model. It is supposed that a cation exchange occurs be- tween the sodium ion in the rock and the calcium ion in the water. Those hot springs are seen in the central and southwestern parts of the Prefecture. On the other hand, hot spring waters of subgroup -B show lower calcium concentration than that expected, that is, a reverse cation exchange that causes dissolution of calcium-carbonate is considered to have taken place in the course of their formation. They are distributed in the northeast- ern part of the Prefecture. Hot spring waters of group which exist around Tanzawa Mountains are considered to consist of groundwater recharged by rainwater. It is sup- posed that major chemical ingredients are supplied not by the present or fossil seawater, but by the contents in the stratum where the hot waters yield. This assumption is sup- ported by the geology of the stratum and the groundwater flow inferred from the water levels, as well as by geographical distribution of the isotope ratios.
Key words : deep hot spring, fossil seawater, cation exchange reaction, groundwater flow
Kazuhiro I , Joji K and Kei O
Origin of Deep Hot Spring Waters in Kanagawa Prefecture, Japan
+ +
+ + +
+ + +
,+ +, ,. ,, , +2
,/* **-+ /20
/20 ,/* **-+
/3 -,* --3 ,*+*
+
,
,
,
-
!"#$%&
'( )* " +, $ -./012"$3 45!" 6 7 '58 9 :5;< , %= >? @AB C" @ABD.EF 5
!" G , H @ABD.%IJ < , %
@ABKL(M $ @ABNOKP"$345! Q R '5 S" TU V @ABD.% J $
@ABNO>WX YKP"$345! "
Z J85! , < , 9 [; \ % K] S"#$W?^ !$345!" 7'5_ ` >
WX!'5 !" ` !$a 7 b #!5 cKd eS"
fgh < , @ABNO i `
J j+k l &m" n% l op
! q&C '5 %rs t5!" lu op
!TJ2" k^ v wx% [yy #U z % {"
| $U} '5~ !" J2" ' % |
=S"@h @B > mU Xn 7 B X
=S" [ Y K S"$$T !5K S"#
$%C J2" $ !"WU G J z [K
S" [w$[("
J #!yJ nop'5 yJ q
=&" K !5KE [ K Cq 4 J UK . [ ' 5 Y S"#$W? 3cS"
j J >" n $op b K¡ n lu R '5 ¢K z % C5!
q#$%&'" op ¡$>?J £>WX
£¤¥%85! ¦T T yJop !"
§ 5 % ¨ n$ !lu
n n =S"| © ª «¬
} n T®3 nop ` H Z Z >WX ,*J ¯ ° ¯ ± ¯ I Z ¯ Z ¯[²E ³ ´ '5 y µ¶ J E ³ Z ¯
>WX 7µ¶ ¯'5 · ¸ ¢Jµ¶ ¯¦ >WX
¯¦` '5 !¹! %º !"$ H" » 5
§ luop ! n© Y T ¼ ½ n
>" º K{ § W" ½ >"
! "
# $
%& '( )*
+ , - .
/0 1 2 345 / 6 17
8 9 : ; :
: 9 <=
> ? @ AB C D
EF G H ? I J E
-K L M
NONP QR S3 T /U J
VW X Y C Y
+ V
Z 8 [\ ]^_
L QR `a4
U b c ;d e P G
S3 T 8
9 f G 8 9 5
9 $ g C U
h i
i
& j & k ;
QR ; ; l l m n o
Z 0 ; G p
%& qr <= ! %& st u v w x $! yz w v
: ${ | : :
e }
& j l T ~
& j 8
ῌ
ῌ ῌ
ῌ ῌ
ῌ ῌ
ῌ
ῌ
ῌ
ῌ
Ca Ca
SO Na Ca
Ca Ca
Na CaCO
:
m
Fig.
Fig. m m
m
.
-
/3 ,*+*
- +
, ,
+ -
,**3 3 +*** 1*
+33*
,**.
+ ,**1 - /
,***
, +*** +/**
+2**
,**/ +333 -
,+ +3
,
,**1 ,**/
- ,**/
+
,
!"#$ % & '()*+ ,-./01 23$456789:8;<= >-.?@456ABC DEF GHFIJ& *+KLB&56 KLBMNOPQ@R=S TUVWXY Z$
,[\B& (]^\)/_`R=5Y@ Qab<=S
cd&e/fgYhij'klmT#=no3 pq/rstu&01m
!"#$%&
'(
)*+,-./
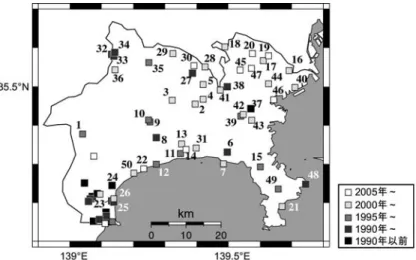
ῌ Fig. Distribution of deep hot spring wells in Kanagawa Prefecture. Colors show
di erence of periods when the wells were dug. The number corresponds to the location number in Table .
Fig. Histogram of depths of deep hot spring wells in Kanagawa Prefecture
m +
#
,
,
,**2
+,**
+
,
,
-
ῌ
!
"#$% "#&' (&' )*+,
-."# /0!
1234567 89:;45<
=>$% /0?@A
-B@CA "#DE <F324&' GH EIJA
KL!MNO PQ& KLRS=Q&
TUUVNO )*+,
=>W'
XYZ$% TUUVNO Z[\]<^_NO
X `abc XSdefgh
! Q iUV j&klUV /0! mn opqrst>
uvwxDEQy(
z
z
{ |
Z =>}'W'YZ XYZ ~U YZ$%e
q aTe
mnDE/0q /0! E GHIJAI¡NO d ¢£¤q ¥ TUUVNO KL!MNO ¦ ! Q
!"#$%&
ῌ
ῌ
ῌ
Fig. Geology of the strata which yield hot spring waters (after Kikugawa )
Table Flow of procedure concerning the development of hot spring well and related materials which are usable for the research on hot spring waters
et al., Table
b e
g f k
- ,**1
+
,**1 /3 ,*+*
-
+ ,
-
+
! " #$%& '(
)*+ , )*+ -.( / 01 23 45 6 78 9% -.:;<(
/ => ? @ A 45 9:
:BC D / #$%/ EF #$%/
EF GH C 9 I JKL; M #$%/
L; NO #$%/ L; -P(Q 45RS: T D U V/WX(Y Z X / [ ;<( \C 9%/]^I;_ 9
:` $: ? 4( /
#$%a #$%a ;<( C / Q.b M L cd( e $%fg'(; hi jBb .( / Y Y X(
k c4l m' n m' o/
m9:c5;<( /! p;<(Y b 45 /WX( WX c4l? m'QY q-.%$(Qrb&
st: / p #$% NuWX( vw.%$(Y xLy ;/ Z %z{| $(
3 } ! v~! L " #$%/ pb 3b 3b
b b 3 X 4S% @c4l 3 Y
b.%$( c$% $% /b.X
$; ; -.%$( ! /<($/
'(QY -.(
/k Z0$% 3em9:
; / 4( ;<( c$% 1 Y
S%-.%$(Q/ w:/ ¡¢Y £9%$(
Qm9%$(
3em9: '( 3e
4¤ ¥ ;/X1 ¦1 #§¨{ db.(QY%©.( #§¨{
/ m' }5 -.(§¨{ ª«
vw¬ ®c4l¯1 -.(§¨{ ¯9% Y 1 m' -.(§¨{;<( xL ;/ Q.b¯.°.§¨{
§¨{ §¨{ ±Q'(
²9: / 3erb ! Y #§¨{ -.(Qm' ¯.°.§¨{ "
9% §¨{ / ¡¢ §¨{ / Y 91 $$¤ rb 3 w: §¨{ / Y $Qrb¯³´/ Y3 9X$ 2µ 4(¶ 9%$(
/k $:··¸¹º¹§»¼; ®½§¨{
!"
!" # $ % &
' ( # )* " +
$ %
,- !" % . / #
0 !"1
# 2
!" + 3 4 -
2 1 5
678 9: ;
<
= > ?
@4 !"
A ,- B
C D E9
F G H
A I JK L M 9 N
O P CK Q P R G
ST U"
678 V V
P W XY > Z : W :
[\ G 8
] V V ^_ V V
-
> W : [\
V V `
V ,A
a b I c
. d
b V e ` =f
G H V ` G H
3 "
678 g
ῌ ῎ῐῒ῍ΐ
ῌ ῑ ῏ ῌ
ῌ
ῌ
ῌ ῌ
ῌ ῌ
ῌ
ῌ PRISM micromass
. D .
. . V-SMOW
.
Table
Fig. No. m
Table
Fig. Table Cl Na
Fig.
Cl SO Fig. Cl Na
SO
Cl Cl SO
Cl
Fig.
+2
, .
, .
, .
,/ . .* 3*
+33+
* 2 /, /. +
* + +
* + -
,
+ /* 2** ,**.
,
,**+ ,**+
,**. ,**1 ,**2 ,**3
. ,
+32. .
/
- -
+
, -
,**.
-
+ ,
-
0 . +
.
d d
d d
Table,Isotopicratiosofoxygenandhydrogenandchemicalcompositionofhotspringwatersofthewellsthataredeeperthan+***minKanagawaPrefecture. ,ῌ
/3 ,*+*
Table,(Continue) ῐ,ῌ῏῎῍
! "#$%&'()*+
, -./012 345 6 ,789:; <)*+=>68
?@9A;127 B)*+=>CD0 EF7GHIJ0D2 345 6 K L 345MN0&'()*+,7GH B)
*+;6 EF <)*+;6 EF 7OD
345 LD06 PQC% <)*+
CD0 ,7RS0GDDTUV71 2 WX B)*+=>CD06 EF7 8$%ODGD;)*+=>7Y IJ0D2 EF789:Z[\$
%OD ;6
<)*+6 ]^; EF6GD _\
`/0 EF78$%GD345 a;6 B)*+LD06 8 MN0 EF7bc EF7Pd/0 D0 <)*+6 ]^=>IJ0 D2 __Ze fg;6345 h ij345kl/ mnh onh p2
qr r9s^Mtuvw $
\x y qr9s^M6 Ze zh r9s^M6 Ze zh[\{\.p 6qr r9s^M|}h.p ~)3;
!6P345h ! "#6&'()*+, -h/0D2
68 C$
$2'8=> !/0
12 IC $\
x z6qr
7 : r7 Ze :
; ;12
CD0 345 345 ¡¢£9s^=>h.p¤6 ¥zh.p
¦§e\2;J ¨© 12D6'8=>h.p¤hª«p2 !#\0D2 ¬®&'()*+,7OD?¯ qr r9s^M "H 8 6'8 °D9s^=>IJ0D2 ±P_6 345 C$ l
²#\2¢£7 8 6'8 ¥³´µF¶12DT·¸h¹º/0D2
!"#
$
% &'()* +* ,
* -./.012& * * !"#
%3 3456789 ῌ
ῌ
ῌ
ῌ ῌ
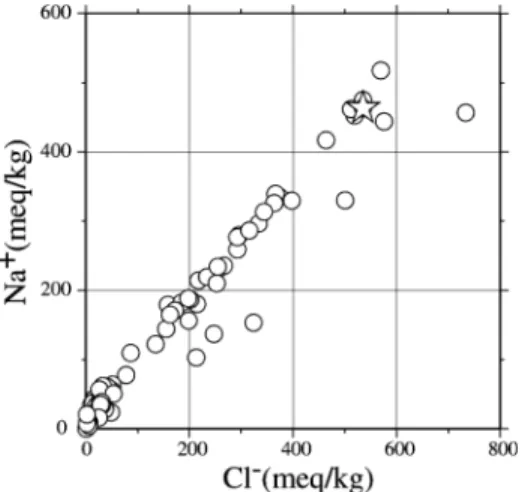
of chloride ion and sodium ion in hot spring wa- ters. Star indicates composition of seawater.
chloride ion and sulfate ion in hot spring wa- ters. Black, grey and white circles represent Fig. Relationship between concentrations
Fig. Relationship between concentrations of
wells of group , and , respectively.
Cl
Mg
Ca SO
Fig.
SO
Ca
Ca No.
Cl HCO
Ca
Mg Na
Cl HCO
-A, -B
Table
. . .
. Fig.
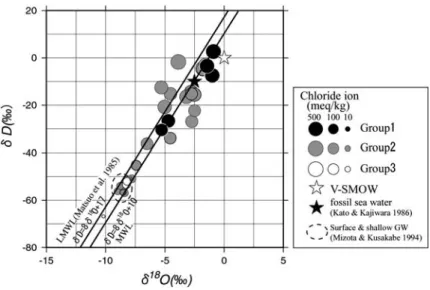
Fig. V-SMOW
Mizota and Kusakabe
. .
Fig.
V-SMOW .
/
+ , -
,
, ,
.
, .
,
,
- ,
,
-
/3 ,*+*
+
- ,
0 ,
- ++ +, +- +. ,,
,
,
, ,
,
+* - + * 00 3
, 0 1
1 +320
+33.
1 1 3 0 .+ 0+
1 + ,
+ ,
.
/
+ , -
. ,
d
!"# $% &'!()*+ ,
- ./ /012 !"# $%
&'!()*+ ,ῌ
Fig. Tri-linear diagram showing major ion compositions of deep hot spring waters. Color of circles show di erence of the groups, and their size represents concentration of chloride ion.
Fig. Oxygen-Hydrogen isotope compositions in hot spring waters. Color of circles show di erence of the groups, and their size represents concentration of chloride ion.
0
#
1
# 0
1
!
" # $%& '( ) *+ , - .
/012 3 ! 4567 8 9 6&
:;1<=/'; <<># ?+@012#A 61<==B
CDE =CDE F GB= CDE # , H IJ KLM N1 6 CDE # 8 IJ KLM = , H '; HO> P1 Q FR621 S CDE # CDE = G62
8 = TU2 8 # V W6'21
1 # W VX1 8
FRB ! N NVO7# > 7Y ! CDE ZO KLM# [ \ 67] &^(_=9`;
a bFc d=Befg a '; O>N # a & . h 6 <a , N a 8 F)`7 # a & .
, ij FRB ak =bl . mn#
op qB<= >r # s F t7 . u 621=9`;v V12 wx b7yz . # ak =
{ <=FR621
|} e># ~ 8 . E B2'; F
c621 <7 8# & F 621
&>#1 ># W 8 a & F 621=
67 # eamn7 8 F, N
62 ;7 F ea & =b62 ? F
67 F T!7U2# = ? pC
F 6 '; Q! E¡ ¢ F? =62 67 C E¡F 17 67 U2 |}# E¡ ;7 e B Q 012b ? E¡op mnF qB<= >r £¤ 8 B
e 8 , =#¥U217 / <='; ,¤ F
¦ §¨=#6211
ea N# >! :;0r ! VF ©=67yz ªED= =«¬>! 67 U2 # S 4&
mnFR621=21=® < , W&
. F¯°B<= >r
Fb= # '; ± ># ² '; ³ ,¤
´'U2 TU2 µ¶ ·¯n ¸67 ; ± >
# '; + '&2 Q ; ? ¹# º»
>#T + .8 621 < ¼U2 . 621=B: ² ';# ,¤ ³ ± ´ u6 ±
# ² ³ '; . ½OU2T<= ; ± ;
! " # ! "
$ % &
" ' ( )
* ) (
+ ,- ./ 01
'" 2 3* 4
5 5 6 5
78 9: 5 ;+ 5 <8 % 5
=8 ; > ? @3* AB =
8 C D E F G AB H
I J AB > ?*
=8 C K
< - L<
M NO @3* NO =8% P
QR J 5 =8 P
SO J TU M % V ;+
W % 5 =8% X6C Y
Z% [ & &
LO \ ] $ X % \ %
^ W C $
C D - <
M ; 8%
O
5+ _` a #
X& X6 =8
C O ; )
3 8C
=8 b- * - cd e ' f
' # 8 X6C g * -
9h' 9h i $ 8C j g * 9 h' 9h i < 8C A B cd bf- - * - A H *
- cd e- * - g
ῌ MWL LMWL Matsuo
Lawrence and Gieskes,
Mizota and Kusakabe
m
Fig. .
m No. m
m
Fig.
m
Fig.
et al., /3 ,*+*
+32/
+320 +32+
+ , +
,
- + ,
+33.
-
*
+320
,
2 * /
+*
* 1 ,- ,/ ,0 *
2 +***
2 / +
/
!"#$% &'()$*+,-!' ./0 12 3/4 56789:;<# = >?@A% >B C@ DE-FG%H)I JK@
$()L78M-!' NO/0 >BPQRS1=T/0U"A+V ?WXY/
0 125Z[\]I^#_*9:M-)#
% :M`a9b)-c)defghijkDlTmnoA^
# % pf* pfqr!&stuvw xy# z{ |})-m~
MmnI:M ijkD %faJKaL06 -!' <#12ijkDL1JK@(V+
!"#$ %&'(
Fig. Geographic map of hydraulic heads of deep hot spring waters.
Interval of contour lines is m.
Fig. Geographic map showing spatial distribution of oxygen isotope ratios in deep hot spring waters. Colors of circles indicate di erence of the groups.
m
Fig. Table
Fig. Cl SO Ca
Dansgaard,
m.
2
/*
3
#
, ,
.
*
3 ,
3
+30.
2 /*
3
! "# $%& '( )*+, -. /0 12)2345 ! 67 89-:;< . -3=>?@ABCD:;<
1EF7G*>H I@2J"53 K>L.G*M-*/!0 "# NO P Q 122RS ,73H *>L - /*TF UVC *+W- 89- T>XKY Z!1 [W)23D\
] *T! . ^_`VD:;< 3a bcd c*eGH :;< 3f@H ! )?,7ge. h G5iSVC j*+k, TL )Vl*
Wmnop . `VDqr,7s*VU't 3 FuvDwt72W J" 1xy, !
z {| G5'} c*GF . /f:;< l3~3H ! h *># ^_`VG5) l*eG?VC 3iS mnop 2mnop * 7.) l* , !3 :;< G5.- 89- Y 3 f KVCY .GD)23
b c*.a:;< l3 5 VCh . ) l* G5V C36ge1, TL a:;< l. 89-*VC3Z, !
1 , ! ,73H ) l* Wmnop t*. 89-
22* VCZ3 , !2J"5
12* ` *>L7Ur
. b D ¡ D ¡0DH7
U¢1 2, )1r *£¤W2 b D.
¡ D ¡02@ .¥@! =¦5z §
@VCU2 ¨, ©oªo«!0DL Ur¬3\ a
!)23G
{| G5'} c*GF VlD. ® @¯°U ±3²+§*
³ ´ *²µWVUG51¯°, ! ¶7 h· .H r
¬3a!7 ¸¹VC j*>º»¼½.«!2J"5 ))2.
!
" #
$
ῌ
ῌ
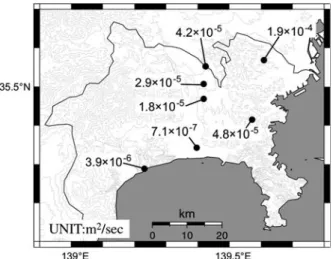
Fig. Distribution of transmissivity of the stratum that yields hot spring waters.
Fig. m
Fig.
-A
-B
m sec m sec
Fig. m cm
sec cm sec
Fig.
+*
. / , 0 1 ,
/ 0
1 2
/3 ,*+*
+32- *
+320 3 +***
3
-
*
+ ,
,
+32-
+* +* +* +*
+* /** +* +*
+* +*
-
+*
ῌ ῌ
ῌ ῌ
!" #$% & '( ) *%+ ,
& -% . ! /0+12 #$% 3 4 &5'/678 9 : 89 8;<=>8+'(/% 0$ 8 8;?@ AB4
'(CD E F G H+ I'( JKLKM/0+ NOP+ Q R! I S0DT-/UV&W%+XY$%
ZP+ I'[+\ NOP \= ]+'( ^_( / ;`a%0 +!4\% b -4&cd[+CD :efgKh & !
^_( /+/i !W%0+ E jk&NOP!l '(/%m F!M/+XY
$%
8 & no_$[P! ;pi<=q +'( M rs&Ct% 8 + uJvwx&y% z{|} ~+ j+ &y
% z{! $(/% B[ F rs&C/(
&y% [_ !p$%0+1 #$(/% 1^_
( 4' 5[=P !=t$ NOP & -%
004 P! 8 & no_$[ &yD#$%K;XY% 0 +\
P Cy} j ; E$$ +-% & &1¡j !
¢&£B$%! 004 P;-% j ; A¤ &¥¦+-%
ZP ;G§+-%+ &y% ¨©&yDª«4\%
&y%P ª«#$%j + & £B$%j
+ ¬
4 #$%
R j ZP ®4¯ !4\%
R °± h¦²!l -%0+&y³( E j ´j! N'[0+;µ'(CD NOPN10 K&£B$%
fgKh Cy} &]/( + l¶;µ - fgKh & !·+¸£B$(/=/ c yi& E k+'(
&y% m F1X '=t$==/! &P!#$[R + I-%+ ·+¸-d( &]/( ~ Cy} z{'(/%
0+ 4 :e uJvwx Cy} &y³(P!NOPN' [1 +'(¹ ;_%
& fgKh & '[&]/( ©&yDºª'[ + l¶
;µ- :e q &yD z{ + !NOP&#$%0+&=%
& !·+¸£B$(/=³[0+ P &£B$(/[ ! q &y³(»(p$[+-$ E z{ ;µ- n@ &y% z { & -%¢4W%
'%& &C/( ¼½
l¶! _$% 0 0+ + uJvwx&yDp$[ z{ ! &
! "
#
$ % #
&
' (
) *+
, -
. /
0 # 1
' 2
# 2
2 #
# 2 3
2 3 # #
# 4
5
- & 6 7
)
89 *+
:
;
( < <
( < *+
< =
> < *+
ῌ
῍
῎
῏
ῌ ῍
῎ ῏ ῌ
῍
ῌ
ῌ
ῌ
ῌ
῍ ῍ ῍ ῍
A A
Cl Cl
A A
A A
SO
SO
SO
Ca Mg Ca CaSO
SO
SO
SO
A X , x
Cl f
f x X
A A
A A-difference A x f X
A A A
Fig. Ca Mg SO f X x
SO
Ca Mg SO
CaSO
Fig. Mg SO
Mg Ca
SO SO
SO Ca
Fig.
Mg SO
Ca Mg
, .
, .
, .
, , ,
. ,
.
, .
, .
, , ,
. ,
.
, , ,
. .
.
, ,
, ,
. .
, .
.
, ,
+ ,
+322 ,
+31/
+312
* *
++ ,
,
+, ,
+, / ,
D D
D D
D D
D
D D
ῌ
!"#$$%&
&'()*!+$,-.)! +
$/ 0123 4" 567&89 : ;<= >? 2@AB&
4%CD? EFGHIJ K $
? "LG
$+MN &-.$O F&H IJ P& @A$QRST ,U
V. 4 $ WX3 4
"YZ.?! +[YZ\],^ _
& 567 $ 3 WX 4$2@A`,UV. 4
$7 F&a)HIJ bc&d!
)eN G &f NghiG" $j&kl?m8bNn_
!"# $%
&'()*# !"# +,-
$%
῏
῏ ῌ ῍
῎
ῌ ῍ ῍ ῍ ῍
culated and analyzed concentrations of mag- Relationship between di erences of cal-
Fig. Relationship between calculated concentrations of calcium ion, magnesium ion, and sulfate ion and analyzed values of those ions.
Fig.
nesium ion and those for sulfate ion.
Ca
Ca Ca
Ca Ca
Ca Ca
SO Ca
Ca Ca
Y
Y f X Mg SO
Fig.
Ca Y Ca
x
Ca x Y Na
Na Na
Fig. Fig. Ca
Na d
d
# ++
+,
, . ,
, ,
.
, ,
/3 ,*+*
+-
+. +.
++
+,
D D
D
D
!"#$%&'() $
*+, -$./ 0 1 23 &'(
) $4*% $56 7 $89 :;<=>23:? @A.$ :B CD4.$ $EFGHI J$KL!MN2
756O P7QR RS
% T UGV'W 4$
XYZ [\]B^_$`a? D47&b(
GcdA $eGebfgEU:$EFGHIh 1\, i1 j#:! k23 l m % -0 1 n#op q$Dr@s1 # % tuPv7 wZ*+xyqA.$ z{ :D4$|}h 1\>2~_:QR23
&'() $$ s*% \
1 41#@4$ 73: [
\]4A:=>23@A$4P73 :? @4$ %+l,=3:
7>2 $@s1[32% $
1\, !>BCD471+
, @A.$ :$EFGHI1\>2 j!
MN231+:QR
1[32 7 $ s*%
%$!:>23 !"#
$%&'() $*+, - 1<
23 BCD4.$ !56 !8 9:2% @A.$ :BCD4 .$ :$*$ :%$EFGHI J$KL7QR % @4:
J#vC7D_A*+: eGebfg EU*%=< eGebfgEU7¡<¢£
2[, eGebfgEU:@4.$
.:$EFGHI1\, eGebfgEU7
¤_ 7@4.?,¥:
23 l C¦ % §¨-©ª 1 «# $j$¬ B13 2`a eGebfgEU: eGebf gEU:$EFGHI1[32 $ ¢_ 789#:1\, |®1.$
789 756#:!¯°23
± 1[32 7 $ s*% 7$²³´µ :$1 =|¶
% ·¸ ¡<$¹7 $ s1)fºU23 l, $5 1
»2 $8979=3:1= %¼?$¤* BCD4.1 7½623
!
!"#
$%&
'()*! !+,-
"#
ῌ ῍ ῌ
ῌ
῍ ῍ ῍ ῍ Relationship between di erences of cal- Fig. Relationship between calcium ion con- centration calculated by considering dilution of seawater and precipitation of CaSO and analyzed value.
Fig.
culated and analyzed concentrations of cal- cium ion and those for sodium ion.
-A
-A Ca Na
Ca Na
Ca Mizukami
Na Ca-Cl
CaCl
-A
SO Na
Fig. Ca
Na
-B
Na Ca
Na Ca
Ca Na
Na Ca
Ca Ca
Ca Na-Cl
Na Ca
Ca Na
Fig. Ca Ca Na
Na Ca Na
Ca Ca
et al.
d
d d
d CaSO
.
# +-
+.
,
,
,
,
, .
,
,
,
,
,
, ,
,
,
+31.
+321
,
+.
,
,**+
o o
o
o
+320
o o
+.
+- .
+.
D
D D
!"# $%&' ()*+,-./0 12345 6789 :;< $%&' =)>98 ?)@A BC DEFG;H IJK)0L9MB1N;1OP7
) $%&' Q RSTUDVA DWXA YZ3W1[\ ]^_`1a9bQcd<0 R1 )e9 fg hd<0 YZ3W1a9;Hij A6Ok
]^_`1l9;Hij R1[\6mn1N
op 0 qrs 1tuG
;IJ1vw]^xyA;)z78 [R {]^1|5};D VG89 :~0
]Q Q -./r
)z Q
#G)z<
2)hd])G 16$%&
' 0 ~ )z# D
7 1 }) ]-./r
~ D85}8 9s1 )J)"980 ]^
B`1 9 s1 M@)[9;w P }]^
¡¢£¤0 ; D¥¦G89
!"#$%&'
( !)*'
῎
῏
ῌ ῍
῎ ῏
ῌ ῌ ῌ ῌ
Relationship between di erence in ana- calculated value, and those for calcium ion, lyzed concentration of bicarbonate ion and Fig.
in hot spring waters of group -B.
Fig. Geographic map showing spatial distribution of the di erences between calculated and analyzed concentrations of bicarbonate ion.
Cl HCO
-B Na Ca HCO
Fig.
Fig. HCO Fig. Fig.
HCO
HCO
Na CaCO
NaHCO
Na Ca
CaCO Ca
HCO
Ca
-B SO
CaCO
d
d
-B
# +/
,
+0 #
-
-
-
-
-
-
-
,
, -
-
, .
-
/3 ,*+*
, ,
+/
+0 , +0 3
*
+33*
,
+/ ,
+0
D D
! "#$%&'()*+,-./012'30456 789 : ";!<=>?'() @:'*+,./!AB C?DE -FGHI
JK !LM@NO?0PIO Q(RHK ! Q56Q>'ST0PI4?UNV WX Y 8'Z4O[$7 \5 : ]ZO9: $%&??
6' "#$!^_UO4` ab -Fc>?'HO]ZdR ef'g hij -C?DEFD]IHI>?9: k+ -./@l4m n9:op0 WX] -FGHImn'ST0PIOqrs!tu:NO
'vw4xy-6?' z${(b z$?
*+, '|UO 12}~ -04]ZO 12}~'Z4 P ' {O*+,"#$ 9: "#$- ?04
'(NV ghij {(b ]Z) '|0P12]Z O >N'|0P ghij `P@= '|0P0=12]ZO
>?!9O z$? '{IP z$!ICE !%=H P IO ?{) z$^_'7& !I?tu:NO>?9: ghi j !*+,'|0P12H 7& -PIO?UO>?]
ZO$!qr]ZO 090H!: ghij +,'|UO12}~0=
%= ¡¢£¤¥'(O¦#6§¨]HIqrs!ZO Q'©IPª«
UO4`' ¬®¯° ± ²Y87³´µ¶'ef'FGNO·¸'©IP¹
º »uV !¼½]ZO
!"#$
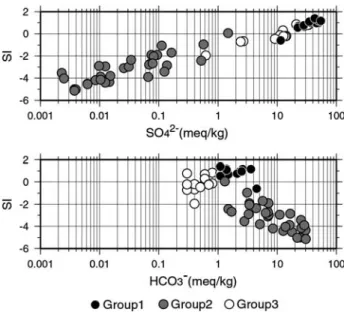
Fig. Relationship between saturation index for gypsum and concentrations of sulfate ion, or bicarbonate ion.
Ca SO Na-
Ca-Cl
CaSO SO
SO CaSO
CaSO
Fig. Table SO HCO CaSO
SI
. mol kg . E-
Fig. SI CaSO
SI CaSO
HCO SI HCO SI
HCO
S Yamanaka and Kumagai,
+1
, ,
.
,
. .
,
. .
.
,
. - .
. .
- -
-
-.
+31/
/* ,**1
,
+1 ,
,/
* *+/ , ,/ .
+1 + - *
,
,
,
,**0
+1 / -
d ῌ
!" #$%
&'()* + ,-./0 1234 )
5,- 6 5 789 1:;<= !>08
? 5@:;<= 6 9$AB 7.C32!0DE!
FG )32!:;<= 6HI JKLMNO!0DE!
8 2>0 P 6QB20R + / S 8 2>0.
T)32!
:;<= 6 U3 )32! 8VW3 2>0 5 76X I 8 )32!0DE Y Z[\ W! ]K
^_ 58I $`a2:;<= 0 2:;<= 0b ! :;<= 0 :;<= 06 5@8 c! d e #$%5 f2g *
+ g ! S K2f2 higj kl 8mB?32!/0DE! n) :;<= j S )32!X I 8 .o?p71236 4 ) q *Z[\rstuv wx$! y123/D c! 8O!/)B2
:;<= 6 z )3#` .o?X I 8 0Z[\{|$?3 }.~U3j 0DE! c!
P S 8 2>0 #$% e 0B?32! 8 2>0 ) hiO!0 !
:;<= 6 .o?X I 8 0Z[\{|0 y.C3j 32! 8DE! e 8 a2>0g
! P hi P /B`O!0DE!
:;<= 6 )32! #$% + >
d P 6 #$% IG?3 )32!0R 5
. ) 2!/0DE!
6 . 5 .D)3 1:;<= .
) :;<= 6 /mB? d )32! 6 e B . )3 5 B8`0 P u X.
!00/ + g } ^_I X I }g 0
1234 . W! 8O! B# )< 6 ! ?3/O` 5 6 " c!Z Z\ #U! c! ¡ B< y . . )//
O! ¢.£A>0$?3 H¤ 0B?32! g
¥ W;<;` 5¦ §¨. ©c!>08!0ª !
6 « ¬05^_ $`W" ./00W /O! Y®¯ y2n " . °2n2 ±²³+
#$% ´ £ µ¶+·$`¸¹º)»¼c ½
! "# $% & '(
)* + ,
- ' ./ 0
!
1 23 & ' 45 ' - 67 89 :
; <.
= ) - !
= > ?
! ' ! @4
23
- ! A
B C?D
1 E3 ! "F ! '
GH ! I 1 !
! GH ! +J ! )J "F
!= A
67 $% K L
M !ND !
N D $ M D ! 3O P : ! - > ! C Q <. 67 R S
T U 67 V
R RW XN EQ P
! W K Y VZ [
D \ ]
67 V ? . ^
V N \
_ `a 67 b
ῑ ῐ
ῌ ῎ ῍ ῏ ῌ
ῌ
ῌ ῌ SO
Ca
-A -B -A
-B
SO CaSO
-A SO
Ca
-B SO CaCO
, .
,
,
. .
, . ,
,
. -
/3 ,*+*
-
+
,
, , ,
,
,
,
,
-
- 0
!"#$ % &'( ')*
+ ,-./')*+0 112345'0+6
78 9: ; <= > <
?
@A 2 BCD C E FCG
= ?
H I J KL MN O PQ RCC STUD E = VW XYZ
[\]^ _` _aPbcdbe
f g hA O 6iB< < =FhC j kl m6i n F o=pq&'
rYZ
Ssi 2 C D E F<=
t Y Yuv wx
y z{| }
?
~ 6 6i C=pq C YZ
[\<
A2 C C YZ
f m ¡ g¢ £ ¤ Ssi 2
¥ ¦§ ¨ ©ª« m ¬ ® Ssi2 o=pq CYZ
¯ °±U ° 2 ²³´ z{µ ¶·i¸ ¹º
\» ?
¼ H£ C ½ E ^ C YZ
! ! " "# $% &
' ( ) " " # $& (
*+ +
, - ./0 1 2 & 3 4
5 6 " "# $% 7 89 5 :
; 6 < =
>? @ A B6
C D E
F G H I J E K @ 89 L
MN ON ' PQR S < T , -
E 5 BU V W X 5 6
? Y Z 5 [ ES ! \ !]
$ 89
^ < 5 6 _ ` a@
@
5 b L _ `# $ cd` 89 L ῌ῏῎῍
ῌ ῌ
ῌ
ῌ ῌ
ῌ
ῌ ῌ
ῌ ῌ
ῌ
ῌ
ῌ ῌ
ῌ
ῌ ῌ
ῌ
ῌ
ῌ ῌ
oceanic crust from the isotopic composition of pore water. J. Geophys. Res., (B ), Dansgaard, W. ( ) : Stable Isotopes in precipitation. Tellus, , .
: .
:
. :
.
: p.
:
Basic rock sea water interaction CaCl .
:
: .
: Na-HCO
.
: p.,
Lawrence, J.R. and Gieskes, J.M. ( ) : Constrains on water transport and alternation in the
Matsuo, S., Kusakabe, M., Niwano, M., Hirano, T., Oki, Y. ( ) : Origin of thermal waters from the Hakone geothermal system, Japan. Geochem. J., , .
:
:
.
Mizota, C. and Kusakabe, M. ( ) : Spatial distribution of D- O values of surface and shal- low groundwaters from Japan, south Korea and east China. Geochem. J., , . Mizukami M., Sakai S., Matsubaya O. ( ) : Na-Ca-Cl-SO -type submarine formation waters
at the Seikan Undersea Tunnel, Japan. Chemical and isotopic documentation and its in- terpretation. Geochim. Cosmochim. Acta, , .
: . :
.
: .
,
-
+2
.
3 13,.
+30. .-0 .02
+320 / ++/ +,0
,**.
.- .1 +320
, ++- +,,
,**3 /1
+321 -
- . 1* 2*
,**. /1
,**1 13 2.
+33*
+ / +0
+32. ,2.
+32+
1313
+32/
,1 ..
,**+
- + +*
,**1
33 ++.
+33.
-21 .+*
+311
+,*+ +,+, ,**2
+./ +0.
,**2
21 3*
+33+ + -1 .,
20 +0
+1
-0
/+
,+
-3
-,
+3
-+
/1
,2
.,
/*
.*
,+
d d
ῌ
! "#$ %&'()*+,- ./.0 .123456
+ 7-.8 '.09):./.0;<
.123456
=' > ?+,@A(BC* D.EF1GH I1
=' > JKL MN I1
O PQ R ST U'VW O7XY(9Z*[./\] MN^I1_`
O ab +cde fg h i' j k+l mnop O7.q(9Z*
rs 0t.0rs I1
O ab O7.q(9Z* .0t0 I1
uvwx yz{|()*./+}~F1F F1Xt
./1_`
c ^1(* | MN^I1_`
Jp O7XY./.0;< I1234
+' +-MN 7¡MN(9Z*¢£¤¥¦ .EF1
N§¨ ./©ª« ¬®¯
°±²³ !Y´µ 1 ¶ .®·
¸ m M MNI1_ ¹_º»-¼½ ῌ
῍
῍
῍
῍
῍ ῍
῍
῍ ῌ
῍
῍
῍
῍
῍
ῌ
ῌ
ῌ
: . :
.
: .
: .
: .
: .
: .
:
. :
.
: .
: .
Yamanaka, M., Kumagai, Y. ( ) : Sulfur isotope constraint on the provenance of salinity in a confined aquifer system of the southeastern Nobi Plain, central Japan. J. Hydrol., ,
.
: p,
: p,
/3 ,*+*
+333 .+ /, ,**/
+/ -2
+31/ - +./ +/-
+312 + .+ /,
,**+
- ++ ,.
,**.
+ ,.
,**3 ,2, ,3-
,**+
- +.3 +0*
+320 ,
2- 3*
,**, + +3
+32- ,
2- 3,
,**0
-/ //
+32- .3*
+322 2 ,3-
,**3 3 3 0,
-*
-1
./
.2
-+
/.
/2
.-
+0
0-
+1
-,/