Induction of Interfacial Gradients to Generate Drop Motion and Internal Flows
喜多, 由拓
http://hdl.handle.net/2324/2198520
出版情報:九州大学, 2018, 博士(工学), 課程博士 バージョン:
権利関係:
Induction of Interfacial Gradients to Generate Drop Motion and Internal Flows
Yutaku Kita
Thesis submitted for the degree of Doctor of Engineering
at
Kyushu University
i | P a g e
Acknowledgement
I would like to express my gratitude to all who have supported me and my study from across the globe. Firstly, I am deeply grateful to my supervisor, Prof Yasuyuki Takata, for his guidance, patience and for providing me with more opportunities than I could have ever whished for. It has been a pleasant time when he takes me for walking around campus, which indeed has helped me refresh and made the day more meaningful.
I would also like to appreciate the Dissertation Committee Members, Prof Khellil Sefiane, Prof Koji Takahashi and Prof Masamichi Kohno for agreeing to participate in the review process and making many suggestions and comments.
I would like to send my sincere thanks to Prof Khellil Sefiane from the University of Edinburgh for enlightening and fruitful collaborations both in Japan and in the UK. The invaluable opportunity provided by him to work at the Institute of Multiscale Thermofluids of UoE gave me rich academic experiences and the enjoyable time with friends I met in Scotland. During my stay in Edinburgh, Dr Prashant Valluri and Dr Coinneach Mackenzie-Dover had helped me a lot with my experiments and living. I also deeply appreciate their kindness.
Equally, my special gratitude goes to Prof Jungho Kim from the University of Maryland, College Park for his generous welcome to the Phase Change Heat Transfer Laboratory of UMD. My first long-term stay abroad has changed me drastically in terms of an attitude to research, engineering and to failure, and of cultural perspectives. The parabolic flight—Vomit Comet—for the experiment with him and his student, Caleb, under microgravity has been an unforgettable experience. I could not thank enough for what he had provided me during my stay in the United States.
I would like to thank Prof Masamichi Kohno and Dr Naoya Sakoda for their
ii | P a g e
helpful advice in the lab meeting. I also sincerely appreciate Dr Sumitomo Hidaka and Ms Mitsuko Shuto for their kind support.
It can never go without expressing my true thanks to Dr Alexandros Askounis who have been always supportive, patient and respectful. My PhD project would not have been successful without his encouragement. I really thank you.
I’m also grateful to Dr Daniel Orejon who first demonstrated how to operate the experimental equipment, with patience, despite my poor English at that time.
I truly appreciate for his continuous help since I join the lab as a master student.
Special gratitude must also go to Dr Harish Sivasankaran, Dr Biao Shen and Dr Taichi Kuroki for their contribution to the lab activities.
Among my colleagues in the Thermofluid Physics Laboratory at Kyushu University, I should mention Dr Yuki Fukatani, Dr Masayuki Yamada, Mr Yuya Okauchi, Ms Zhenying Wang and Mr Huacheng Zhang who were closely working together. It has been my greatest pleasure being part of this group of exceptional individuals and of Kyushu University.
I acknowledge the Japan Society for the Promotion of Science, Japan Public- Private Partnership Student Study Abroad Program (TOBITATE! Young Ambassador Program) by MEXT, and the International Institute for Carbon- Neutral Energy Research (WPI-I2CNER) for their financial support through my doctoral course and research.
To conclude, I send my deepest gratitude to my parents, Kakutoshi and Rika, and my little sister, Nanase for their unconditional support and for believing in my decision toward my academic journey.
Due to the limited space, I apologise for not being able to mention all the people who have actually supported me. I wish to express my sincere gratitude by dedicating this work to abovementioned advisors, colleagues, all my friends and family.
22nd August, 2018—Yutaku Kita
iii | P a g e
Abstract
This thesis is devoted to experimentally elucidating the dynamics of liquid drops on gradients at the interfaces i.e. temperature and wettability gradients. A drop driven away from the equilibrium state will be “active” and will act in order to attain the energetically favourable state, inducing flows or drop motion. Actions that drops make in such situation are not merely of fundamental scientific interest but also exploring ways to activate or control a system containing drops has progressively become of importance in industrial and biomedical applications. The present study deals with drops of pure water, which is ubiquitous but unique, and investigates their thermocapillary-driven instabilities induced by localised heating and mobility on wettability gradients imposed via superhydrophobic microstructure patterning.
The First problem addressed in the thesis is the existence of thermocapillary
“Marangoni” flows in pure water which has been a long-standing controversial issue due to an ambiguity between theoretical predictions and little experimental evidence. The thesis reports the very first observation/visualisation of Marangoni-driven counter-rotating vortices in a pure water drop using infrared thermography coupled with optical particle imaging. The flows are induced by imposing a thermal gradient along the drop surface by locally heating the substrate directly underneath the centre with a laser. The origin of the flows is identified by comparing the dimensionless Marangoni and Rayleigh numbers, which shows the dominance of thermocapillary convection over buoyancy. This is further corroborated by a second set of experiments with an inverted system where the same flow patterns are observed regardless of the gravity orientation.
Secondly, as a systematic analysis, the effect of heating power and location on Marangoni flows as well as evaporation of water drops is studied. Heating
iv | P a g e
location is found to have a major impact on the flow patterns as recirculating vortices travel azimuthally within the drop when heating the centre whereas the flow direction remains fixed during edge heating. Further analysis of thermographic data allows to calculate the flow velocity which appears to increase for higher heating power as well as for the edge-heating case. Moreover, evaporation kinetics such as the rate of vaporisation and triple-line motion is found to be subject to the effect of local heating.
In addition to internal flows induced by thermal gradients, the last part of the thesis focuses on mobility of millimetre-sized water drops propelled by wettability contrasts/gradients. To this end, micropillar fabrication on hydrophobic surfaces is used in the present work to engineer wettability gradients by virtue of their wettability controllability and resultant superhydrophobic characteristic. A millimetre-sized water drop, placed at the boundary between two surfaces with different pillar densities, spontaneously moves toward the surface with more densely populated asperities, which is relatively more hydrophilic. Drop motion is found to accelerate proportionally with the difference in pillar densities on each surface, provided that the rear-side surface has sufficiently small pinning effect or contact angle hysteresis.
Furthermore, an analysis of surface free energy is implemented to rationalise the drop motion. Coupling the energy analysis with the experimental observations reveals that motion is initiated by the excess surface energy due to drop deformation and is directed in favour of energy minimisation. Lastly, a thermodynamic mechanism to predict the direction of the drop which at the same time suggests the criterion for the motion to ensue is proposed.
v | P a g e
Contents
Acknowledgement i
Abstract iii
Contents v
Nomenclature viii
Chapter 1 Introduction 1
1.1 Background 1
1.2 Fundamentals of Drops 8
1.2.1 Surface tension 8
1.2.2 Wetting of drops 10
1.2.3 Shape of Drops 15
1.2.4 Drop evaporation 17
1.3 Literature Review 20
1.3.1 Flows in drops 20
1.3.2 Drops on wettability gradients 30
1.4 Research Objectives 34
1.5 Thesis Organisation 36
Chapter 2 Thermocapillary Instabilities in Pure Water Drops 39
2.1 Experimental Methodology 40
2.1.1 Procedures 40
2.1.2 Infrared thermography 42
2.1.3 Heating profiles 42
vi | P a g e
2.2 Induction of Internal Flows of Drops 44
2.2.1 Emergence of twin vortices 44
2.2.2 Evolution of instability 47
2.3 Origin of the Vortices 50
2.3.1 Dimensionless numbers 50
2.3.2 Characteristic frequency 51
2.3.3 Effect of gravity orientation 51
2.4 Influence of Local Heating on Flows and Evaporation of Drops 52 2.4.1 Influence of heating power and location on flows 52 2.4.2 Thermal-gradient variations within the drops 57
2.4.3 Triple-line motion 60
2.4.4 Influence of local heating on evaporation rate 63
2.5 Summary 65
Chapter 3 Drop Motion on Surface Wettability Contrasts 69
3.1 Experimental 70
3.1.1 Micropillared surfaces 70
3.1.2 Experimental setup and procedures 72
3.2 Results and Analysis 74
3.2.1 Drop motion 74
3.2.2 Drop velocity versus Δϕ 76
3.2.3 Influence of contact angle hysteresis 78
3.2.4 Energy analysis 79
3.3 Summary 85
vii | P a g e
Chapter 4 Conclusions and Future Perspectives 87
4.1 Conclusions 87
4.2 Future Perspectives 89
Appendix 93
A.1. Supplemental Data for Chapter 3 93
A.1.1. Contact point behaviour 93
A.1.2. Surface free energy and energy diagram 95
List of Publications 99
List of Figures 103
List of Tables 110
References 111
viii | P a g e
Nomenclature
Physical properties
DAB Diffusion coefficient m2 s−1
g Acceleration due to gravity m s−2
M Molecular weight kg mol−1
α Thermal diffusivity m2 s−1
β Coefficient of thermal expansion K−1
μ Dynamic viscosity Pa·s
ν Kinematic viscosity m2 s−1
ρ Density kg m−3
σ Interfacial/surface tension N m−1
Other variables
ai Polynomial coefficient in Eq. (1.5)
A Area m2
c Vapour concentration kg m−3
fMa Characteristic Marangoni frequency Hz
fp Pinning force per unit length N m−1
G Surface free energy J
H Characteristic vertical length/height m
m Mass kg
P Pressure Pa
r Roughness factor -
R Characteristic radial length/radius m
t Time s
T Temperature °C
ΔT Temperature difference K
ix | P a g e
v Drop velocity m s−1
vMa Characteristic Marangoni velocity m s−1
V Volume m3
x, y Cartesian coordinates m
δ Normalised maximum three-phase contact line -
η Decay constant s−1
θ Contact angle degree or radian
λAB Characteristic Lennard-Jones length Å
λc Capillary length m
τMa Marangoni time scale s
ϕ Surface area fraction -
Δϕ Differential surface area fraction -
ΩD Diffusion collision integral -
Subscripts & Superscripts
∞ Surroundings
A, B Gas A and gas B (Chapter 2), or surface A, surface B (Chapter 3) adv Advancing
app Apparent base Drop base
c Critical
CAH Contact angle hysteresis cap Drop cap
E Equilibrium
ini Initial state
LV Liquid-vapour interface
max Maximum
meta Metastable state
min Minimum
x | P a g e
rec Receding
s Saturated condition SL Solid-liquid interface SV Solid-vapour interface
Dimensionless numbers
Bo (Static) Bond number 𝐵𝑜 =∆𝜌𝑔𝑅𝜎
𝐿𝑉
Bd Dynamic Bond number 𝐵𝑑 =𝑀𝑎𝑅𝑎
Ma Marangoni number 𝑀𝑎 = −𝜕𝜎𝜕𝑇𝐿𝑉𝐻𝜌𝜈𝛼𝑅𝑇
Ra Rayleigh number 𝑅𝑎 =𝛽𝑔𝐻𝜈𝛼𝑅𝑇
1 | P a g e
Chapter 1
Introduction
1.1 Background
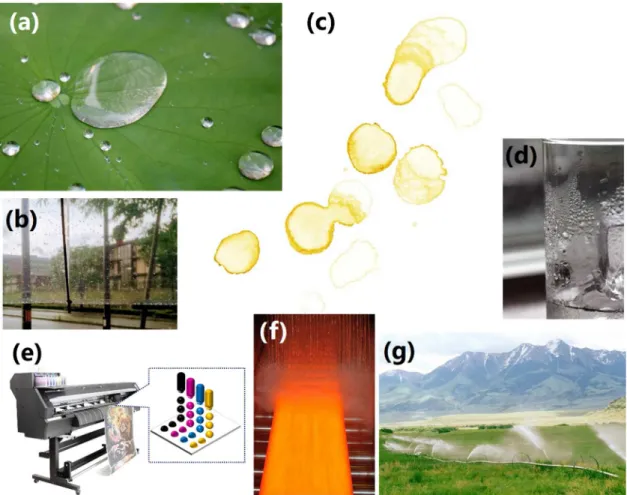
Liquid drops or droplets are omnipresent in nature and have inevitably caught people’s eye in the sweep of history as found in classic Japanese poems (waka) compiled in “Man’yoshu” in the eighth century. In the poems, the unidentified poet clearly observed raindrops rolling on a lotus leaf (Figure 1.1 (a)), which is under intensive research today, interestingly. Technically, a drop may be defined as a small (millimetric or smaller) column of liquid which is bounded by interfaces with other fluids or solids. In most situations, liquids come into contact with solid surfaces—sessile drops such as raindrops on an umbrella or window, spilled coffee on a desk and dew drops on a glass of cold drink, to name but a few (Figure 1.1 (b)–(d)). Besides the presence in nature, phase change and wetting of drops/droplets are also fundamental processes in practical applications e.g.
inkjet printing, spray cooling and pesticide application in agricultural fields (Figure 1.1 (e)–(g)). Thanks not only to the ubiquity but also to the importance in industrial and life processes, enormous scientific interest has been attracted to understanding the physics involved in sessile drops for centuries.
“A fluid of droplet on a solid surface is ostensibly so simple a physical system that one might suppose that all its behavior is thoroughly understood.”—Robert D. Deegan [1].
It is amazing to see, however, how complex a system where a small cluster of molecules sits on a solid surface can be: interaction between liquid and solid phases (wetting), internal/external flows, heat and mass transfer (phase change), vapour conditions and surface tension interplay at the macro-, micro- and meso-
2 | P a g e
Figure 1.1 Various situations in which drops/droplets are present including rain drops on (a) a lotus leaf and (b) an umbrella, (c) coffee-stain, (d) dew drops on a glass, (e) inkjet printing, (f) cooling process of molten steel and (g) sprinkled pesticides in an agricultural field.
Figure 1.2 Different aspects of physics involved in a sessile drop.
3 | P a g e
scopic scales (Figure 1.2).
The first interpretation, but still the foundation of the field, to how the equilibrium shape of a drop is formed dates back to the year of 1805 when the English physicist Thomas Young [2] proposed that there should be an
“appropriate angle” between the liquid-gas, solid-liquid and solid-gas interfaces.
The “angle” is today called the contact angle and is subject to the forces acting along these three interfaces in order to minimise their areas.
The second problem that came up in the late 19th century was evaporation of drops, which was first rationalised by the Scottish scientist James Clerk Maxwell.
In 1877, he published an article entitled “Theory of the Wet Bulb Thermometer”
wherein drop evaporation was considered as a simple diffusion-controlled process [3]. His diffusion model has currently been proven to be although correct nonetheless insufficient: considerable contributions of other factors such as heat transfer, convection, surface tension and surface morphology to phase change phenomena are widely recognised today [4].
One of the modern interest is hydrodynamics within drops/droplets, study of which has been progressively growing since the 1980s due to rising demand for industrial and medical applications such as inkjet and polymer coating [5]–[10], micro-/nanotechnology [11]–[13], biomedical analysis and diagnosis (Figure 1.3) [14]–[17]. Especially in the biomedical field, drop-based microfluidics or “Lab- on-a-chip” devices have recently been a promising technique capable of performing laboratory operations on a single integrated circuit—a chip using a much smaller amount of reagents in significantly less time (Figure 1.4) [18]–[24].
In these devices, drops play roles as capsules to carry reagents and as reactors wherein chemical reactions take place, and hence, efficient transport and mixing of the drops are paramount.
4 | P a g e
Figure 1.3 Patterns left by drying blood drops from people in good health (left panels in (a) and with different diseases (other panels). (a) and (b) are reproduced from Brutin et al. [16] and Sefiane [15], respectively.
Figure 1.4 Pictorial concept of drop-based lab-on-a-chip devices. Schematic of the device (bottom) and photograph of the actuation electrodes (up-right) are adapted from [23]
and [24], respectively.
5 | P a g e
Such particular functions can be added to a drop by dragging it away from the equilibrium state. Drops under a gradient of their nature e.g. surface tension, wettability and molar concentration become unstable (or “unhappy” as de Gennes et al. describe [25]). Consequently, they will drive convection, motion and/or phase change, depending on the type of gradient, in order to reach the energetically “happy” state. The comprehensive principle underpinning these actions was provided by American scientist and engineer Josiah Willard Gibbs in his pioneering article “On the Equilibrium of Heterogeneous Substances” [26], which formed the foundation of thermodynamics.
Capillarity is one of the tactics to functionalise a drop-based system due to the fact that surface (or interfacial) tension dominates the dynamics in micro/
millimetre-sized drops. In fact, besides abovementioned pioneers in this field, capillary phenomena have received great attention from other celebrated scientists. The first scientific article by Albert Einstein in 1901 was entitled
“Folgerungen aus den Capillaritätserscheinungen (Conclusions Drawn from the Phenomena of Capillarity)” [27]. Another example is the Nobel Prize laureate in 1991, Pierre-Gilles de Gennes, who committed his important carrier to this subject [25], [28].
When a drop experiences a local surface-tension gradient along its free surface, molecules with a stronger surface tension will pull ones with a weaker surface tension, resulting in fluid motion. This phenomenon was first pointed out in 1855 when James Thomson interpreted the “tears of wine” [29]. In his paper, he proposed as the mechanism underlying the phenomenon, for the first time, an imbalance of surface tension arising from non-uniform alcohol evaporation.
Despite his first discovery, the phenomenon is currently known as Marangoni effect, named after the Italian physicist Carlo Marangoni who demonstrated this effect resulted from a temperature variation in addition to chemical composition in his PhD dissertation [30]. In particular, surface tension of liquids is
6 | P a g e
temperature-dependent i.e. the higher the temperature is, the lower the surface tension becomes for typical fluids. Thus, when a temperature gradient exists at a liquid surface, a tensile force acts along the surface from the hot region toward the cold one (thermocapillary effect). Thermocapillary convection has been found in various pure liquids such as organic solvents and oils in forms of recirculating vortices and waves i.e. hydrothermal waves (HTWs), albeit its existence in pure water remains elusive [31]–[37]. Moreover, the nonlinearity or instability in dynamics arising from non-equilibrium systems often complicates the understanding and prediction of the phenomena.
In a similar fashion, if there is a tensile gradient along the solid-liquid interface, namely wettability gradient, one may expect the drop to move toward a high- wettability (attractive) region due to an imbalance of attraction forces acting on each side of the drop. Brochard first theoretically predicted drop motion on wettability gradients imposed by chemical and thermal principles [38]. The former was experimentally demonstrated for the first time by Chaudhury and Whitesides [39] and the latter was also proved by several researchers [40]–[42].
Besides the nature of surfaces, surface wettability can also be modified by their physical structures, which have already been put into practice by some wild creatures over their evolution (Figure 1.5): dessert beetles, for example, collect drinking water from moist wind using their bumpy backs [43]. Spider silk with micro-/nanoscale structural features can transport water by the resultant surface energy gradients [44]. However, the lack of our understanding of dynamic wetting phenomena e.g. contact line pinning and surface-kinetic energy conversion has made the development in this field challenging despite a great progress in bio-inspired surface manufacturing [45].
7 | P a g e
Figure 1.5 Surface structures of a desert beetle (left [43]) and spider silk (right [44]) capable of collecting water from moist air.
This thesis aims to contribute to the field of thermocapillary instabilities and wetting dynamics of drops under thermal and wettability gradients along the interfaces. These phenomena are not only of fundamental scientific interest but also the key issues for the aforementioned drop-based applications. Before proceeding to the present experimental work and discussions, this chapter will describe fundamental notions of physics involved in drops to establish the basic knowledge of the subject matter. Then, a brief review of the recent works in the fields that this thesis particularly focuses on will be given in order to highlight the latest advances as well as remaining problems, which will eventually identify the objective of the present study.
8 | P a g e
1.2 Fundamentals of Drops
A sessile drop, a small cluster of molecules sitting on a solid surface, may seem like a simple system at first glance. However, the presence of drops originates in interplay of many physical mechanisms including wetting, phase change, heat transfer and convection. Each of these aspects takes place at the molecular scale and can be very complex. This section briefly introduces basic knowledge of physics related to the focus of the thesis, which has been widely accepted in the field. More complete description of the phenomena can be found in the books such as “Interfacial Science [46]”, “Capillarity and Wetting Phenomena [25]” and
“Droplet Wetting and Evaporation [47]”.
1.2.1 Surface tension
When considering a system in which a liquid and its vapour coexist in a space i.e.
a two-phase system, one may define a sharp boundary between the liquid and vapour phases, namely a surface. At the molecular scale, in fact, the surface is a layer wherein physical values (e.g. density) vary as depicted in Figure 1.6. In the liquid phase, neighbouring molecules interact each other with the cohesive forces such as van der Waals forces and/or hydrogen bonds. The net force acting to each molecule is zero in the bulk liquid phase since they are attracted equally in every direction. By contrast, a molecule wandering near the surface has more neighbours on the liquid-phase side than on the vapour side, leading to a net force toward the liquid side normal to the surface. This resultant force is called the surface (or interfacial) tension and acts such that the surface forms a possible shape with a minimum area.
In terms of energy, another aspect of surface tension, an interior molecule possesses a lower energy than that at the surface since it consumes more energy to interact with surrounding molecules. However, a molecule at the surface has fewer neighbours to attract on the vapour-phase side, resulting in a higher energy
9 | P a g e
Figure 1.6 Pictorial representation of (left) a liquid/vapour system and (right) schematic molecular distribution in the vicinity of the liquid-vapour interface. The fluid density through the phases is plotted in red. Red arrows depict the interactive forces between neighbouring molecules.
state. This “unused energy” is the surface free energy and a larger surface area leads to higher surface free energy. For the system to be the minimum energy state, the surface area must be minimised to reduce the number of molecules experiencing an imbalance of attraction: a sphere has the smallest surface area for a given volume.
Surface tension, denoted as σLV, can be quantified as the surface free energy per unit area (J/m2), which can be equivalently expressed as the force per unit length (N/m). σLV depends on the nature of the liquid as well as the temperature and pressure. Typical values of the surface tension of a few common liquids are listed in Table 1.1.
Note that the term “surface” is specific to a boundary between liquid (or solid) and vapour phases. On the other hand, “interface” is a general term which includes boundaries between multiple immiscible fluids or between fluids and solids.
10 | P a g e
Table 1.1 Typical surface tension values of water, ethanol, acetone, glycerol and mercury at 20 °C under atmospheric pressure [25].
Liquid Water Ethanol Acetone Glycerol Mercury
σLV (mN/m) 73 23 24 63 485
1.2.2 Wetting of drops
Ideal surfaces
A perfect sphere of liquid is rarely seen around us since drops/droplets with a certain volume can hardly stay still in the air: for example, raindrops and sprayed mist eventually fall due to gravity and come into contact with solid surfaces.
Wettability refers to the ability of a solid surface to attract a liquid or of a liquid to keep contact with a solid surface. When a homogeneous solid surface
“moderately” attracts a liquid so that it will be partially wet, liquid, vapour and solid phases will coexist in the system, bounded by three interfaces i.e. liquid- vapour, solid-liquid and solid-vapour. The line where those three phases meet is called the triple-phase contact line, or just the contact line. Due to the action of interfacial forces, the contact line is pulled by each interface resulting in an equilibrium shape of the drop. Wettability is a result from the balance between those three forces at the contact line, which can be quantified using a macroscopic measure, contact angle (Figure 1.7). In 1805, Thomas Young proposed a pioneering relation between the contact angle and the interfacial tensions [2], which was later formulated by Athanase Dupré and Paul Dupré [48]:
𝜎𝐿𝑉cos 𝜃𝐸= 𝜎𝑆𝑉 − 𝜎𝑆𝐿, (1. 1) where θE is the equilibrium contact angle, σ the interfacial tension, and subscripts LV, SV and SL denote the liquid-vapour, solid-vapour and solid-liquid interfaces, respectively. Based on the contact angle, wettability can be categorised into two
11 | P a g e
Figure 1.7 Schematic illustration of Young’s relation, Eq. (1.1).
levels: hydrophilic (θE < 90°) and hydrophobic (θE > 90°).
Real surfaces—Wetting dynamics
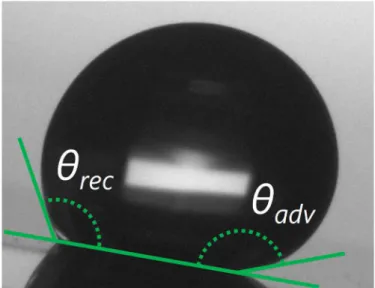
Young’s relation assumes an ideal surface i.e. chemically and physically homogeneous whereas real surfaces quite often contain either chemical (stains, blotches, blemishes) or physical (surface roughness) heterogeneities. Due to such deviations from ideality, the contact angle θ can vary within a certain range—the contact angle hysteresis (CAH). For instance, if one tilts a surface on which a drop sits (Figure 1.8), the drop can still remain at the original position despite gravity.
Instead, θ on the downside exceeds θE without any motion of the contact line until it reaches a threshold value θadv (referred to as the advancing contact angle) beyond which the contact line finally proceeds. Likewise, θ on the other side of the drop decreases below θE with the contact line being pinned. When θ reaches the receding contact angle θrec, the contact line shifts in such a way that the liquid retreats from the surface. Eventually, the drop will move downhill when θ on both sides attain to θadv and θrec, respectively. Therefore, CAH can be defined as the difference between θadv and θrec: CAH = θadv − θrec. CAH is a critical characteristic of dynamic wetting in which motion of interfaces is involved: a drop will be immobile if CAH is large.
Liquid
Solid Vapour σ LV
σ SL
σ SV θ E
12 | P a g e
Figure 1.8 Drop on a tilted surface, exhibiting the limit contact angles θadv and θrec before it slides off.
The comprehensive review of general wetting dynamics from a theoretical perspective has been given by de Gennes [28].
Effect of roughness
A typical non-ideal wetting situation is a drop on a surface with rough structures.
Surface roughness is known to greatly influence the wettability as well as drop mobility. In what follows, two famous models that describe different wetting regimes (complete and composite solid-liquid contact) on rough surfaces are introduced.
Wenzel in 1936 [49] was the first to explain the contact angle deviating from θE
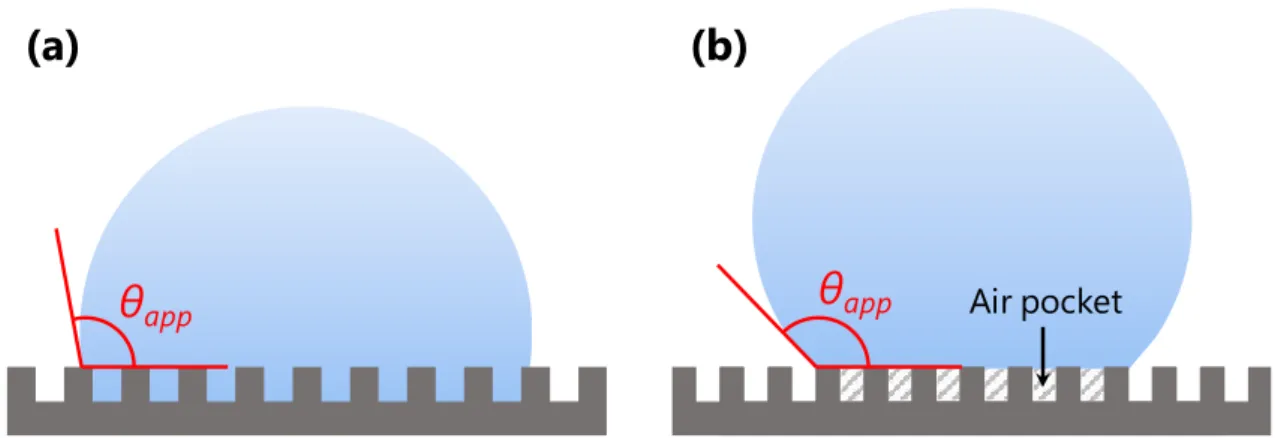
when a surface has asperities with the roughness factor r defined as the ratio of the actual surface area to the projected (apparent) area, therefore r > 1. When the liquid completely wets all the peaks and valleys of the surface(Figure 1.9 (a)), the apparent contact angle θapp follows the relation:
cos 𝜃𝑎𝑝𝑝 = 𝑟 cos 𝜃𝐸. (1. 2)
Eq. (1.2) implies that surface roughness magnifies the intrinsic wetting properties of the liquid and solid i.e. if θE < 90°, θapp < θE, and vice versa.
13 | P a g e
Figure 1.9 Schematic models of two different wetting states on rough surfaces: (a) Wenzel and (b) Cassie-Baxter states.
In contrast to the Wenzel model, Cassie and Baxter in 1944 [50] considered the heterogeneous wetting scenario: the liquid only contacts the top of the asperities, trapping air underneath the drop and between the structures (as shown in Figure 1.9 (b), often referred to as a “fakir” drop [51], [52]). Defining the surface area fraction of the solid that touches the drop as ϕ, the apparent contact angle θapp of the fakir drop can be expressed by
cos = −1 + cos + 1 . 1.3
For a Cassie-Baxter (CB) regime to be stable (energetically favourable), θE must be larger than a critical value θc, which can be derived by the energy comparison between Wenzel and CB regimes i.e. cos 𝜃𝑐 = (𝜙 − 1) (𝑟 − 𝜙)⁄ . In practice, the CB regime can be metastable even if θE < θc. In the CB wetting state, a drop attains θapp higher than 150° and exhibits small CAH (high mobility) compared with that in the Wenzel state. Such “superphobicity” can be found in nature e.g. lotus leaves and water strider’s legs and today, we are able to mimic these wetting characteristics by virtue of the recent development of microfabrication techniques and hydrophobic coating materials (Figure 1.10).
θ
appθ
app Air pocket(a) (b)
14 | P a g e
Figure 1.10 Exemplary photographs (upper panels) and scanning electron microscopic images (lower panels) of superhydrophobic rough surfaces: (a) a lotus leaf (lower panel is reprinted from [53]), (b) legs of a water strider [54] and (c) a surface with engineered micropillars [55].
Contact angle measurement
As described above, the contact angle is an essential factor that quantifies the wettability of a solid surface and determines what a drop will look like. Therefore, it is crucial to precisely measure contact angles for sessile drop analysis. From an image of a sessile drop viewed from the side (Figure 1.11), one can readily find the base radius Rbase and the height of the drop H. Using these values, the equilibrium contact angle θE can be simply obtained by the half-angle method:
𝜃𝐸 = 2 tan−. 𝐻
𝑅𝑏𝑎𝑠𝑒. (1. 4)
In this method, the drop profile is assumed to be a circular arc and axisymmetric, which is quite often far-fetched in real situations. Alternatively, the polynomial fitting method [56] finds an angle of tangent of the drop contour at the triple- phase contact point (Figure 1.11). In particular, the contour near the baseline is fitted with a polynomial function and the contact angle can be calculated as the
15 | P a g e
Figure 1.11 Side view of a sessile drop taken by (left) an optical camera and (right) the binary image. The definitions of the height H, the base radius Rbase are indicated with the green arrows, respectively. The red line shows a polynomial curve fitted along the drop contour near the contact point.
slope of the fitted curve at the contact point:
𝜃𝐸= tan−.3𝑑𝑦 𝑑𝑥6
789:;<: =8>9:= tan−.⎩⎪⎪⎨⎪⎪⎧
𝑑C∑ 𝑎𝑛𝑖=G 𝑖𝑥𝑖H 𝑑𝑥 ⎭⎪⎪⎬⎪⎪⎫
789:;<: =8>9:
, (1. 5)
where x and y are Cartesian coordinates, and ai is the polynomial coefficient.
Unlike the half-tangent method, the polynomial fitting method has no assumptions regarding the profile of the drop contour. Hence this approach is highly flexible to the contour of non-spherical drops and even asymmetrical ones, which further enables dynamic contact angle measurements with a tilting stage (Figure 1.8).
1.2.3 Shape of Drops
Properly tracing a drop profile is important for any experimental and theoretical study with drops. The drop shape is determined by capillary and gravitational forces and therefore, the static Bond number Bo is normally used as a criterion to evaluate which force will dominate the drop profile. Essentially, Bo measures the importance of gravity compared to capillarity and can be expressed as
𝐵𝑜 = 𝜌𝑔𝑅𝜎𝐿𝑉M, (1. 6)
16 | P a g e
where ρ is the density, g the acceleration due to gravity and R the characteristic radius of the drop. Notably, Bo smaller than unity (Bo << 1) suggests that the surface tension mainly dominates and thus, such drops shall form a spherical cap.
In contrast, if Bo > 1, then gravitational forces come into play and the drop shape will deviate from spherical.
Many of the works reported to date assumed a spherical cap as they usually dealt with small drops which satisfied Bo << 1. In such situations, one may obtain a simple relation between the volume V, the areas of the spherical cap (Acap) and drop base (Abase), R and θE as
𝑉 =𝜋𝑅P(1 − cos 𝜃𝐸)M(2 + cos 𝜃𝐸)
3 sinP𝜃𝐸 , (1. 7)
𝐴𝑐𝑎𝑝 = 2𝜋𝑅M
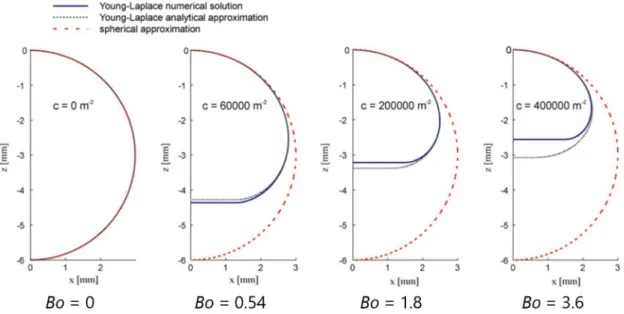
1 + cos 𝜃𝐸, 𝐴𝑏𝑎𝑠𝑒= 𝜋𝑅MsinM𝜃𝐸. (1. 8) In spite of the fact that Bo for water with V = 80 μL in normal gravity (i.e. ρ = 998 kg/m3, g = 9.8 m/s2 and σLV = 73 mN/m) still remains smaller than unity, even a 10 μL water drop will be significantly flattened due to gravity. Shape of such large drops shall follow the Young-Laplace equation, which determines the curvature at any point of a drop accounting for the gravitational effect [57]:
𝜎𝐿𝑉3 1𝑅.+ 1𝑅.6 = 𝜌𝑔𝐻 + 2𝜎𝑅 ,𝐿𝑉 (1. 9)
where R1 and R2 are the principal radii of curvature at any point of the drop. Eq.
(1.9) can only be solved numerically or analytically using approximations [58].
Figure 1.12 shows drop profiles predicted from numerical solution of Eq. (1.9), analytical approximation solution and spherical assumption for different Bo ranging from 0 to 3.6.
17 | P a g e
Figure 1.12 Half drop profiles calculated from numerical integration of the Young- Laplace equation, Eq. (1.9) (blue line), analytical approximation (green dotted line) and spherical approximation for a drop with R = 3 mm, θE = 180° and various Bo indicated below each panel [58].
1.2.4 Drop evaporation
Diffusion model
In the very vicinity of the liquid-vapour interface, one observes molecules going from the liquid to the vapour phase and vice versa. If the vapour phase is not saturated with the molecules, more will leave the liquid phase than those coming into, resulting in a decrease in mass/volume of the liquid—evaporation. Natural drop evaporation is essentially controlled by the vapour diffusion into the vapour phase, which follows Fick’s law.
Maxwell [3] was the first in 1877 and Langmuir [59] the second in 1918 to describe the evaporation of a sphere drop based on the diffusion theory. Both derived the rate of mass decrease as − 𝑑𝑚 𝑑𝑡⁄ = 4𝜋𝑅𝐷𝐴𝐵(𝑐𝑠− 𝑐∞), where m denotes the mass, t the time, DAB the diffusion coefficient, cs and c∞ the vapour concentrations at the interface (saturated) and the surroundings, respectively.
In the case of sessile drops, the existence of a solid surface drastically changes
18 | P a g e
Figure 1.13 Distribution of the evaporative flux along the surfaces of drops with different contact angles: (a) θ = 10°, (b) θ = 90°, (c) θ = 170° and (d) θ = 180° [60].
the evaporative behaviour. Unlike spherical drops, in fact, the mass flux distribution along the surface of a sessile drop is not uniform and can be expressed as a function of the contact angle. Applying Maxwell’s analogy with electrostatics to the sessile drop case, Picknett and Bexon [61] obtained the rate of evaporation as
−𝑑𝑚
𝑑𝑡 = 𝜋𝑅𝑏𝑎𝑠𝑒𝐷𝐴𝐵3𝑐𝑠− 𝑐∞6 𝑓(𝜃), (1. 10) where f(θ) is the drop shape factor, which is a function of the contact angle. The analytical and approximated expressions of f(θ) have been proposed by many relevant works such as Hu and Larson [62] and Popov [63]. Figure 1.13 shows the evaporative flux numerically solved for drops with different contact angle [60].
19 | P a g e
Figure 1.14 Schematic representation of drop evaporation modes: (left) constant contact angle (CCA), (middle) constant contact radius (CCR) and (right) stick-slip.
Evaporation modes
As a sessile drop evaporates, its shape shall change. The evaporation mode describes how the drop shape evolves during the evaporation. Two extreme modes and their mixed mode are usually observed (Figure 1.14):
1. Constant contact angle (CCA) mode. A drying drop keeps its aspect ratio.
In other words, the contact line recedes with θ being kept constant i.e. θE during the evaporation. CCA mode is considered ideal since it can only be realised when any contact angle hysteresis (CAH) is absent.
2. Constant contact radius, CCR. The second extreme case is a drop evaporating with its contact line being fixed over the lifetime.
Simultaneously, θ decreases in order to adapt to the volume loss.
3. Mixed or stick-slip mode. In most actual situations, a drop begins to evaporate in CCR mode where the contact line is pinned due to CAH (stick). θ decreases as the evaporation proceeds until it reaches θrec, at which point the contact line begins to slide, recovering θ.
The evaporation modes depend on the wetting properties of the solid surface, especially CAH, and strongly influence the drop lifetime [61], [64]–[66].
θrec Slip
Stick-slip
θE
Rbase(t)
θ(t) Rbase, ini
CCA CCR
20 | P a g e
Influential factors
Although drop evaporation is mainly limited by vapour diffusion, there are many factors that affect the evaporation behaviour [4]. In addition to vapour concentration gradients and wettability, substrate thermal properties [67]–[70], substrate heating [71]–[73], internal/external convection [72], [74]–[76] and components in liquid and vapour phases [77]–[80] are known to contribute to drop evaporation.
1.3 Literature Review
Having established the fundamentals of wetting and evaporation of drops, let us now further look at recent research topics including fluid motion inside drops and drop manipulation using capillary phenomena.
1.3.1 Flows in drops
Impacts of fluid flows on drop-based applications
Control of convection/flow in liquid drops has been a key issue, for decades, as a fundamental phenomenon involved in inkjet printing/polymer coating [5]–[7], [9], [81], [82], DNA mapping [83]–[87], and pattern formation [88]–[90] to name a few. In these applications, uniform particle deposition is normally desired and internal flows of a drop plays a principle role in transporting particles during the which is responsible for the ring-like pattern formation. Figure reproduced from Deegan et al. [34]. evaporation. Moreover, as mentioned above, use of drops as a working fluid in microfluidic “Lab-on-a-chip” devices has recently been explored [18]–[22], [91]. In these devices, efficient mixing inside a drop is paramount for reducing time of chemical reaction or biomedical diagnosis [22], [92]–[96]. However, in a millimetre sized drop whose Reynolds number is usually low, the mixing rate often relies on mass diffusion, making the process optimisation challenging [94], [96]. In what follows, three different types of fluid
21 | P a g e
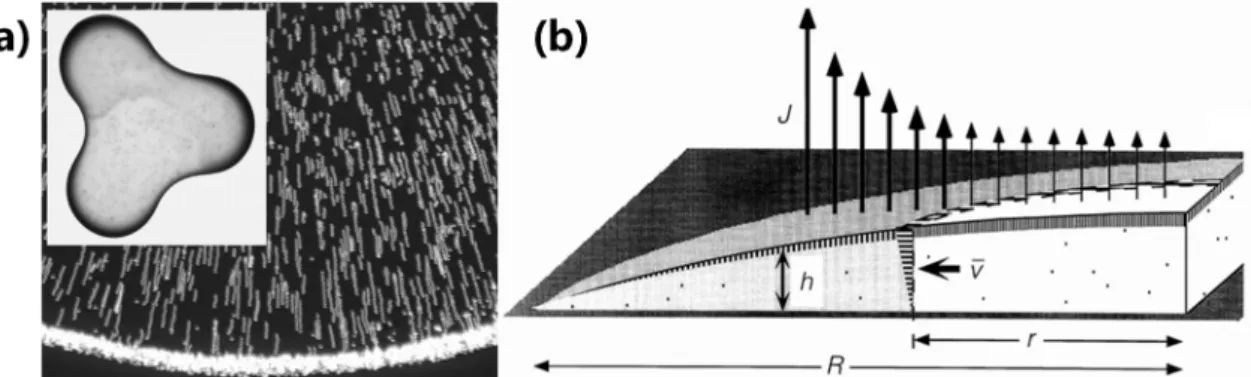
Figure 1.15 (a) Small spheres in a water drop during evaporation accumulated at the edge. The inset is a stain left by a 2 cm-diameter drop of coffee having dried on a solid surface. (b) Schematic illustration depicting the mechanism of the outward capillary flow
motion in pure drops, which originate in evaporation and temperature gradients, are reviewed with the recent experimental/theoretical reports.
Outward capillary flow
Although a drop of coffee is a solution of colloidal particles dispersed over entire liquid, it leaves a concentrated, ring-like stain along the periphery after its evaporation (Figure 1.15 (a)). Why? Deegan et al. first attempted to explain so- called “coffee-ring effect” as a deposition of particles transported toward the drop edge by the capillary, outward flow [34]. This outward flow is induced by the non-uniform evaporation flux over the drop (Figure 1.15 (b)). In particular, as shown in Figure 1.13, a drop whose θ is smaller than 90° evaporates mainly from the vicinity of the contact line. The fluid then begins to flow radially toward the edge to replenish the liquid lost by evaporation. The resultant outward flow is capable of carrying virtually all the dispersed materials to the periphery. The coffee-ring effect is detrimental to practical applications such as inkjet printing, coating, crystal growth and DNA mapping, which require uniform deposit.
There have been several techniques proposed to suppress this effect by adding elongated particles [97]–[99], solvents with different volatility [9], wettability modification [73], [100], electrowetting and acoustic principles [101], [102].
22 | P a g e
Natural convection
When a drop on a horizontal substrate evaporates freely under isothermal condition, the drop will cool down as the energy required for the molecules to leave the drop is consumed (the latent heat). Heat will be then supplied from the substrate if it is thermally conductive, giving rise a temperature gradient across the entire drop. The temperature profile has been identified experimentally and theoretically, that the temperature becomes colder at the apex than the bottom due to the differential length of heat conduction path [72], [103]–[105]. This thermal gradient will be pronounced when heating the substrate.
With such temperature profile (colder at the apex than the edge), one may expect an emergence of buoyancy-driven natural convection inside the drop.
Kang et al. [106] performed experimental and numerical investigations of natural convection in evaporating aqueous solutions of NaCl. They presented the particle image velocimetry (PIV) and computed velocity fields which showed a pair of vortices that recirculated particles in an opposite direction to the outward capillary flow.
More recently, Dash et al. [95] reported different flow patterns in water drops depending on substrate temperature as well as the degree of hydrophobicity (Figure 1.16 (a)). As a systematic analysis, they attempted to scale the flow velocity by the non-dimensional Rayleigh number Ra:
𝑅𝑎 =𝛽𝑔𝐻]∆𝑇
𝜈𝛼𝑅 , (1. 11)
where β denotes the coefficient of thermal expansion, ν the kinematic viscosity, , α the thermal diffusivity and ΔT the temperature difference. It is readily apparent from Eq. (1.11), that Ra represents the magnitude of buoyant force compared to viscous force. In their work, PIV was also conducted and the velocity was found to increase proportionally as Ra increases (Figure 1.16 (b) and (c)), leading to the conclusion that the flow was buoyancy in origin.
23 | P a g e
Figure 1.16 Buoyancy-driven natural convection in water drops on substrates with different temperature and wettability. (a) Temporal snapshots demonstrating dye mixing in evaporating water drops on a superhydrophobic substrate kept at (upper-left) 40 °C, (lower-left) 50 °C, (upper-right) 60 °C, and (lower-right) on a hydrophobic substrate kept at 60 °C. (b) Flow visualisation and velocity maps inside a drop on a hydrophobic surface maintained at 50 °C. (c) Maximum velocity measured for each drop as a function of Rayleigh number. Figure reproduced from Dash et al. [95].
Except for the superhydrophobic cases, the natural convection in the drops was such that the fluid was lifted upward at the centre and it returned along the liquid surface which acted as a wall. Then, the fluid flowed inward along the substrate and eventually recirculated. The flow velocity due to natural convection was reported to be typically order of 10–100 μm/s. These experimental observations have been corroborated by numerical simulations such as Kang et al. [106], Pan et al. [107], and Pradhan and Panigrahi [108].
24 | P a g e
Thermocapillary convection
For a drop whose size is comparably small as the capillary length 𝜆 = 𝜎𝐿𝑉⁄𝜌𝑔, capillary forces predominate the dynamics. As described in subsection 1.2.1, surface tension varies as a function of temperature T: 𝜎𝐿𝑉(𝑇) = 𝜎𝐿𝑉(𝑇G) − (− 𝜕𝜎𝐿𝑉⁄ )(𝑇 − 𝑇𝜕𝑇 G) for pure liquids. Therefore, temperature gradients arising across the drop due to its evaporation and/or heating can lead to surface tension gradients, which in turn induce forces acting along the surface, from the hot region, where σLV is small, to the cold region, where σLV is large. This force is called the thermocapillary force and is capable of driving a fluid flow i.e.
thermocapillary or Marangoni convection. The dimensionless Marangoni number Ma measures the strength of the thermocapillary force compared with viscous one and can be expressed as
𝑀𝑎 = −𝜕𝜎𝐿𝑉
𝜕𝑇 𝐻M∆𝑇
𝜌𝜈𝛼𝑅 . (1. 12)
Considering the stability of a horizontal liquid layer subject to a temperature gradient, Pearson [109] proposed the critical Ma for the Marangoni convection to ensue as Ma ≈ 80.
Numerous experimental and numerical studies have revealed the characteristics of Marangoni flows in a drop of various liquids and their influences on evaporation, heat transfer and pattern formation.
Ruiz and Black [74] developed an axisymmetric numerical model to demonstrate the contribution of the surface-tension-driven fluid motion to heat transfer and evaporation (Figure 1.17 (a)). Hu and Larson [104] then theoretically investigated the effect of contact angle on the velocity field and the temperature profile developed by Marangoni effect. In their numerical solutions, a strong recirculating flow along the liquid-vapour interface from the edge to the apex of the drop was observable when the contact angle was high (Figure 1.17 (b)).
25 | P a g e
In the experimental work done by Hu and Larson [32], a strong recirculating flow in octane drops was clearly visualised by means of fluorescent particle illumination. The flow regime resembled that predicted by their numerical simulation (Figure 1.18 (a)). Moreover, they stressed the possibility that the Marangoni effects could reverse coffee-ring depositions (Figure 1.18 (b)).
Chandramohan et al. [110] carried out PIV and reported strong Marangoni convection in volatile organic drops on a nonwetting surface. The velocity in the drop was reported to be on the order of 10–45 mm/s for a high contact angle, leading them to stress the importance of Marangoni flow in heat transfer within the drop and in predicting the evaporation rate.
It was a decade ago when Sefiane et al. in 2008 made use of infrared (IR) thermography for the first time to unveil thermal activities in volatile drops e.g.
ethanol, methanol and FC-72 [33]. These drops displayed wave-like thermal instabilities propagating across the drop surface, which were similar to so-called hydrothermal waves (HTWs) as conventionally observed in thin liquid layers and disks [111]–[115]. What was unique in the case of evaporating drops is the fact that HTWs were self-excited: thermal gradients that drove the instability were generated spontaneously by the evaporative cooling effect whereas a radial temperature gradient needed to be imposed in liquid layers. Figure 1.19 presents IR thermal images of drying drops of water, methanol and FC-72 reported by Sefiane et al. [33] as well as HTWs in an annular liquid disk imaged by the shadowgraph technique shown by Garnier et al. [115].
Following the criterion proposed by Garnier et al. [115], that is the dynamic Bond number Bd—the ratio of buoyancy over thermocapillarity i.e. Bd = Ra/Ma, Sefiane et al. identified the thermal patterns as HTWs induced by Marangoni effects as Bd << 1. This fact was further supported by a linear stability analysis completed by Karapetsas et al. [116] and more directly by Carle et al. [117] who observed the same thermal patterns regardless of gravity during parabolic flights.
26 | P a g e
Figure 1.17 Numerical simulations of Marangoni recirculation in an evaporating drop.
(a) Temporal evolution of isotherm (left) and stream (right) contours for a water drop with an initial base diameter of 0.1 mm on a 100 °C substrate [74]. (b) Velocity fields on a drop with different contact angles, 40° and 20° [104].
Figure 1.18 (a) Visualisation and prediction of flow in a drying octane drop. (b) Deposition patterns of fluorescent particles left after evaporation of (left) water and (right) octane drops. Insets are particle distributions across the deposition. Figure reproduced from Hu and Larson [32].
27 | P a g e
Figure 1.19 Hydrothermal waves (HTWs) in evaporating drops and an annular liquid layer. (a) Temperature maps of water, methanol and FC-72 drops obtained by IR thermography [33]. (b) Shadowgraphs of an annular, thin disk of silicon oil where a temperature difference was imposed from the centre (cold) to the exterior (hot) [115].
Since their pioneering findings, a lot of effort has been made to investigate the contribution of HTWs to evaporation and heat transfer [118], and the effects of substrate thermal conductivity [119], heating [37], [118], [119], atmospheric component or humidity [79], [120] and the geometry of drops [121] on HTWs.
In spite of abundant experimental [31]–[33], [37], [110], [117]–[119], [121] and theoretical [72], [104], [105], [116], [122]–[127] evidence of Marangoni flows in evaporating drops of highly volatile liquids, the existence of which in pure water remains controversial [128].
Many theoretical works have predicted vigorous thermocapillary-driven recirculating flows in water, such as Ruiz and Black [74], Hu and Larson [104], Girard et al. [122], Yang et al. [105] and Sáenz et al. [126]. However, there has been
28 | P a g e
little experimental corroboration despite a number of attempts made for more than a decade [32], [33], [35]–[37], [126], [129], [130].
Savino et al. [129] captured motion of tracers in evaporating hanging drops and reported an absence of Marangoni convection in water, albeit n-octane exhibited the convection. The same conclusion was made by Hu and Larson [32]
who looked at the deposition pattern after a water drop dried: a clear ring-like deposition was formed due to the outward flow while the Marangoni-driven reversal of the coffee-ring effect was evident for octane drops (Figure 1.18 (b)).
Sefiane et al. [33] reported no thermal activities on the surface of a water drop viewed by IR thermography (Figure 1.19 (a)) in contrast to HTWs which appeared in volatile liquids. This observation has been agreed by follow-up investigations i.e. Brutin et al. [37] and Sáenz et al. [126].
Deegan et al. [131] and Hu and Larson [104] attributed the deviation from the theoretical predictions to surface-active contaminants that aggregate on the drop surface. These contaminants are capable of supressing Marangoni effect and almost unavoidable for water, which possesses a strong attracting force due to the high polarity.
The work done by Ward and Duan [130] was successful to detect the existence of Marangoni convection by monitoring the temperature profile in the liquid phase closely to the interface, which was homogenised in a thin, ca. 0.1 mm below the interface due to the turbulent thermocapillary flow (Figure 1.20 (a)). They employed a stainless-steel funnel enclosed in a chamber, where water was supplied through the funnel throat to the mouth in order for the height of the surface to be kept constant (Figure 1.20 (b)). In their experiments, extreme care was taken such that water was not exposed to atmosphere after degassing and filtering, and the pressure of the chamber was reduced to ~10−5 Pa which might have helped minimise contamination. They also questioned the applicability of aforementioned Peason’s model [109] to evaporating liquids as it did not take
29 | P a g e
Figure 1.20 (a) Temperature profile measured across the liquid and vapour interfaces when water evaporates from (b) the stainless-steel funnel in the environmental chamber.
Figure reproduced from Ward and Duan [130].
Figure 1.21 Particle motion at the edge of an evaporating water drop. The arrows in (a)–
(f) indicate the different positions of a particular particle at different time: (a) 0 s, (b) 0.75 s, (c) 1.5 s, (d) 2.25 s, (e) 2.5 s and (f) 2.75 s.(g) and (h) are superimposed pictures to illustrate the streak of the particles. Figure reproduced from Xu and Luo [35].
phase change into account. Therefore, they attempted further analysis to verify the critical Ma (≈ 80) and demonstrated that above Ma ≈ 27,000 was required for water to induce the convection [36].
Xu and Luo [35] observed using a microscope fluorescent particles, which were seeded in a drying pendant drop of water, being carried by outward flow,
30 | P a g e
and then, returning along the surface (Figure 1.21). The return flow was attributed to the Marangoni stress arising from the evaporation. They implied that the suppression of the Marangoni effect in water may be caused by other factors besides surfactant contaminant.
1.3.2 Drops on wettability gradients
In addition to what happens in a liquid drop experiencing temperature gradients, and thus surface-tension gradients along the drop surface, how a drop behaves on wettability gradients has also been of great interest in scientific and industrial communities for decades. In particular, drop manipulation/transport is a critical issue in the development of microfluidic devices for bio-chemical assays [18]–
[22], [132], [133], self-cleaning surfaces [134]–[137], anti-icing [138]–[142] and better heat transfer surfaces e.g. dropwise condensation enhancement [143]–[146], amongst others. The study on how to “fuel” or propel drops in such systems has been progressively active in recent years and this subsection provides an overview of the strategies that have been proposed to date. A review paper by Lach et al. comprehensively summarises the recent progress in this field [147].
In contrast to drop manipulation in a liquid bath, where a drop can either crawl [148], [149] or drift on a fluid current [150], [151] by chemically-/thermally- induced Marangoni effect, triggering drop motion on horizontal solid surfaces has been rather challenging due to the strong adhesion [28]. In 1989, Françoise Brochard-Wyart [38] first theoretically predicted drop motion on wettability gradients imposed by chemical or thermal gradients. She proposed the differential capillary forces acting on each side of a drop as the driving force.
Chemical gradients
In their seminal work, Chaudhury and Whitesides [39] followed Brochard’s approach and fabricated surfaces with a spatial chemical gradient imposed by the silanisation process. They reported the resulting wettability gradient varying
31 | P a g e
from 97° to 25° for water over a distance of 1 cm and very low contact angle hysteresis (CAH, 6–8°). On these surfaces, water, glycerol and chloroform drops were capable of climbing up to a 15° incline (Figure 1.22 (a)).
Inspired by their work, successful experimental and theoretical achievements on motion of a drop on chemical gradients have been abundantly reported [41], [143], [146], [152], [153]. Hernández et al. [152] demonstrated similar motion of water and dimethyl-methylphosphonate drops on gradually oxygenated graphene (Figure 1.22 (b)). Essentially, graphene is molecularly so smooth that it should have almost zero CAH. By adding oxygen to graphene surfaces, they attained higher attraction force than bare graphene, which mainly originates in the van der Waals forces, resulting in drop motion toward the oxygen-rich graphene surface. Their experiments have been corroborated by molecular dynamics simulations performed by Liu and Xu [153].
Thermal gradients
As surface tension is dependent on temperature, Brzoska et al. [40] showed polydimethylsiloxane (PDMS) oil drops moving on thermal gradients of 0.35, 0.57, 0.75 and 1.0 K/mm. They prepared a very smooth, hydrophobic surface using temperature-controlled silanisation on a silicon wafer, which provided CAH of ca. 2°. In spite of such large temperature gradients, the drop velocities were quite slow and order of 1 mm/min.
More than two decades later, Bjelobrk et al. [42] recently demonstrated the remarkable enhancement of drop motion using lubricant-impregnated surfaces, which provided negligible CAH (Figure 1.22 (c)). Other techniques to boost thermocapillary drop motion have been reported by coupling chemical gradients [155] and physical vibration [156].
Electrowetting
Electrowetting has been a powerful principle that allows to actuate and switch drops on a solid surface (Figure 1.22 (d)) [154], [157], [158]. Based on the theory
32 | P a g e
Figure 1.22 Several tactics for drop manipulation based on chemical, thermal and electrowetting principles. (a) Uphill motion of a water drop on a chemical-gradient surface [39]. (b) Colour map showing a gradient of oxygenized graphene and snapshots of actual drop motion [152]. (c) IR thermographic images showing thermocapillary- driven motion of a drop on a lubricant-impregnated surface [42]. (d) Schematic illustration of electrowetting phenomenon and its application for separation of a drop [154].
from a thermodynamic perspective, an electric field applied across a drop on a substrate is capable of modifying the interfacial tension—the Gibbs free energy, which contains both chemical and electrical components. Recently, electrowetting-based drop actuation has been applied in digital microfluidics [19], [21], [24]. However, the performance of wettability control is limited by substrate materials, type of fluids and the unrevealed contact angle saturation phenomenon.
33 | P a g e
Roughness gradients
Microtexture/pillar fabrication on solid surfaces is another promising technique which allows precise control of wettability. As introduced in subsection 1.2.2, when a liquid completely penetrates microstructures of a surface i.e. the Wenzel state, the apparent contact angle θapp is subject to the roughness factor r. On the other hand, in the Cassie-Baxter (CB) state where a drop is supported on the pillars with air trapped underneath, θapp can be controlled by the surface area fraction ϕ. As pointed out above the importance of CAH which can oppose any motion of drops, CB drops are generally preferred for high mobility compared with those in the Wenzel state.
Shastry et al. [159] were the first who experimentally demonstrated directional motion of 5 μm water drops on microstructure gradients—from the region with small ϕ to that with large ϕ. However, the motion was not spontaneous and mechanical vibration was required to drive the drop. They interpreted this by an analytical force balance calculation which accounted for CAH and estimated a slope of ϕ necessary to overcome CAH and to ensue the motion. However, they were not able to create such surfaces and to report spontaneous motion.
Reyssat et al. [160] also manufactured a gradient of micropillars and observed drop motion only when the substrate was vertically shaken (Figure 1.23 (a)).
Along the substrate vibration, the drop itself also oscillated, experiencing wetting and dewetting events (Figure 1.23 (b)). They carefully monitored the drop shape and position, and found that the displacement took place mainly during thedewetting events as a result of asymmetric retreat of the contact line (Figure 1.23 (c)). Then, they approximated the dewetting event as a rebound of an impinging drop and derived a scaling-law model which suggested that drop velocity would increase as a function of input vibrational energy as well as micropillar gradients. Moreover, they reported that the velocity reached maximum when the substrate was shaken at the resonant frequency of the drop.
34 | P a g e
Figure 1.23 (a) Circular micropillars gradually spaced such that the slope of ϕ was 70 m−1. (b) Snapshots of a water drop (R = 1 mm) moving on a vibrating micropillared surface. (c) Evolution over time of positions of the drop (front, middle, and rear) presented in (b). Both wetting and dewetting events are indicated in the graph. Figure reproduced from Reyssat et al. [160].
Unfortunately, they did not experimentally investigate the effect of the slope of micropillar density, neither did Shastry et al. [159], and the validity of their model has not been entirely confirmed.
Moradi et al. [161] performed a lattice Boltzmann simulation to study spontaneous drop motion induced by roughness gradients. They pointed out significant dependence of drop velocity on surface tension of the liquid as well as pillar arrangements.
1.4 Research Objectives
In the previous sections, fundamental phenomena involved in sessile drops and recent research works regarding internal flows and motion of drops have been thoroughly reviewed. It is apparent that capillary and wetting phenomena are
![Figure 1.4 Pictorial concept of drop-based lab-on-a-chip devices. Schematic of the device (bottom) and photograph of the actuation electrodes (up-right) are adapted from [23]](https://thumb-ap.123doks.com/thumbv2/123deta/9878433.1905314/18.892.153.747.529.1044/figure-pictorial-concept-devices-schematic-photograph-actuation-electrodes.webp)
![Figure 1.5 Surface structures of a desert beetle (left [43]) and spider silk (right [44]) capable of collecting water from moist air](https://thumb-ap.123doks.com/thumbv2/123deta/9878433.1905314/21.892.131.770.125.667/figure-surface-structures-desert-beetle-spider-capable-collecting.webp)
![Figure 1.10 Exemplary photographs (upper panels) and scanning electron microscopic images (lower panels) of superhydrophobic rough surfaces: (a) a lotus leaf (lower panel is reprinted from [53]), (b) legs of a water strider [54] and (c) a surface with e](https://thumb-ap.123doks.com/thumbv2/123deta/9878433.1905314/28.892.131.765.131.458/exemplary-photographs-scanning-electron-microscopic-superhydrophobic-surfaces-reprinted.webp)
![Figure 1.13 Distribution of the evaporative flux along the surfaces of drops with different contact angles: (a) θ = 10°, (b) θ = 90°, (c) θ = 170° and (d) θ = 180° [60]](https://thumb-ap.123doks.com/thumbv2/123deta/9878433.1905314/32.892.132.763.128.626/figure-distribution-evaporative-surfaces-drops-different-contact-angles.webp)